10V Reference deviation calendar
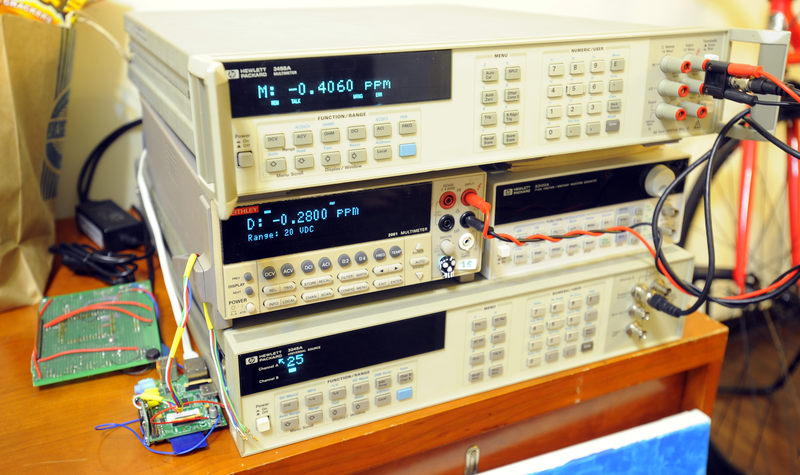
Keithley 2001 Reference meter, monitoring HP 3245A +10.00000VDC outputWorkflow:
* RPI reads measured value from Keithley 2001 GPIB and saves into CSV, Reference value, measured value and deviation in ppm. Data is sampled with date/time stamp* CSV uploaded to http location daily by script
* Python scripts parse raw data and generates daily-ppm deviation table CSV file. Raw data for last 24 hours plotted here
* Page https://xdevs.com/datalog/ runs D3.js library to read CSV ppm/day file test.log to input data
* D3.js plots SVG graph online with ppm/day log :)
Current setup:
Sample data formatting:
Date,Reference,Meas,Temp
[327] 2015-11-23,10.0,10.00001204,40.600, samples = 3895
[328] 2015-11-24,10.0,10.00001803,40.400, samples = 9105
[329] 2015-11-25,10.0,10.00001857,40.500, samples = 3337