- Intro
- Manual references
- Initial photos and conditions
- Day 1: Power checks and initial diagnostics
- Day 2: diagnostics, A5 board test and installation
- Day 3: diagnostics, A2 board
- Day 4: A3 reference measurements
- Day 5: A1 test
- Day 6-9: New A3 installation
- Day 10-22: Modification for lower LTZ1000ACH oven temperature
- Day 23: DC 10VDC test with reference input
- Day 30: Calibration adjustment prior to final test
- Day 33: Final calibration tests and report
- Day 40-50: Comparisons to other xDevs.com lab gear
- Day 52: Minor fixes and touch-up
- Day 394: Comparison of ACV performance versus 5790A
- Day 550: Front-panel connector replacement and cleaning
- Thermal infrared images
- Summary
Intro
After a year of use in original rusty repaired 3458A it’s advantage in lab and operation performance was obvious and clear. Biggest benefit of this precision DMM is due it’s ultra-high ADC performance and benefits which come from it: Calibration from single 10 V and 10 KΩ standards and ACAL function to remove drift and thermal coefficient errors.
My good friend once mentioned – it’s nice to have at least two pieces of everything. In case of primary reference instrument failure, you still have backup B unit to chase the precision rabbits. While this sounds like a great idea, buying even used good for 3000-5000$ USD DMM just to keep spares is a bold move, especially for hobby home lab. This plan was put on hold, till very recently, when I got a chance to buy another unit. After some seller-related shenanigans, second unit was finally shipped and this repair work-log of second HP 3458A is now possible!
And to follow our best tradition, unit is completely broken and non-functional. Not even photos of power on were possible. There is no fun in buying working equipment. No room for learning how to fix stuff! :)
Manual references
A User’s Guide to Keysight 3458A Front Panel Operation
3458A Multimeter User’s Guide, Edition 7
Keysight 3458A Multimeter datasheet
Agilent 3458A : Quick Reference Guide, Edition 2, Dec 2000
3458A Multimeter Calibration Manual, Edition 7
3458A Multimeter Calibration Manual, Edition 6
3458A Multimeter Assembly Level Repair Manual, Edition 2
3458A Multimeter Component Level Repair Manual
Service notes
There are service notes/engineering changes were published during years of 3458A’s lifecycle. If your unit is old, worth to check if any of them required to do.
Service note 3458-01C : A/D Linearity Improvement
Service note 3458-04A : Apparent failure at turn-on or when given a “RESET” command
Service note 3458-07B : Modification to Fix Intermittent Error “Multislope Rundown Conversion”
Service note 3458-08A : Incorrectly Labeled Line Voltage Switches May Cause Switch Setting Confusion
Service note 3458-10A : 3458A Documentation Available As “On-Line” Files
Service note 3458-12B : Outguard Firmware Upgrade: Enhancements, Fixes, & Changes
Service note 3458-12C : Outguard Firmware Upgrade: Enhancements, Fixes, & Changes
Service note 3458-13A : GPIB Communication Failures Using the 3458A
Service note 3458-14B : Calibration Error After Power “On” or After an “ACAL”
Service note 3458-17 : Errors May Occur if ACAL AC is Initiated From the 4-Wire Ohms Function
Service note 3458-20 : Bad SRAM causing Cal Ram batteries to fail prematurely
Initial photos and conditions
Like a wizard with all-see crystal sphere, here are list (likely not complete) of issues present with the box.
- Missing A5 PCBA (Outguard controller) Replacement bought and installed
- Bad VFD? VFD is good and bright
- Missing top inguard cover. Replacement installed
- Damaged front panel bezel Replacement ready
- Scratched display window Replacement ready
- Damaged front terminal block Replacement bought and installed, ouch $290 USD
- A3 has balanced rundown convergence issue, stops working instantly A3 replacement installed, stable and good!
- A2 has offsets on all ranges Fixed by recalibration
- A1 can pass ST/ACAL with good A2/A3 OK
Day 1: Power checks and initial diagnostics
Take a look on that sick box. Understanding is beyond me, how these precision very specialized instruments can end up in shape like this.

Image 1: Front panel
Rear side is okay, nothing bad there, except obvious sign of missing A5 Outguard board with GPIB connector.

Image 2: Rear panel
Plastic front panel is literally torn in pieces, just like some angry hulk was hungry. Front panel terminals did not survive the abuse, so that’s a $229 USD right there, if one decide to replace the damaged terminals (Keysight P/N 03458-62111).
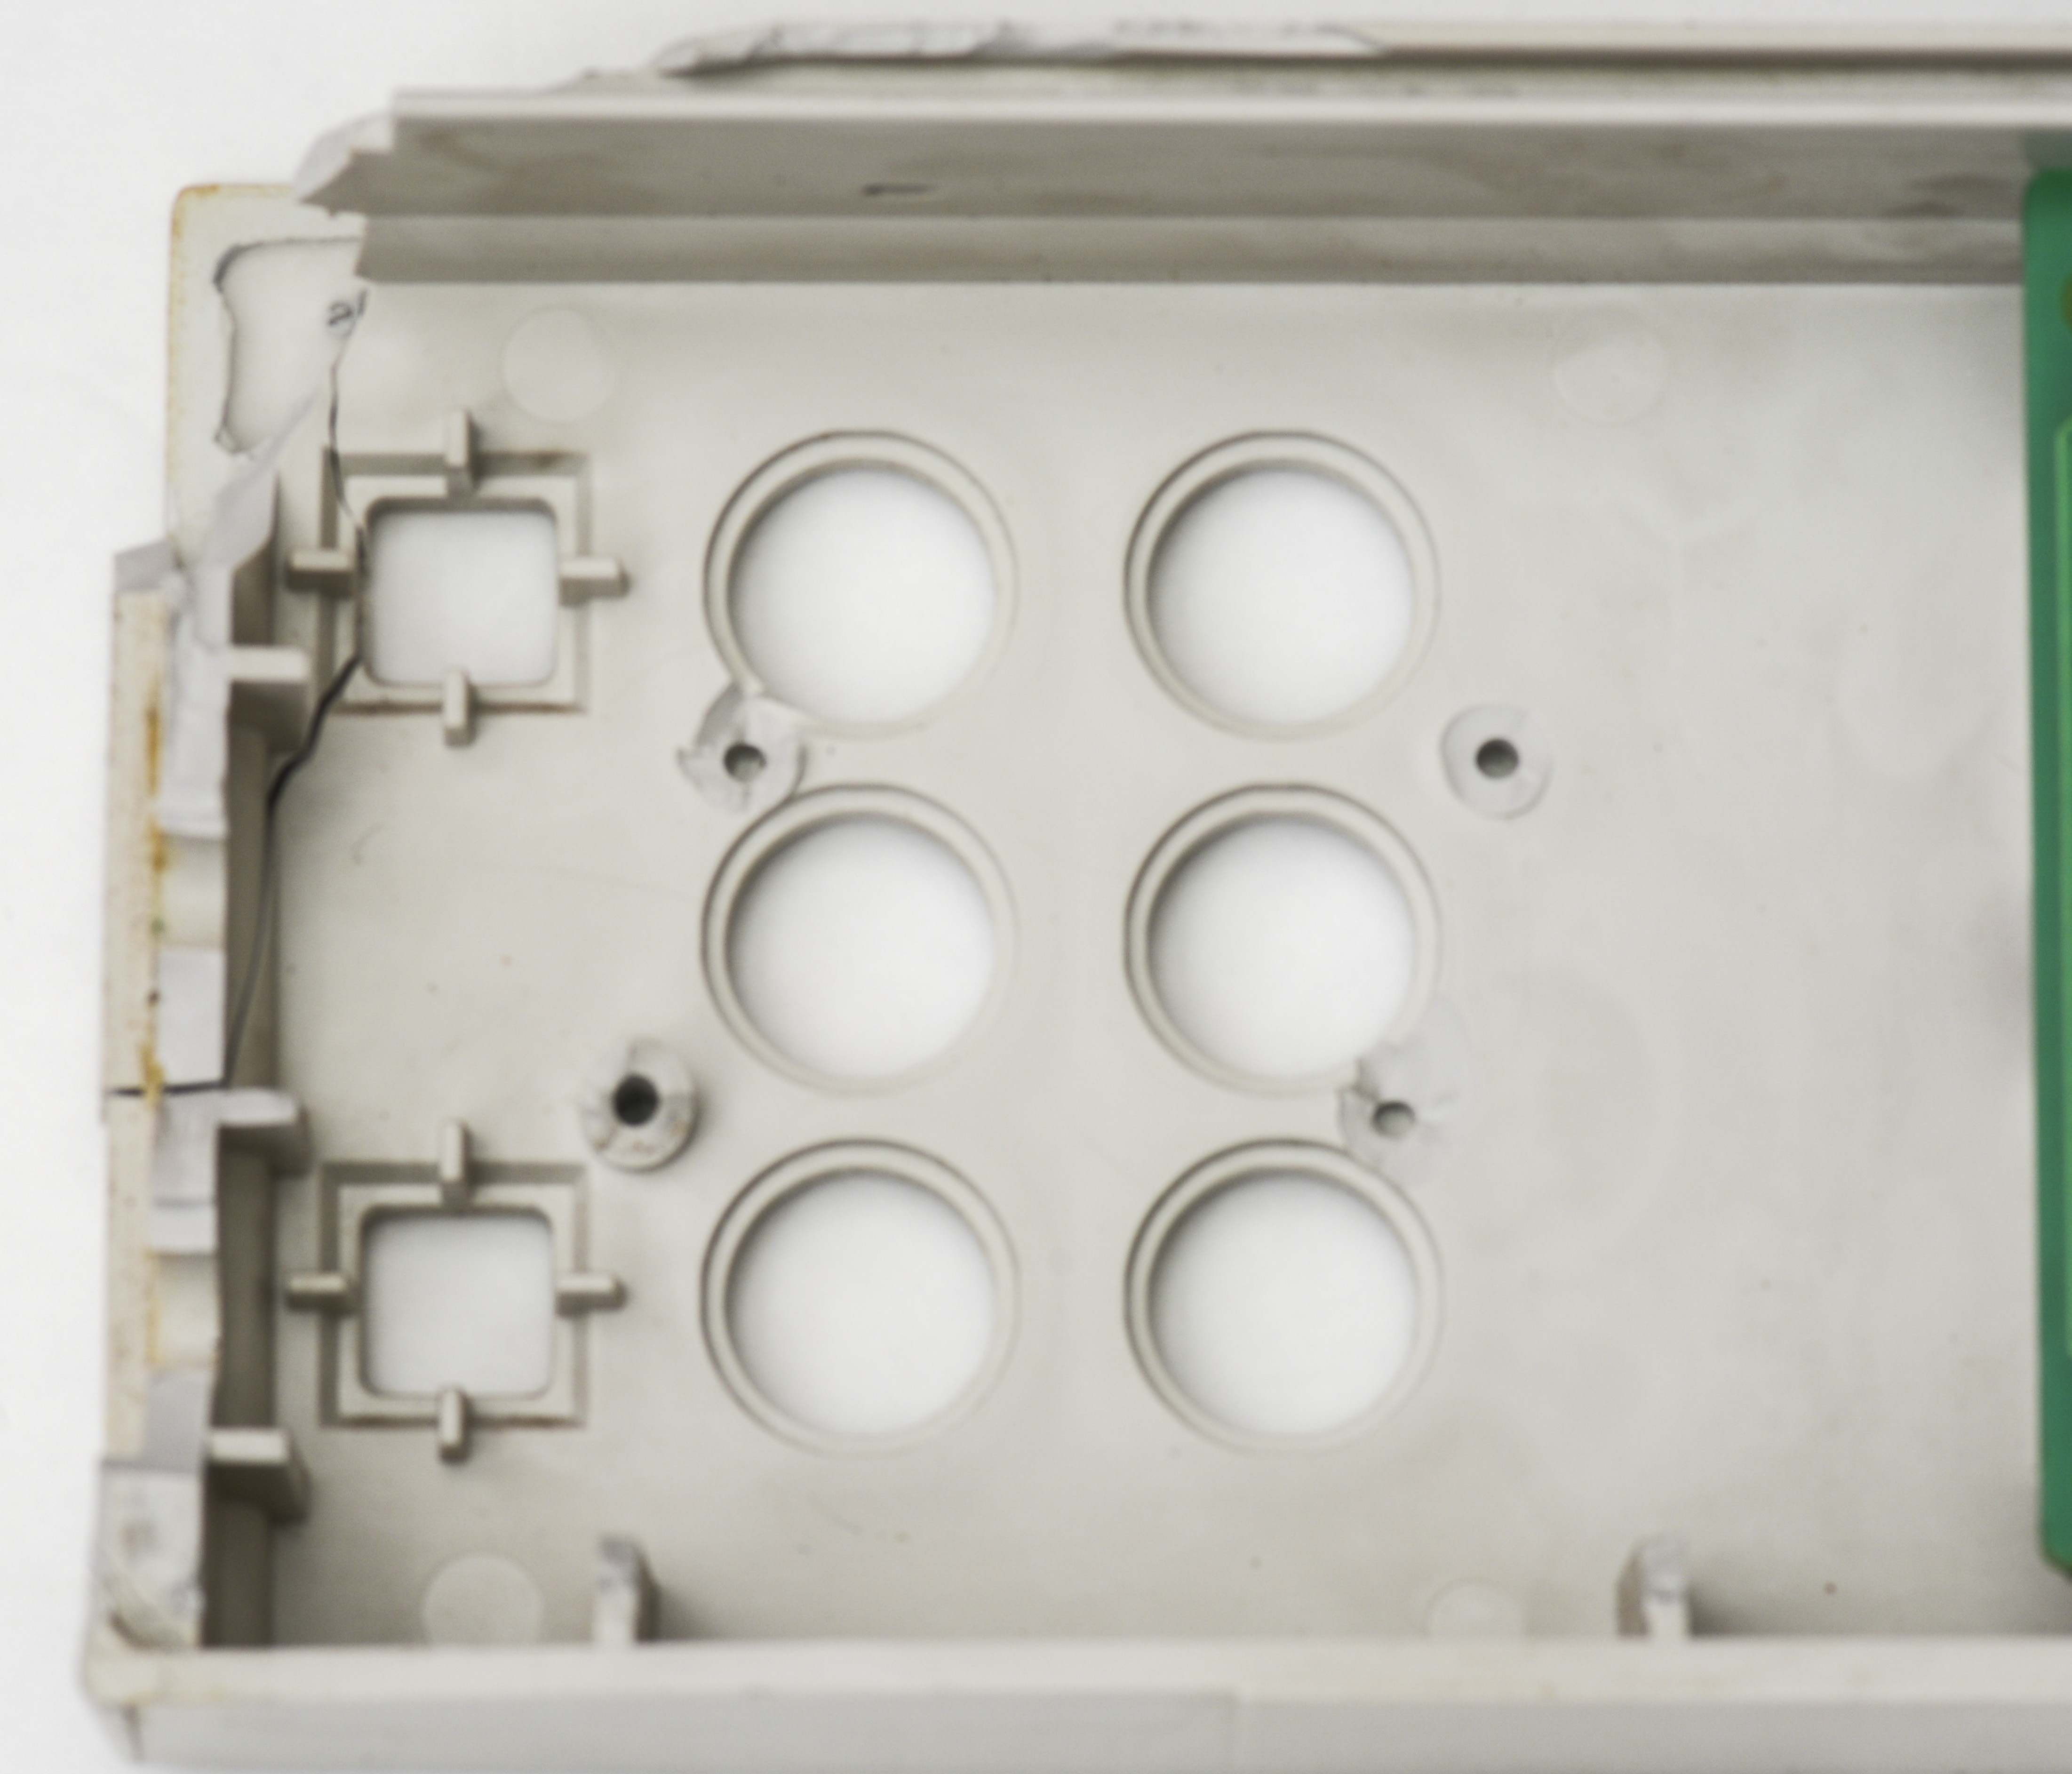
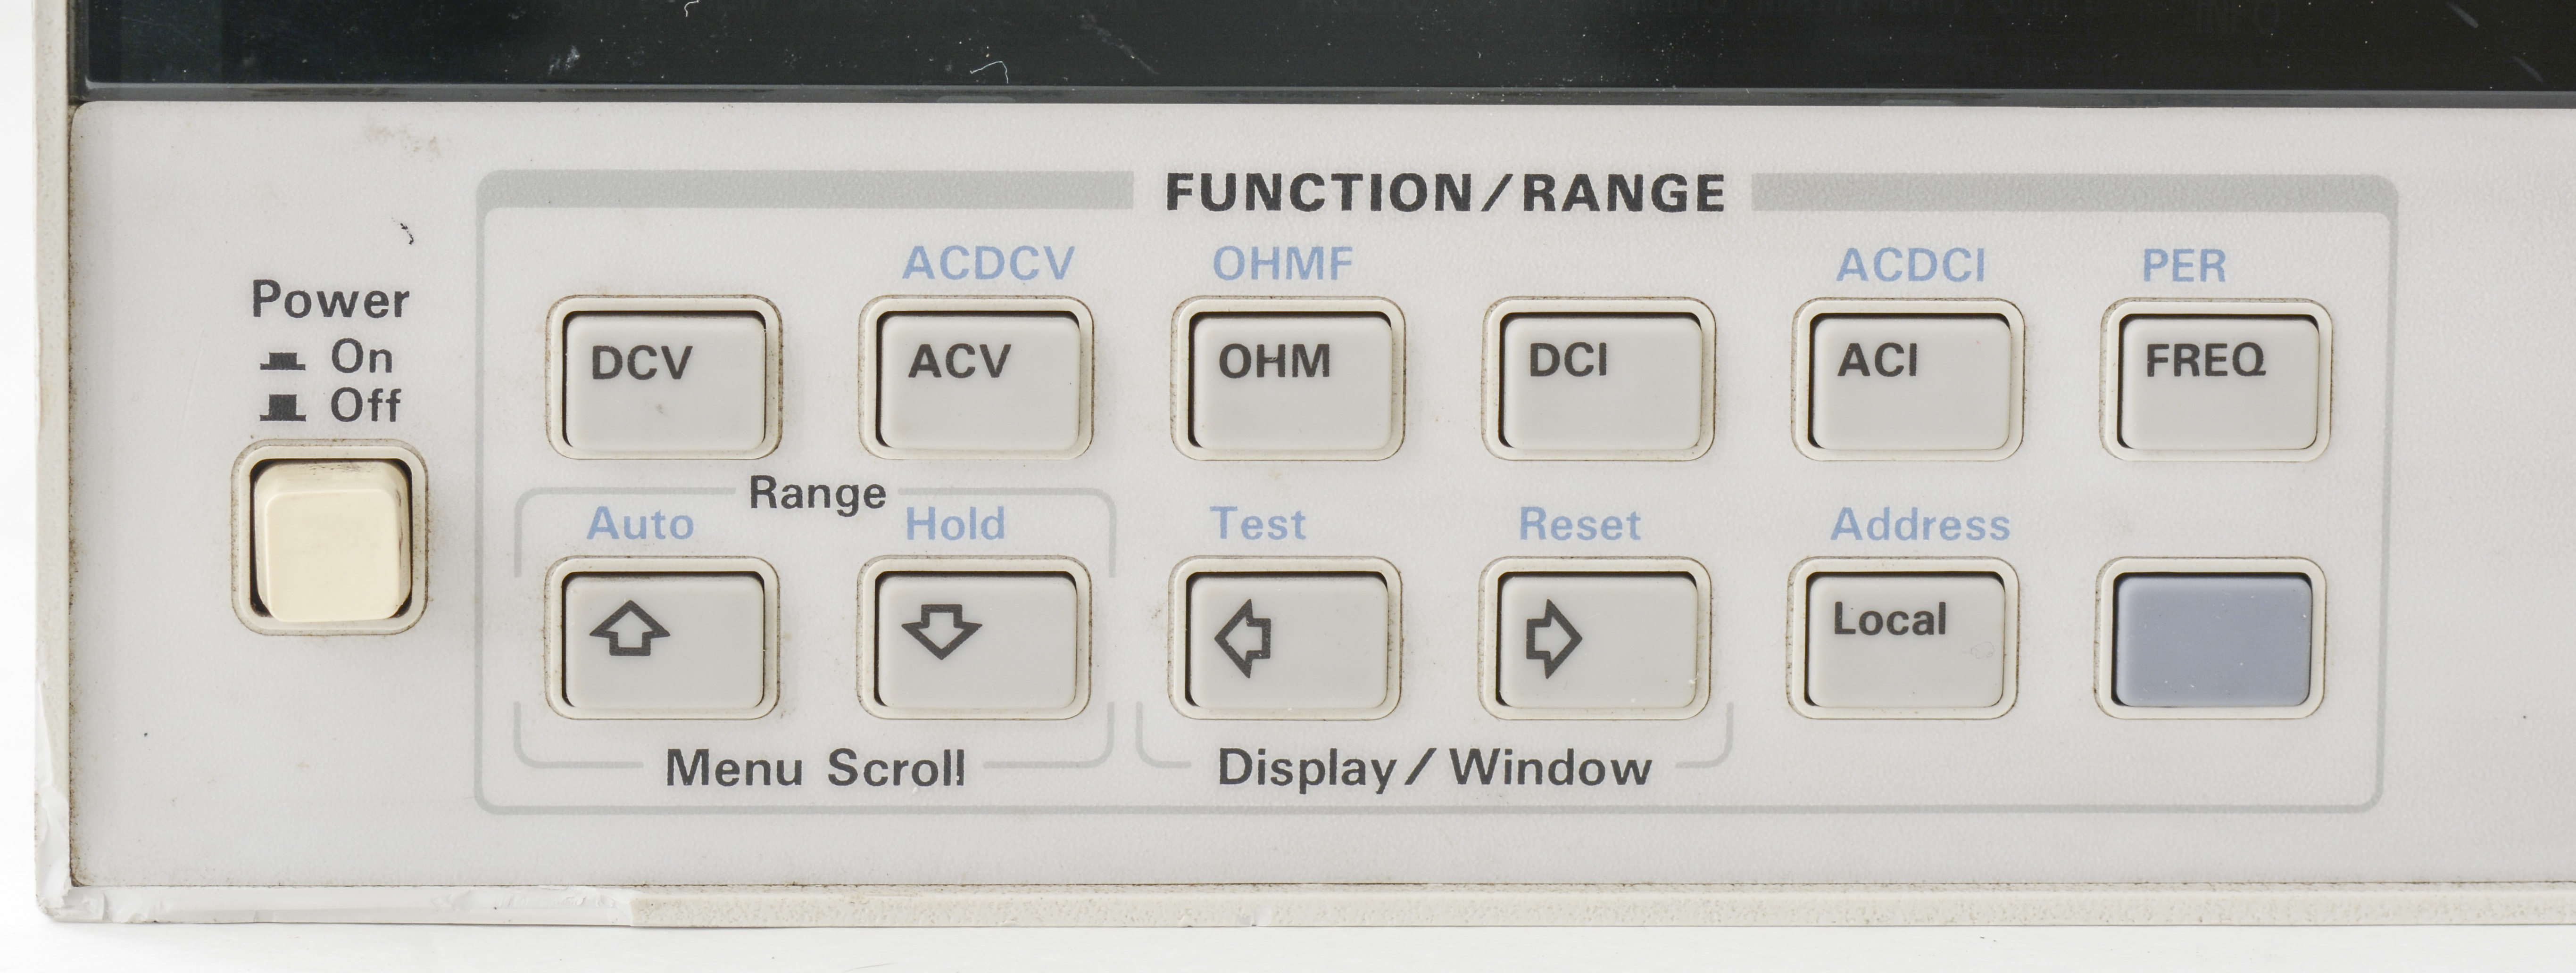
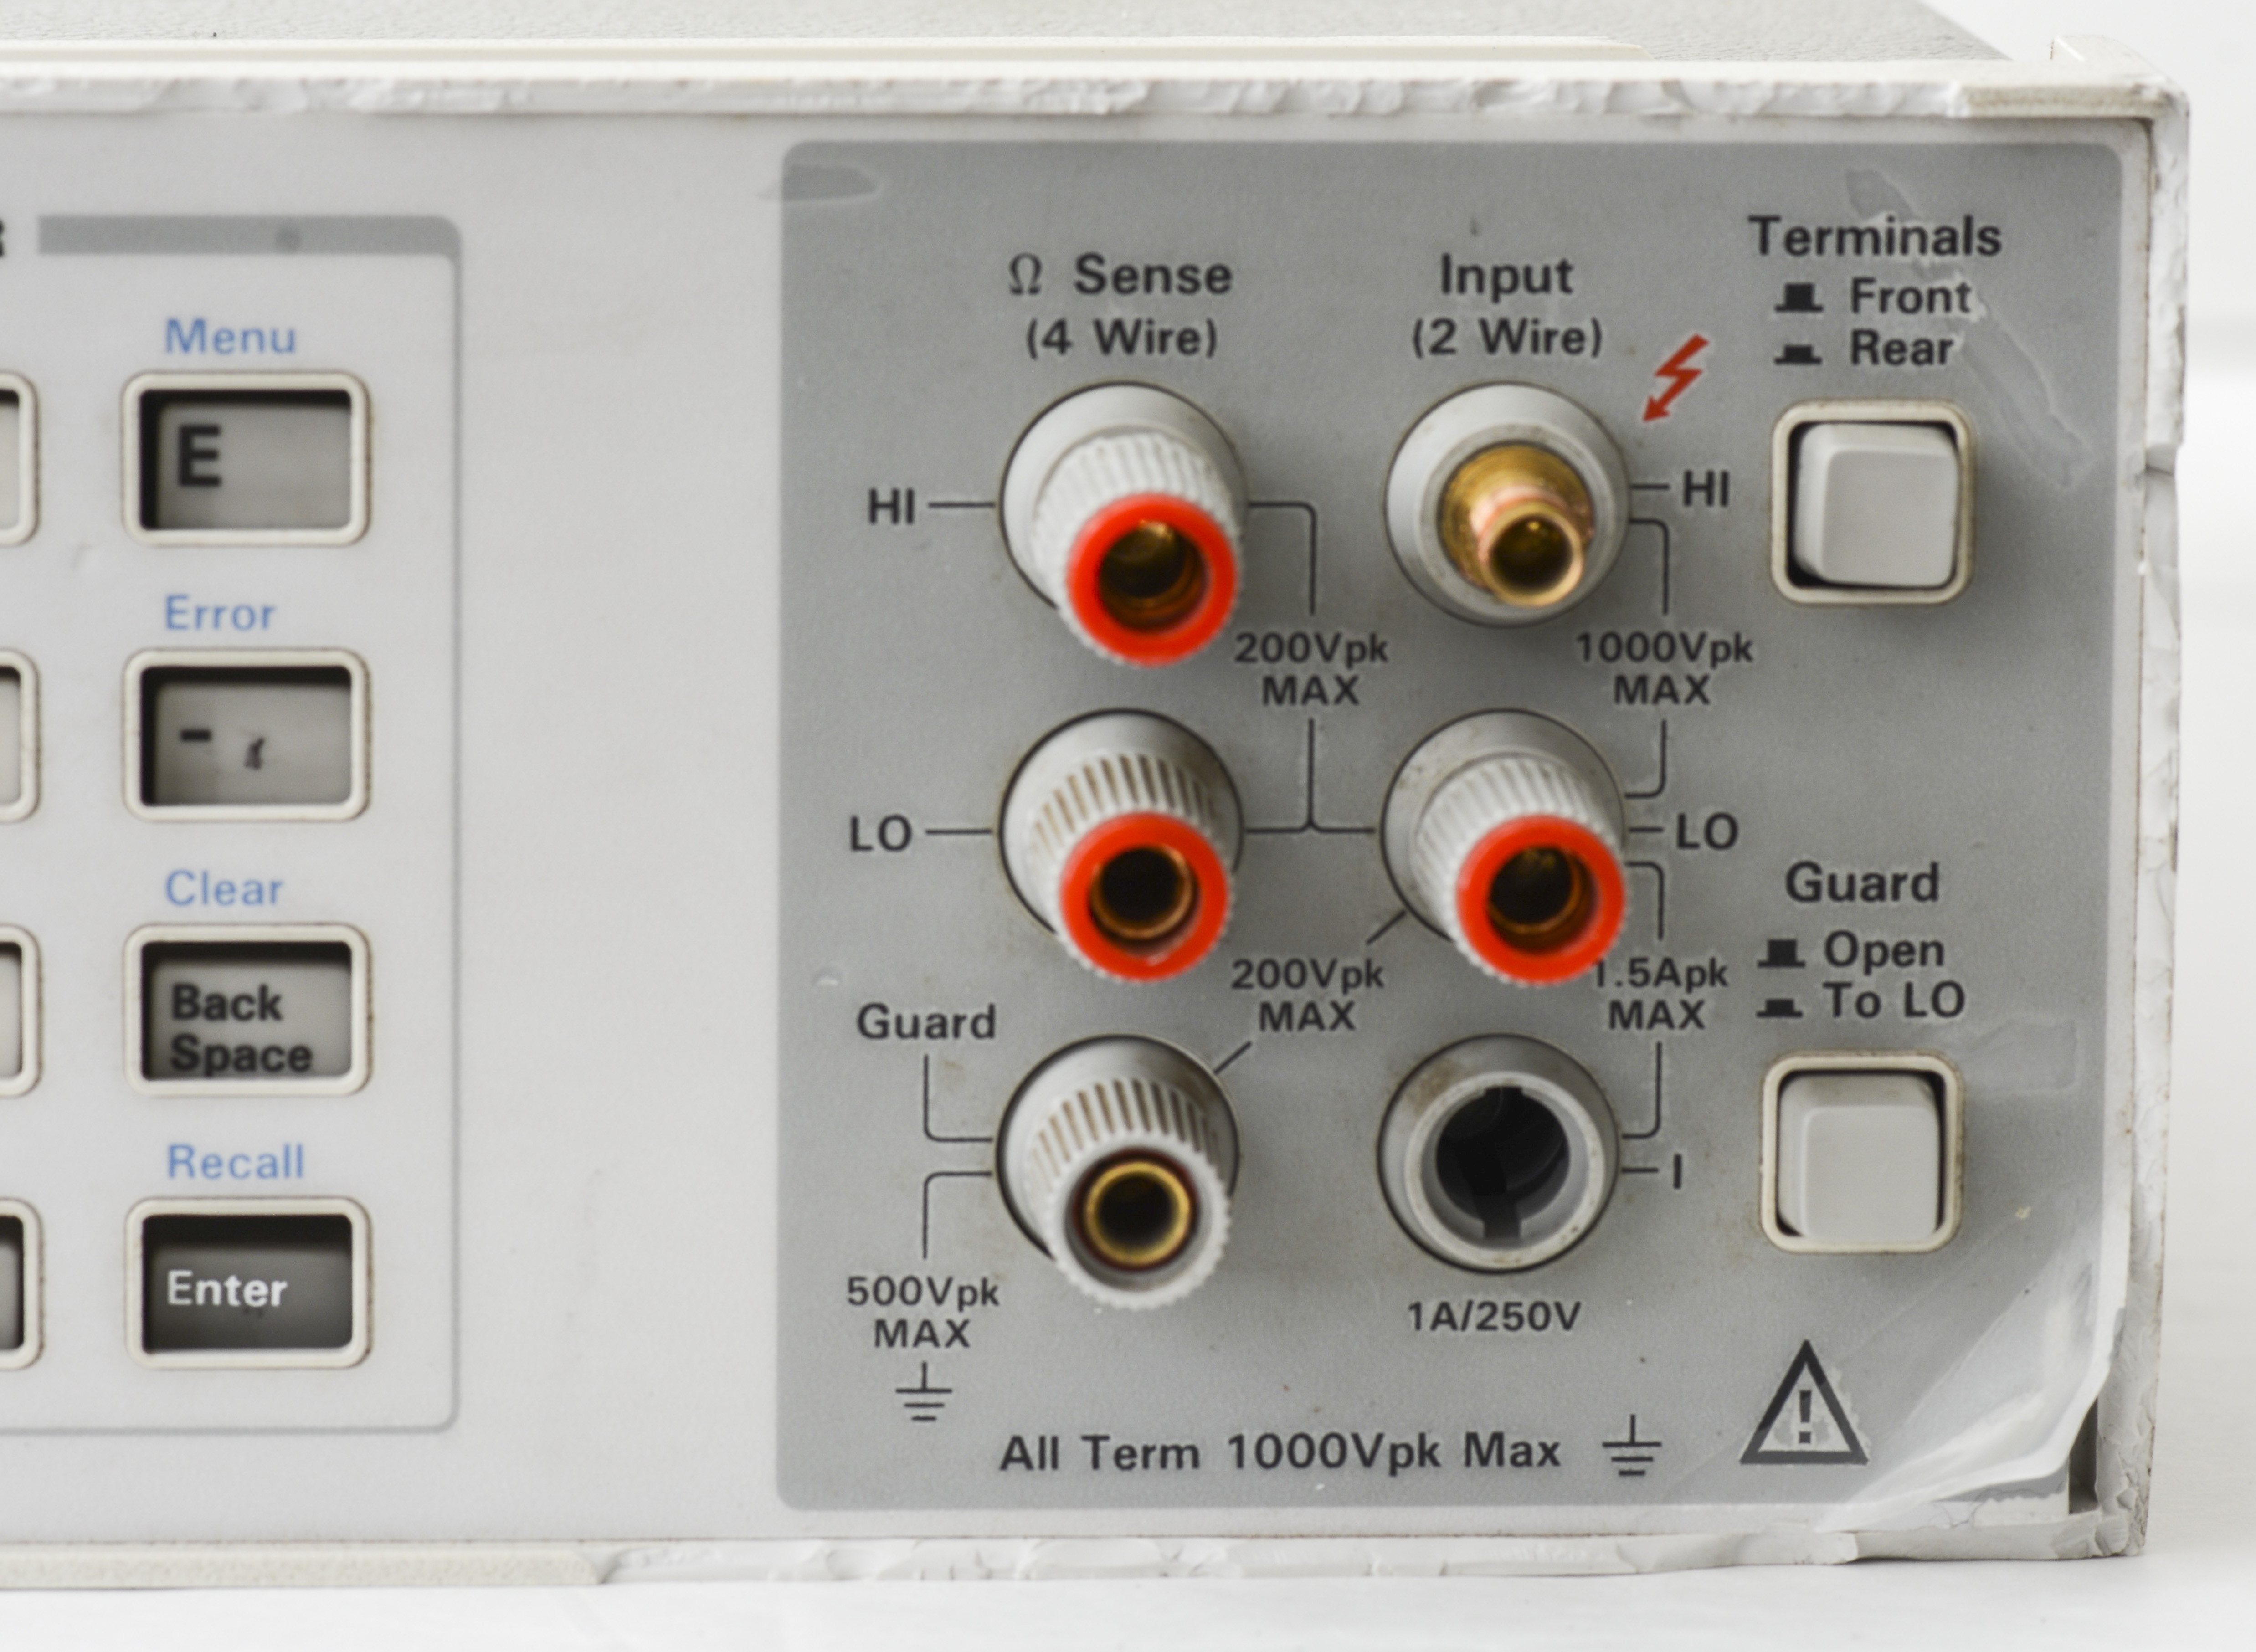
Image 3-5: Front panel damage
Rear terminals are OK, and they are exactly same part as one used in front. So I will move terminal block from rear to front, and use another solution on the rear side. More details to come later in the article about this.
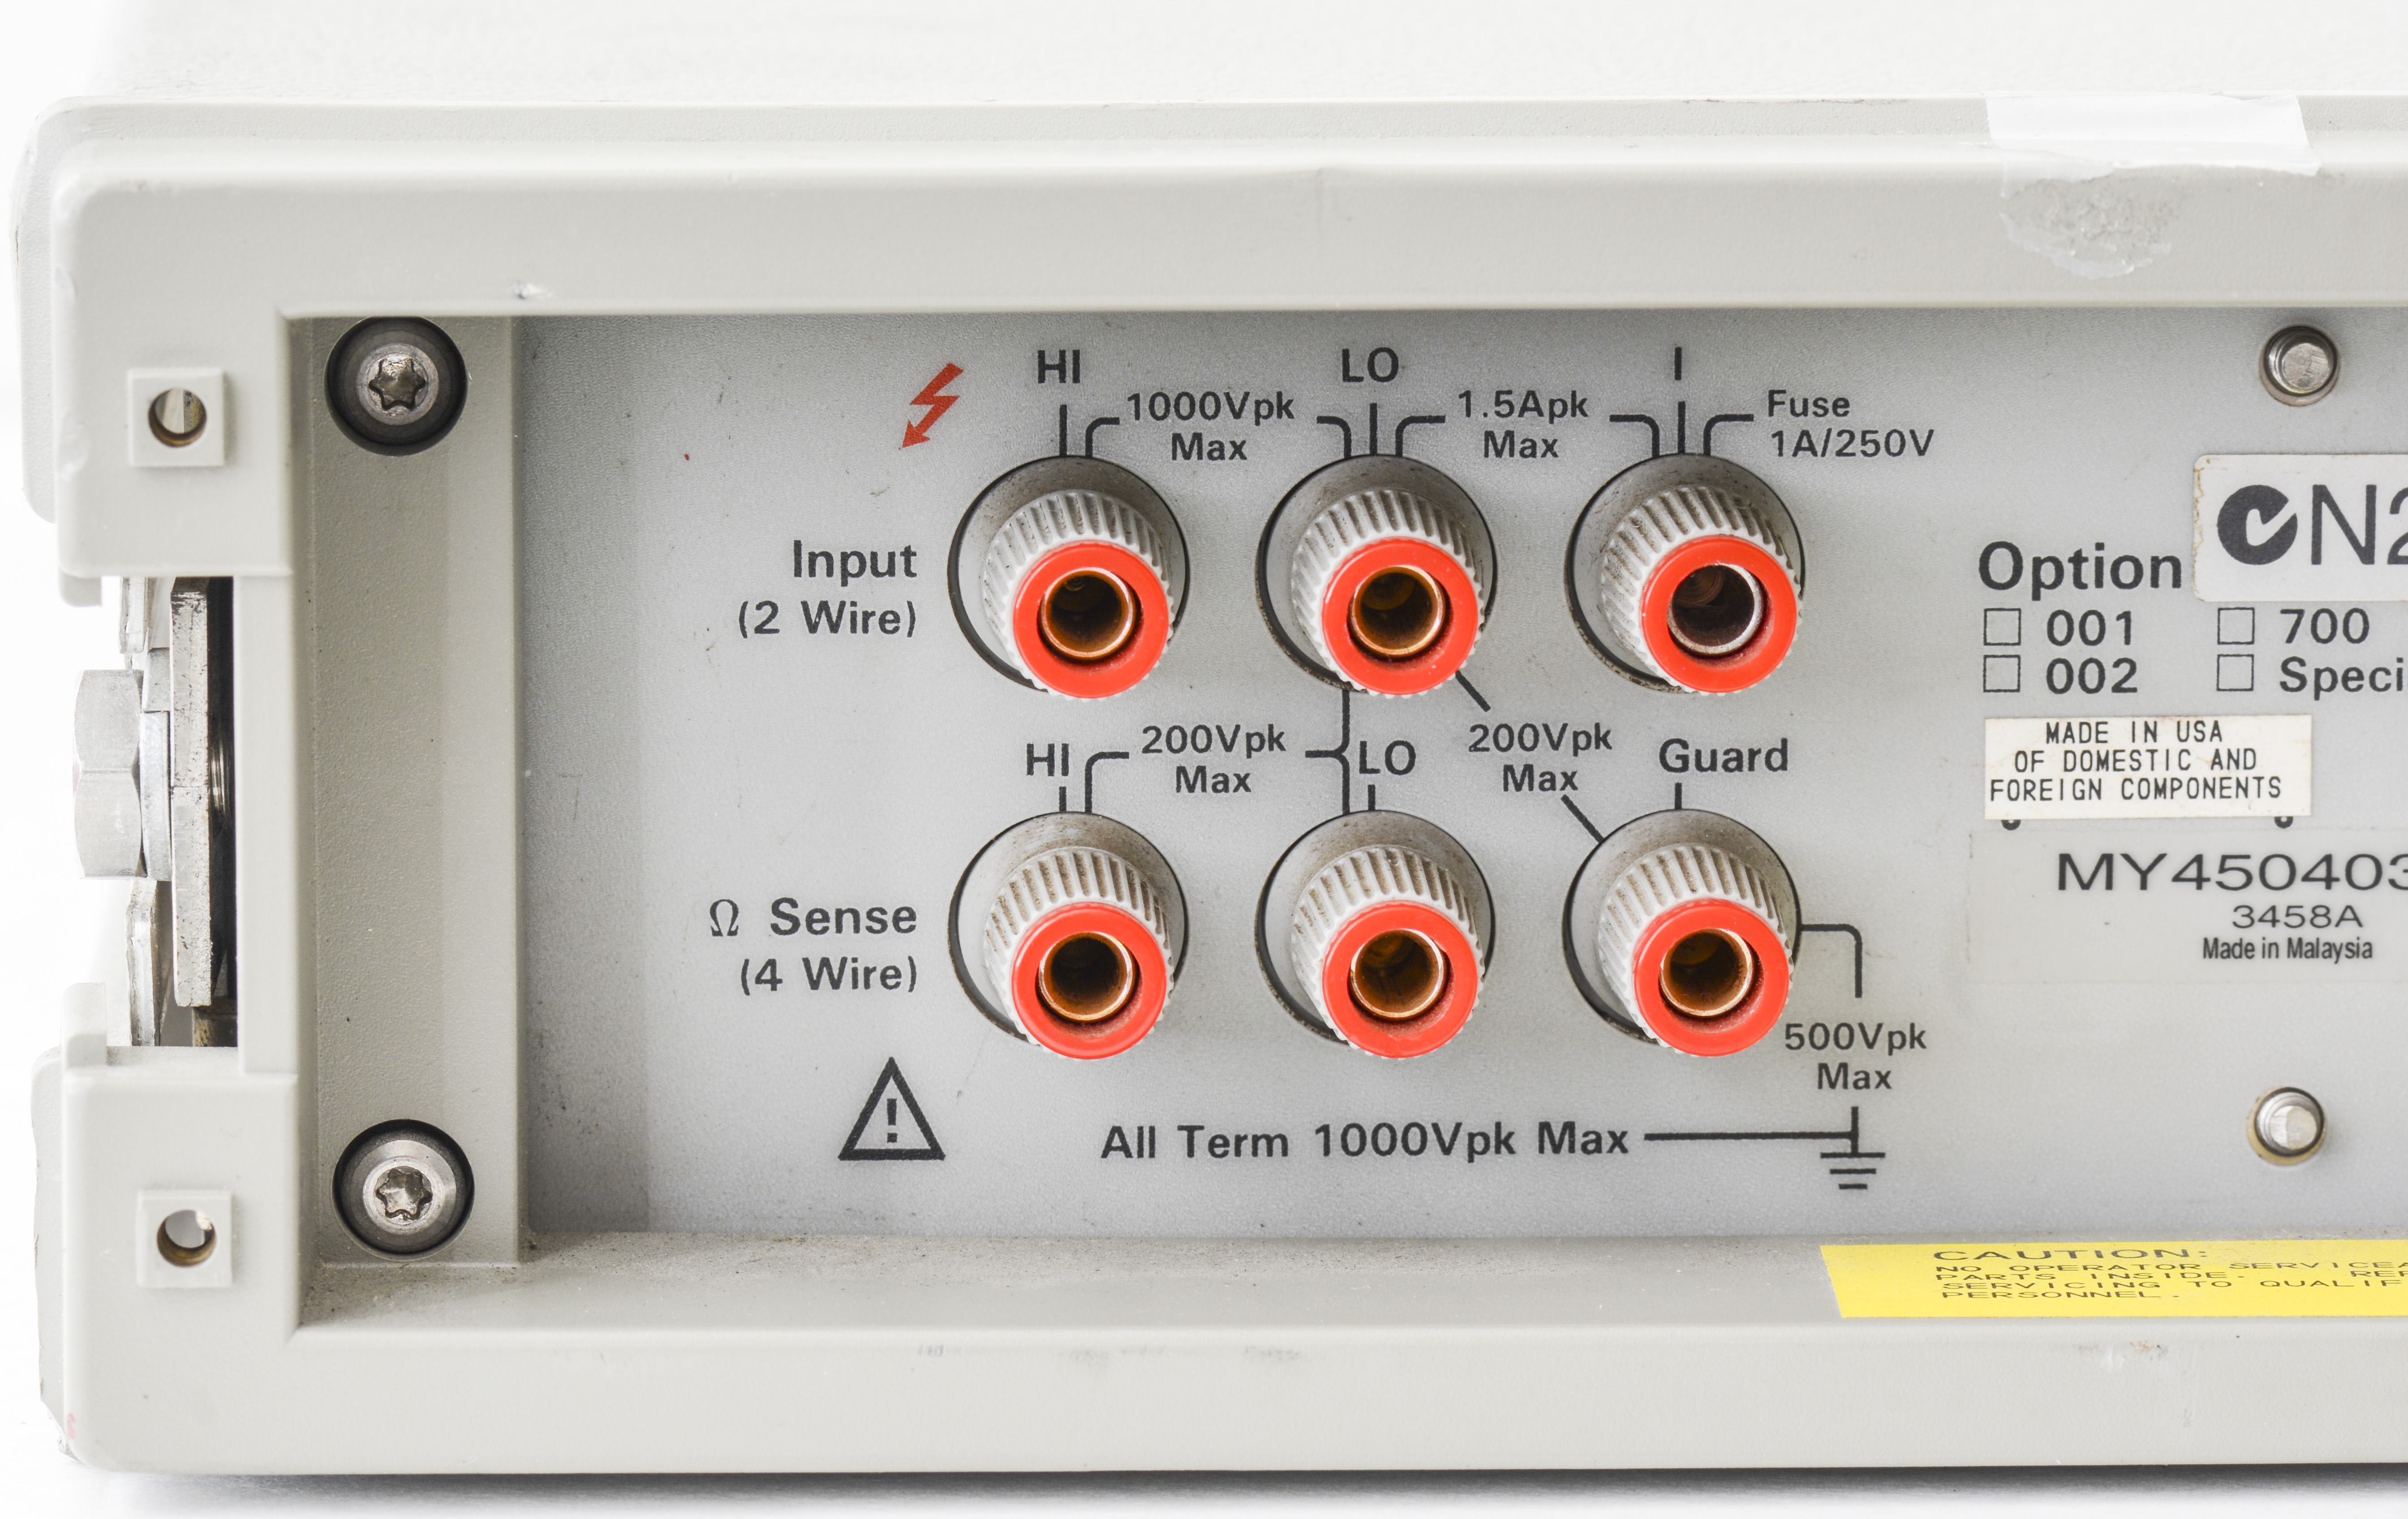

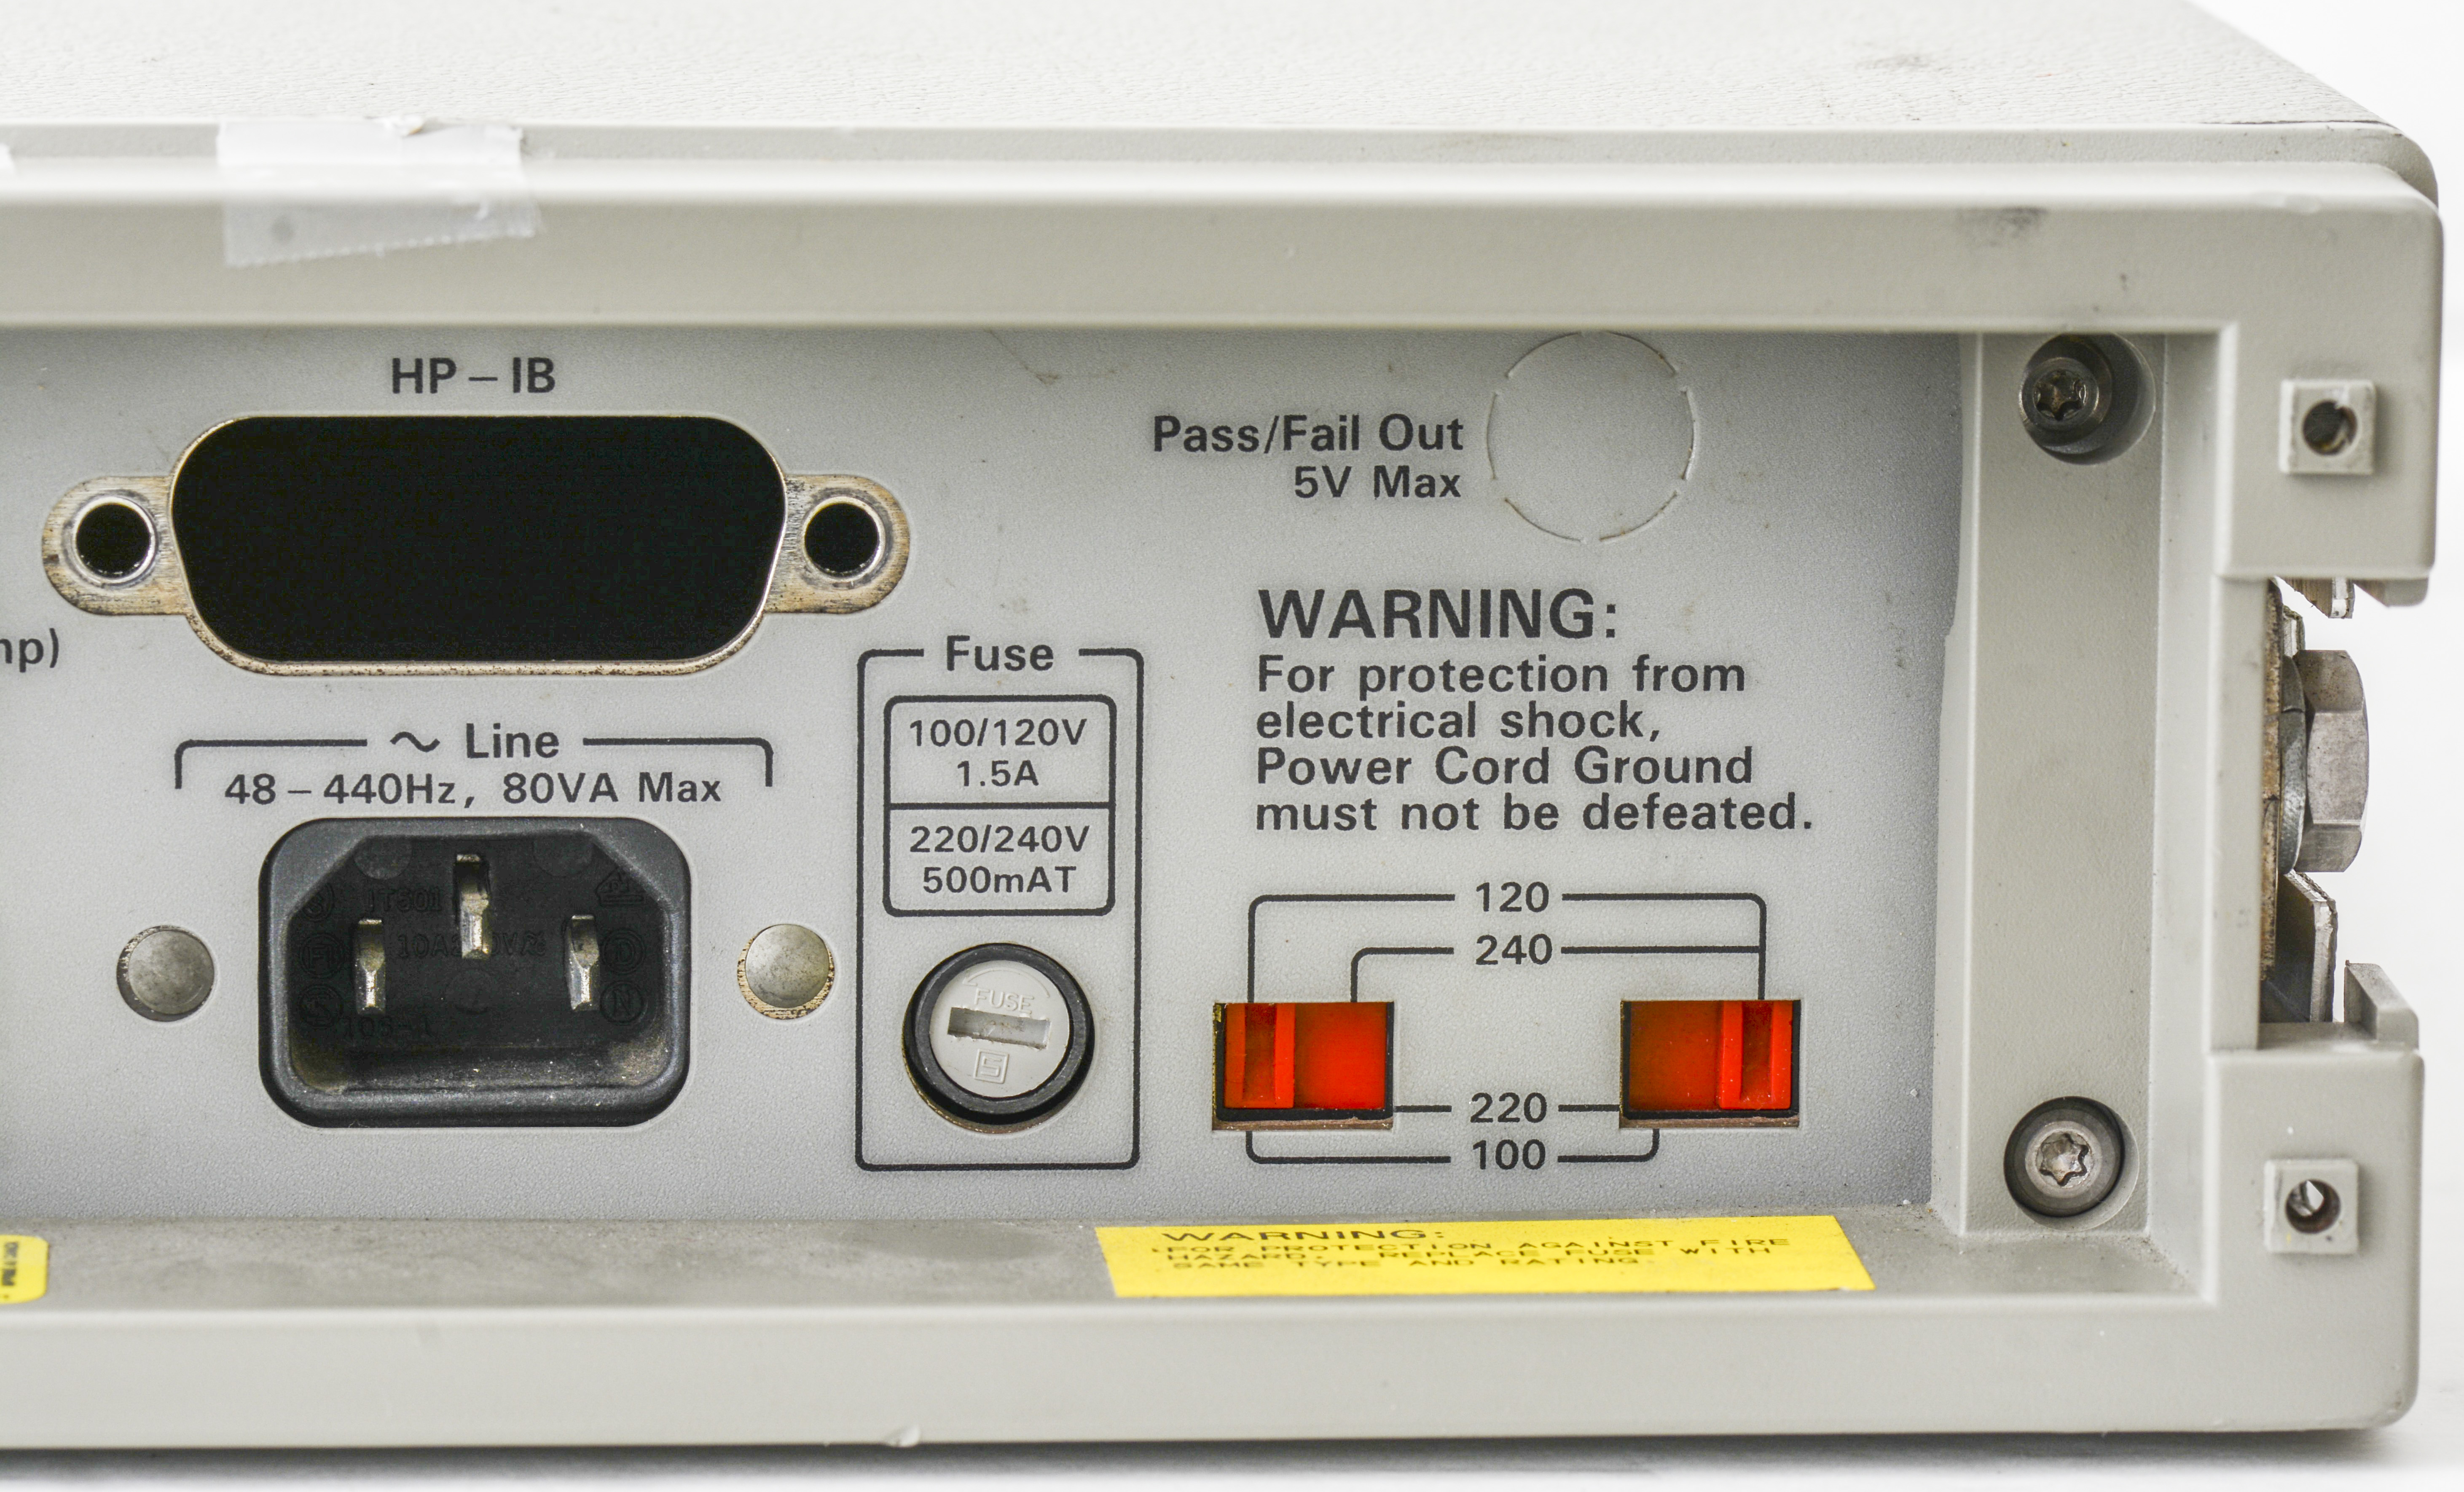
Image 6-8: Rear side
Key rubber pads are not held in place correctly, perhaps due to front panel plastic damage?
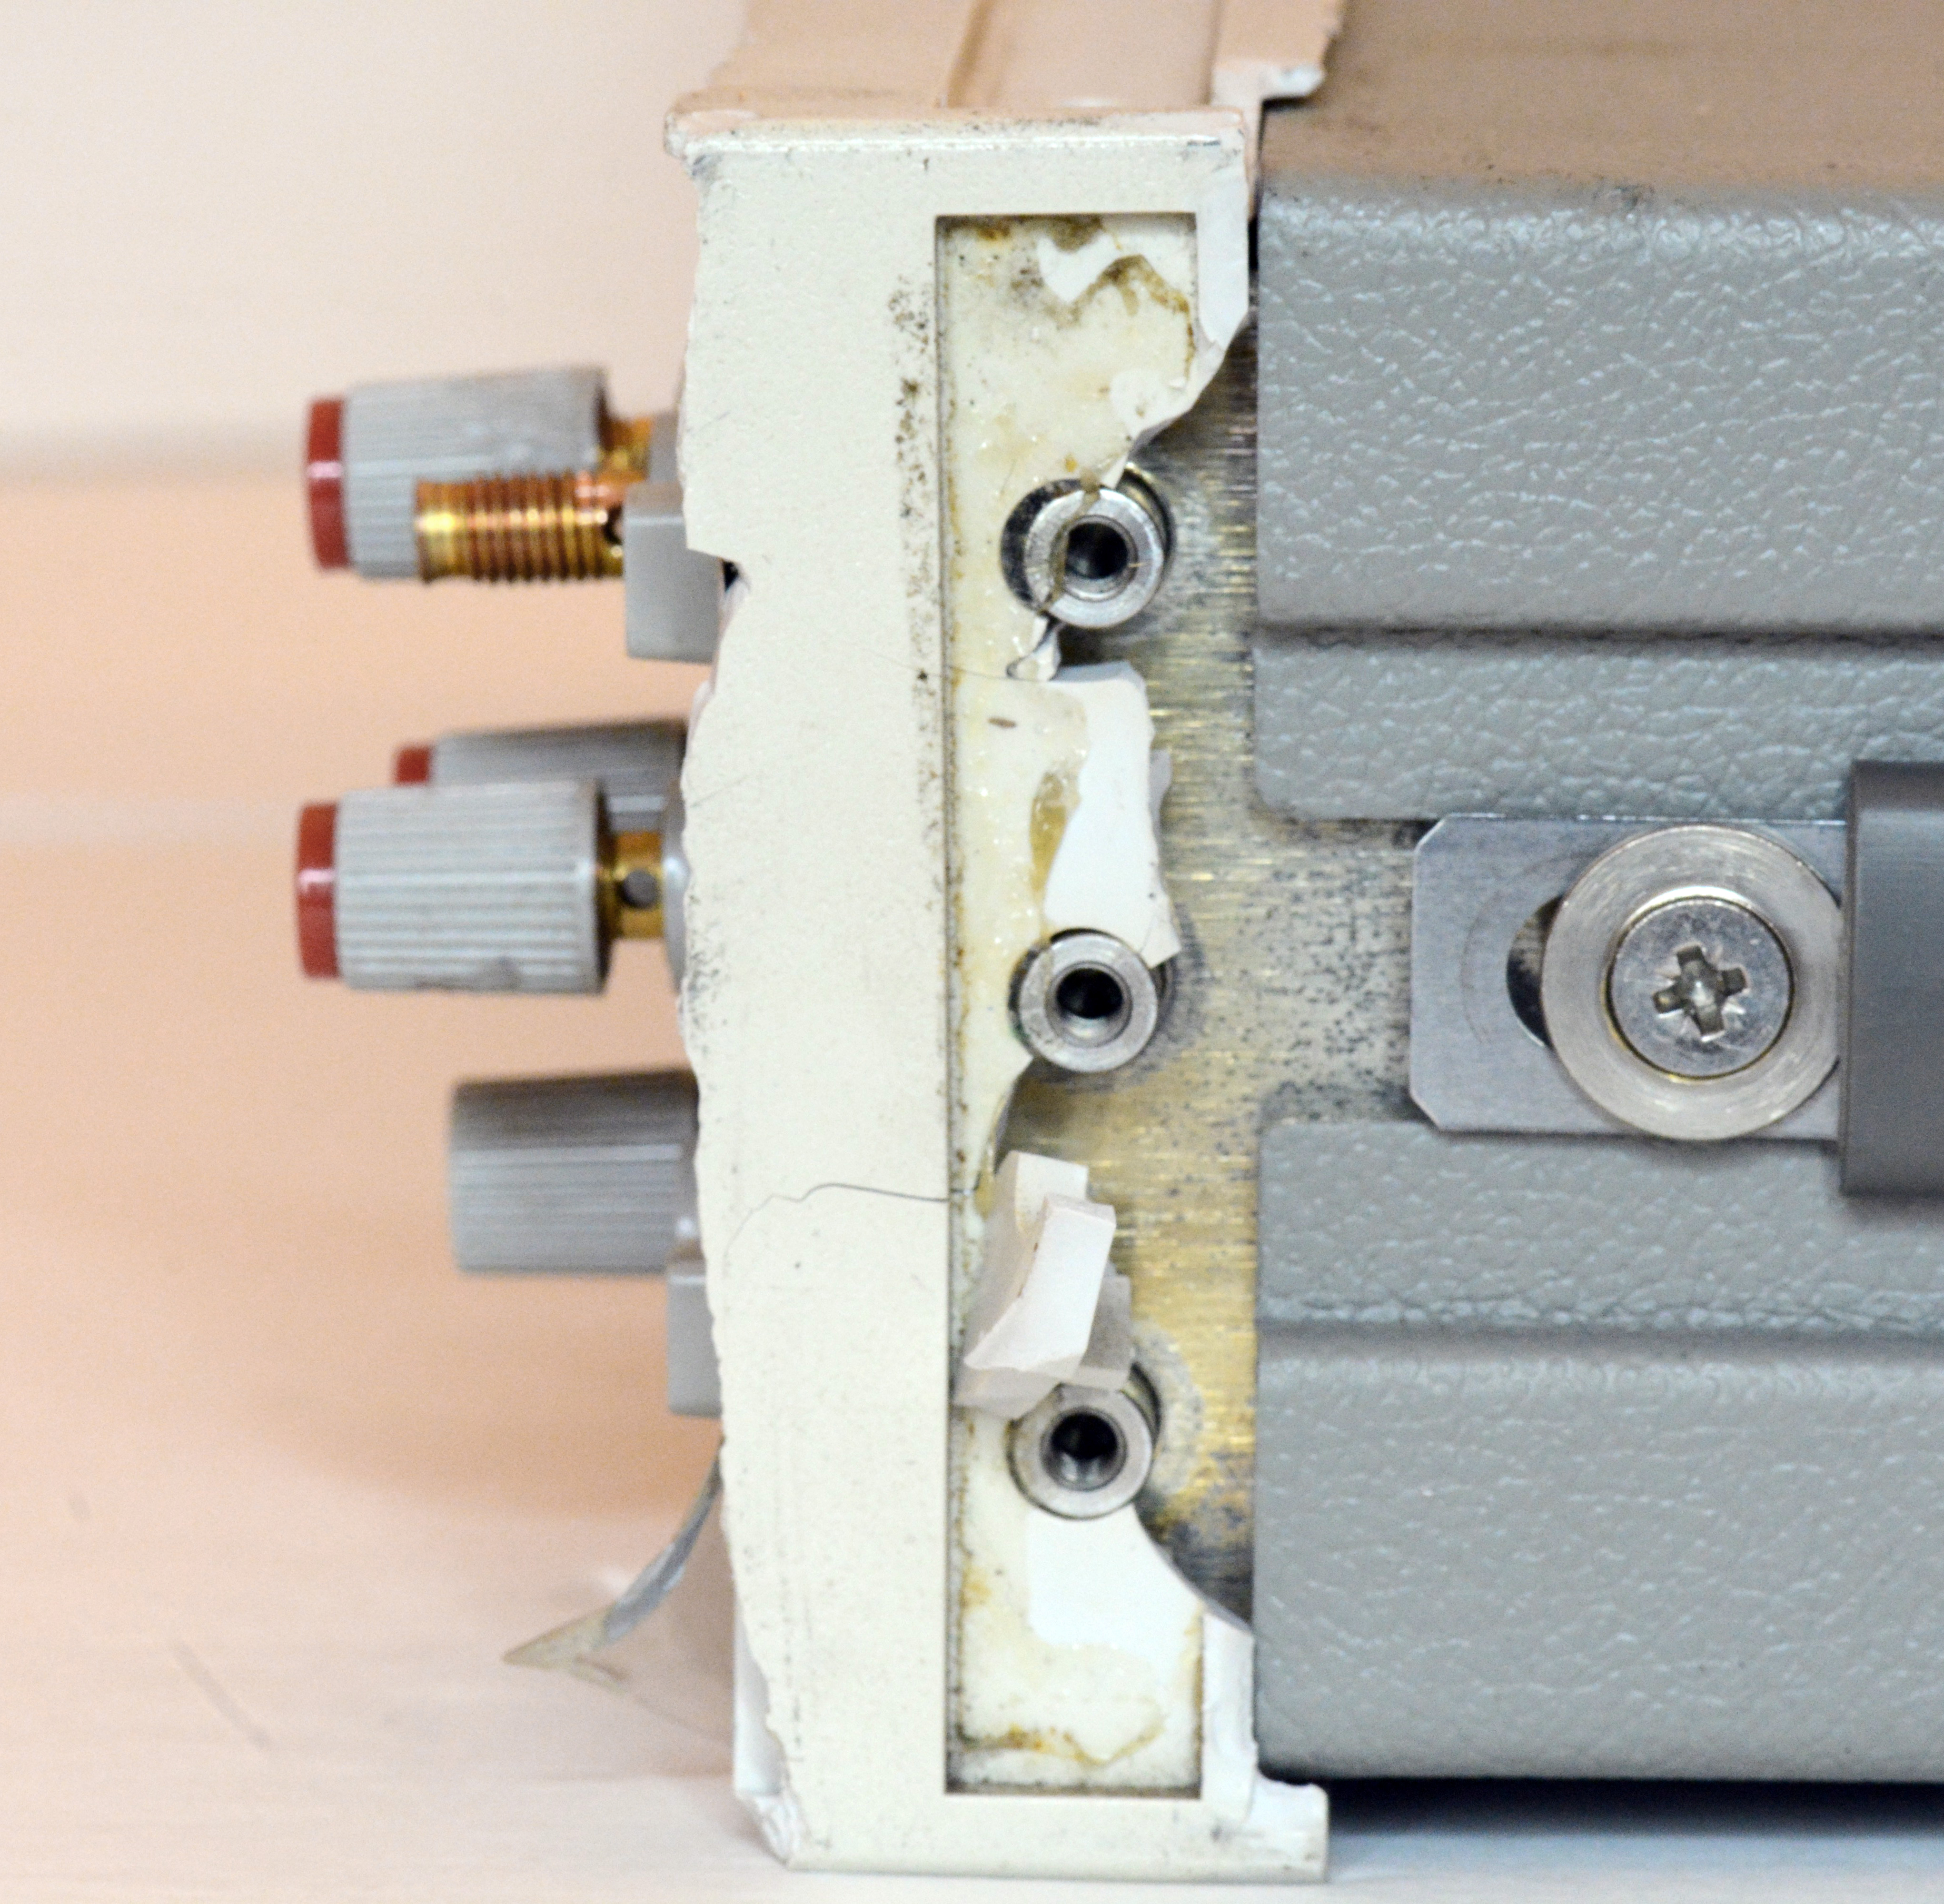
Image 9-10: More damaged parts
FP PCBA is there at least, we can see a VFD glass thru the scratched front panel window.
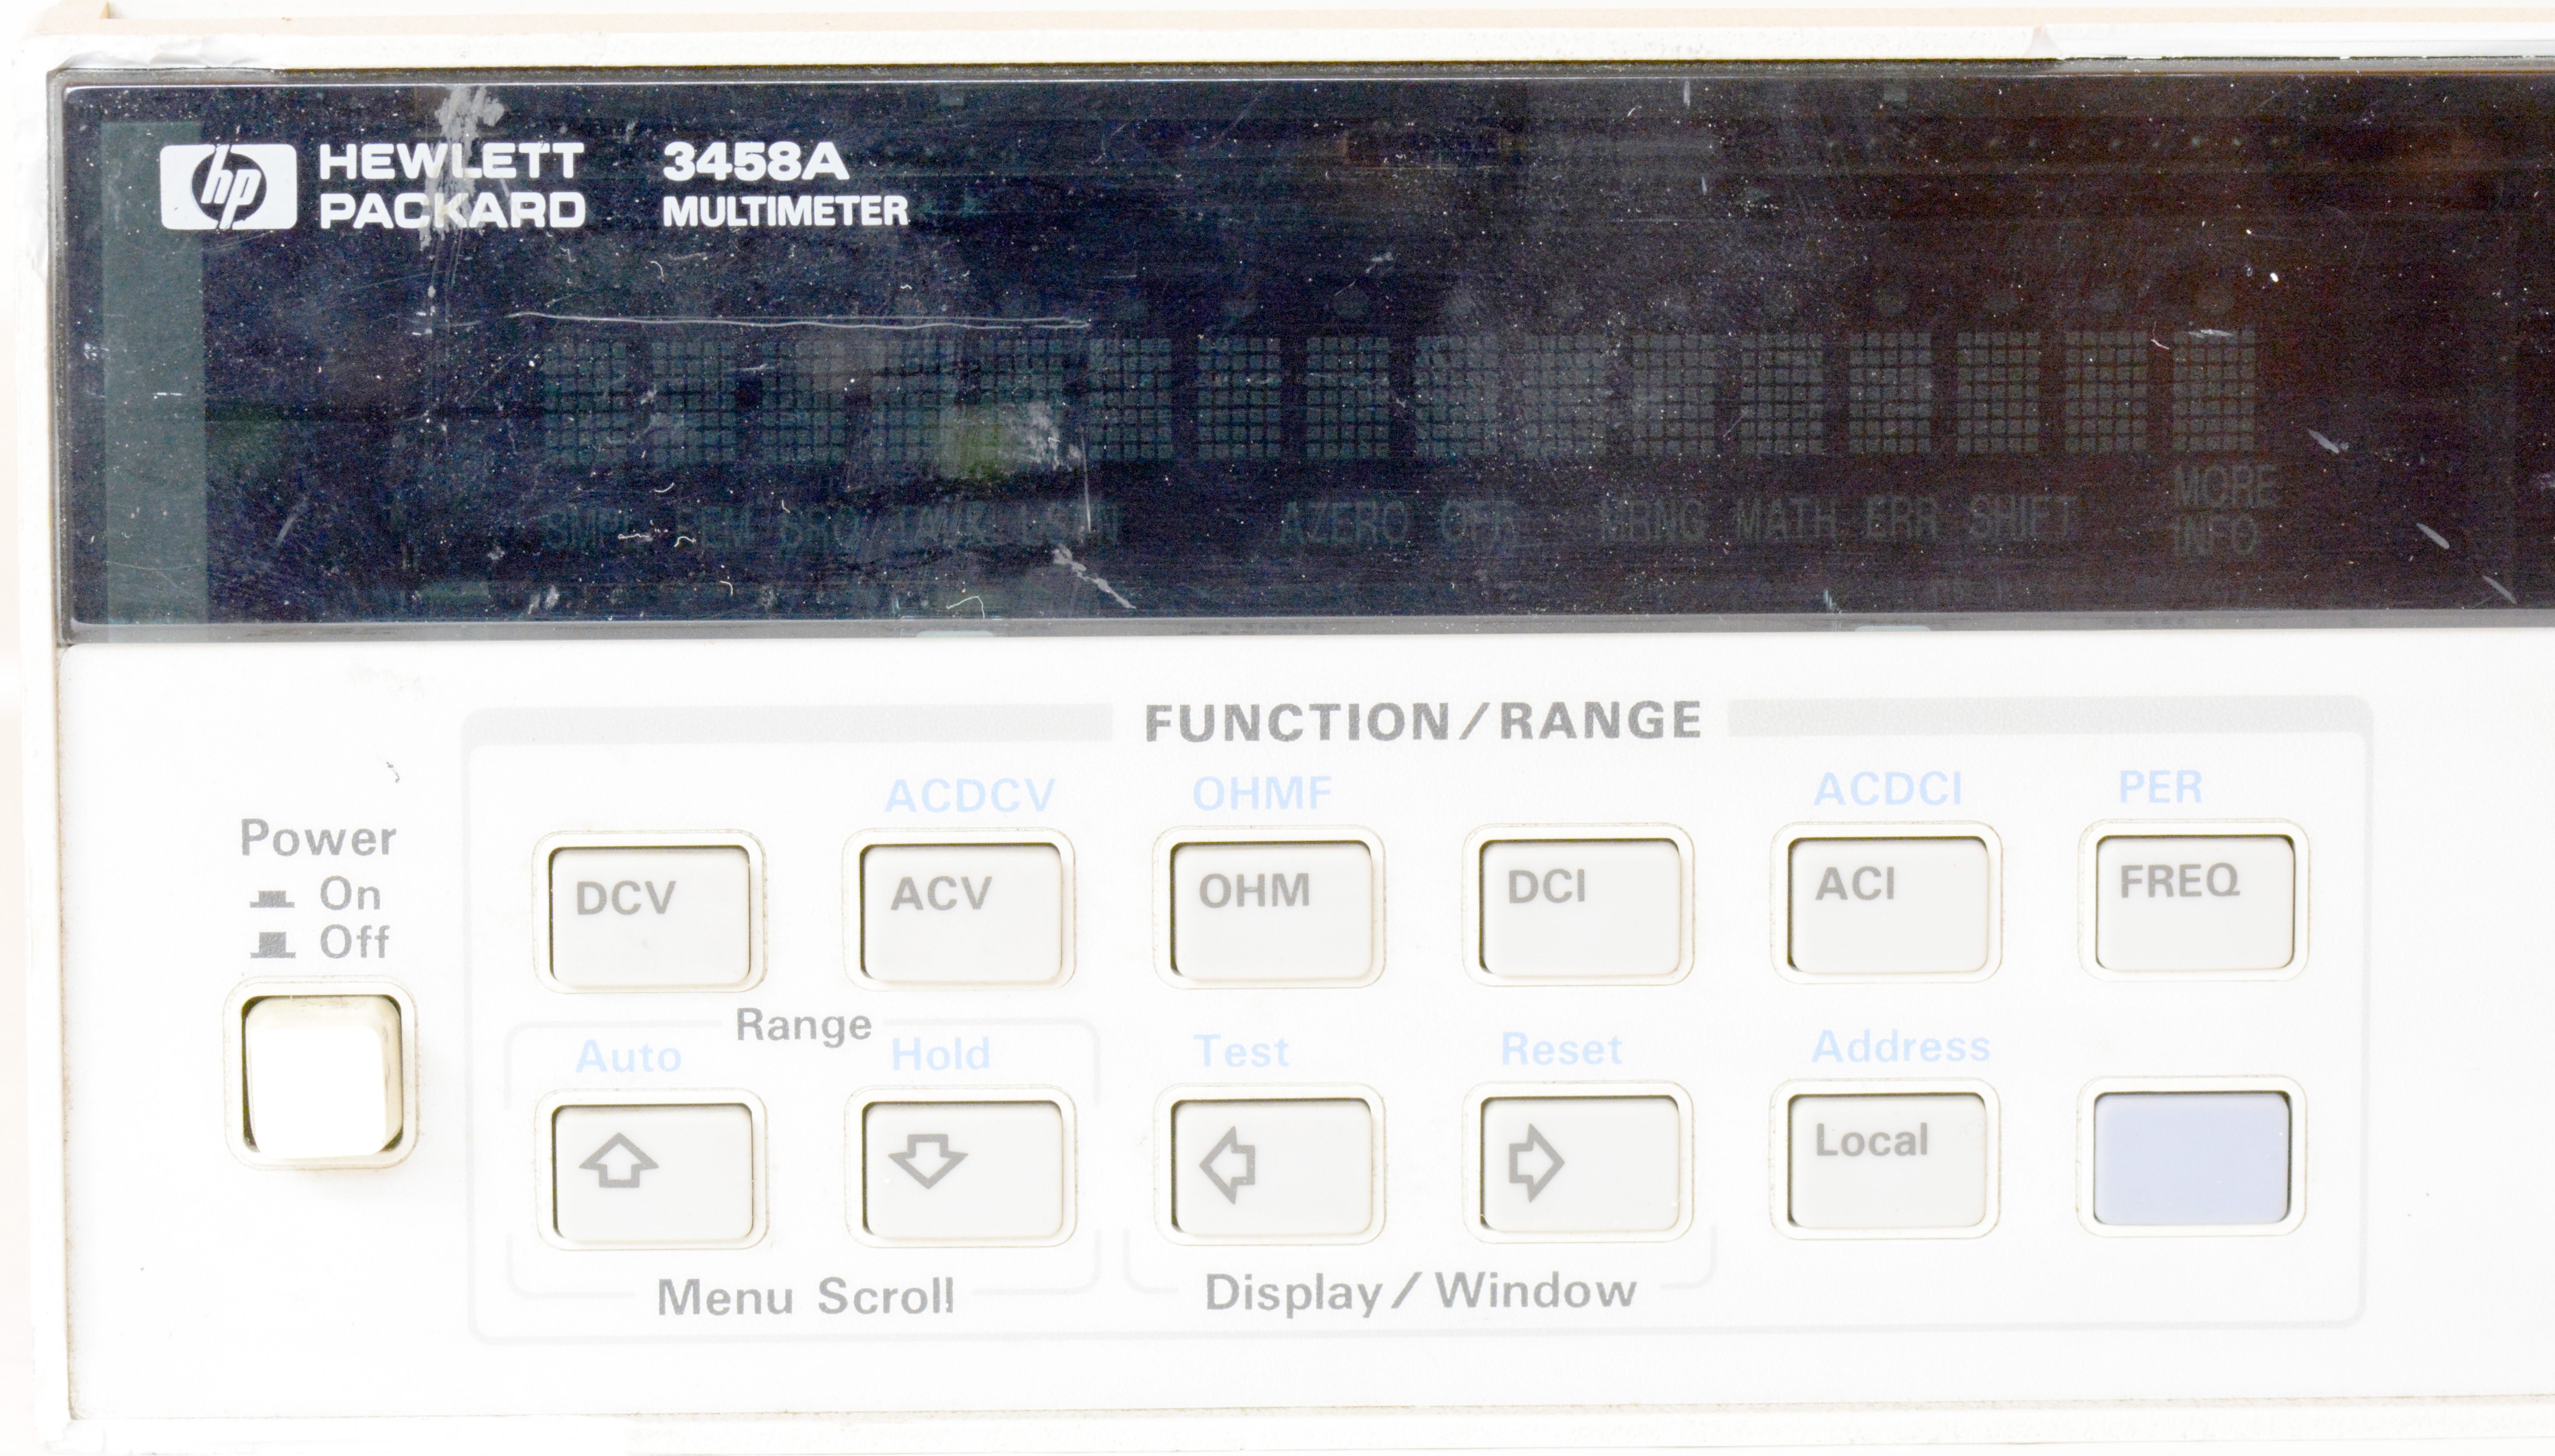
Image 11: Front panel VFD lens
Panel plastic is definately going to be replaced. During disassembly it was literally falling apart.
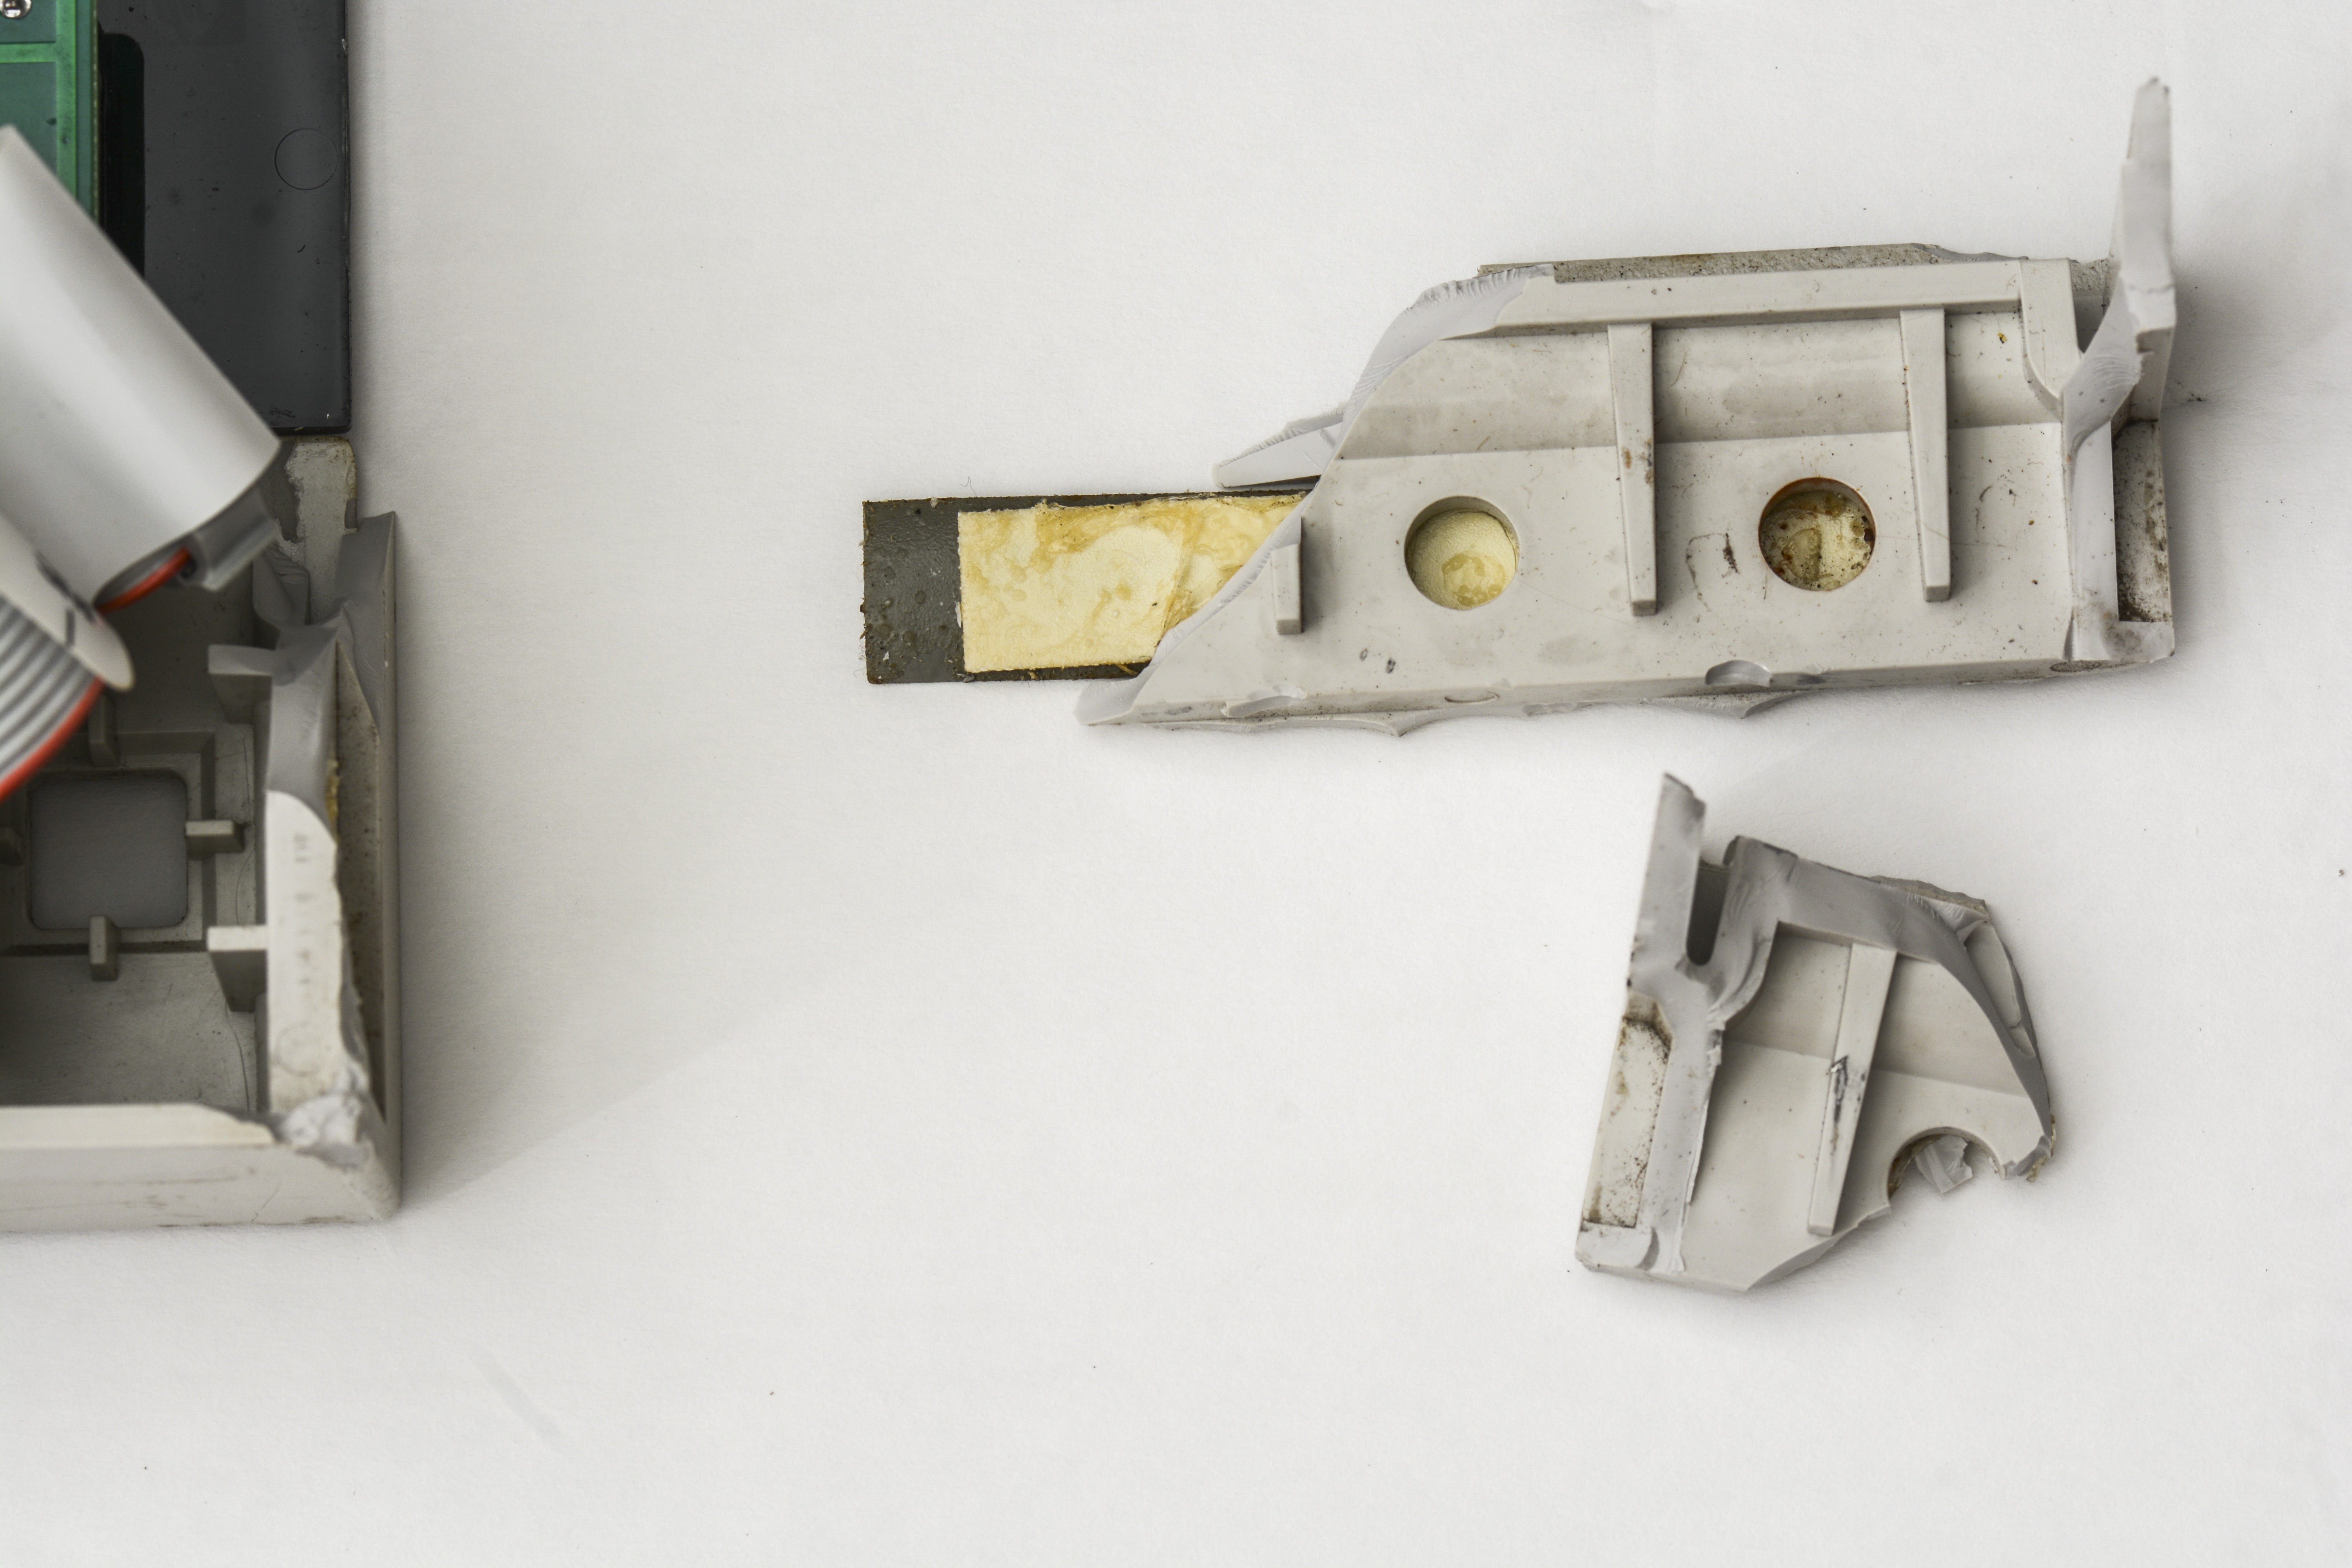
Image 12: Front panel pieces
And now it’s clear why rubber keypads were not in place. Every single FP PCBA locking notch is broken. That is the result of front face impact. Perhaps someone dropped unit on its front face? I’m afraid fragile VFD glass is broken.
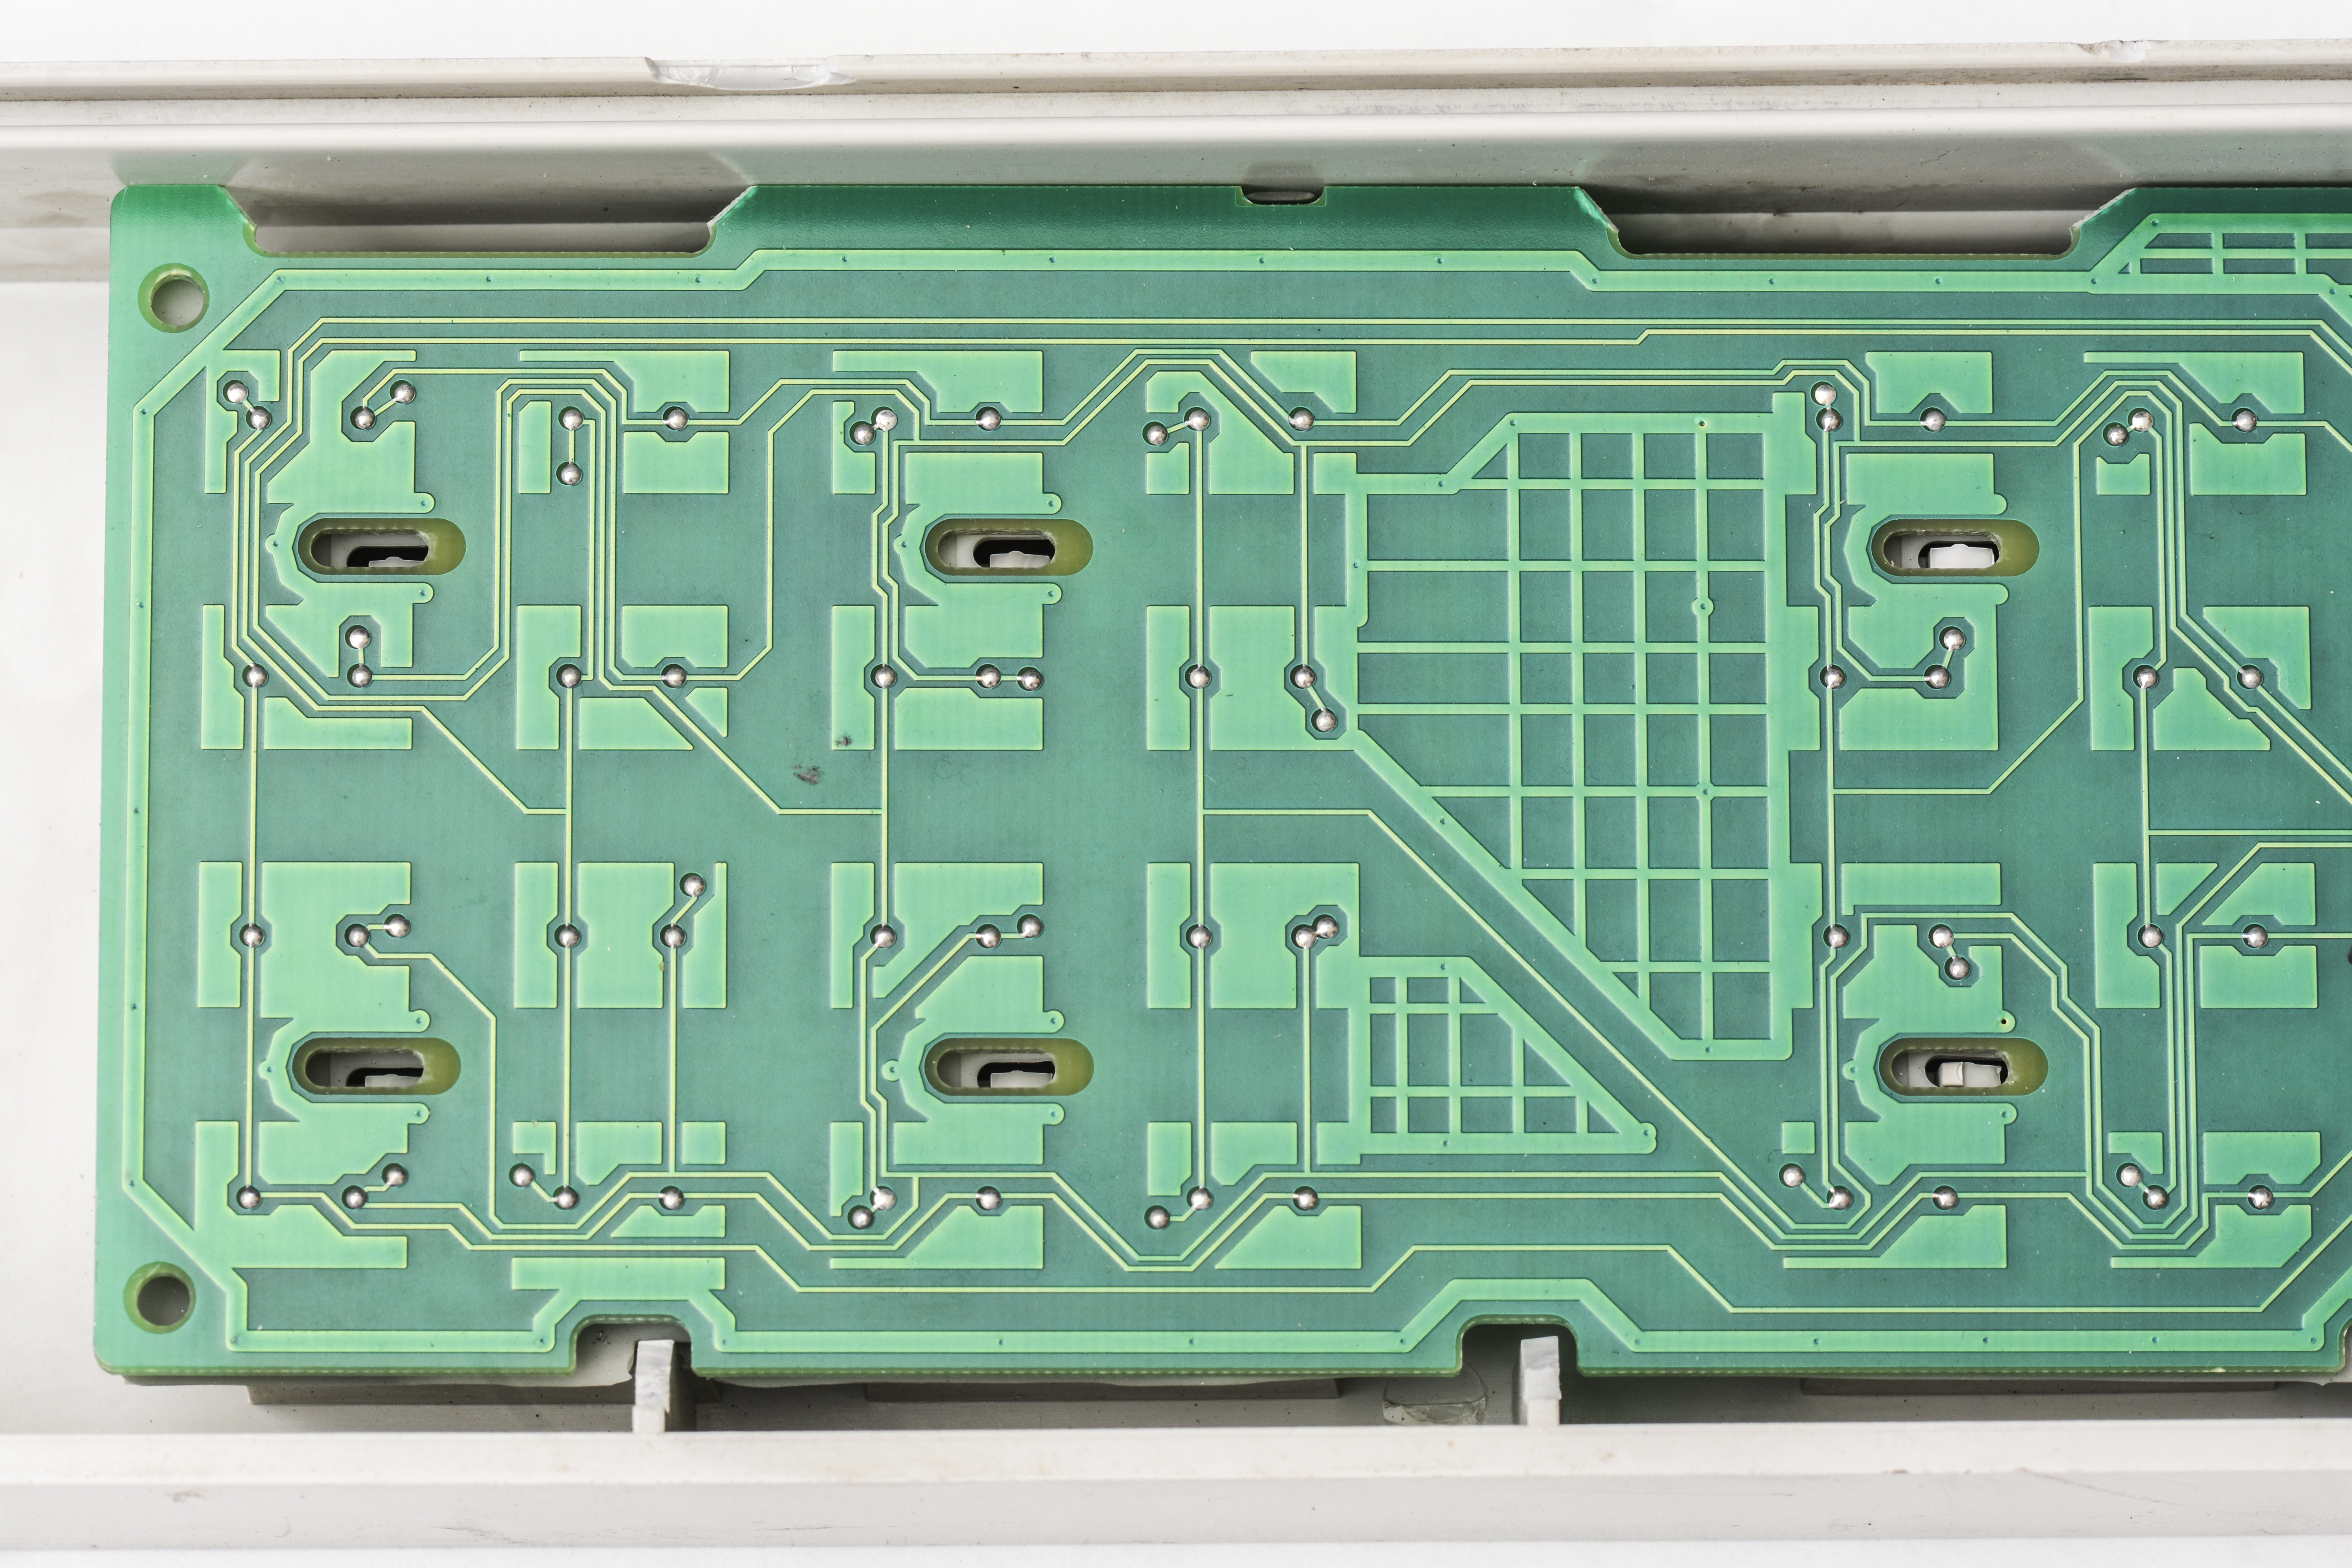
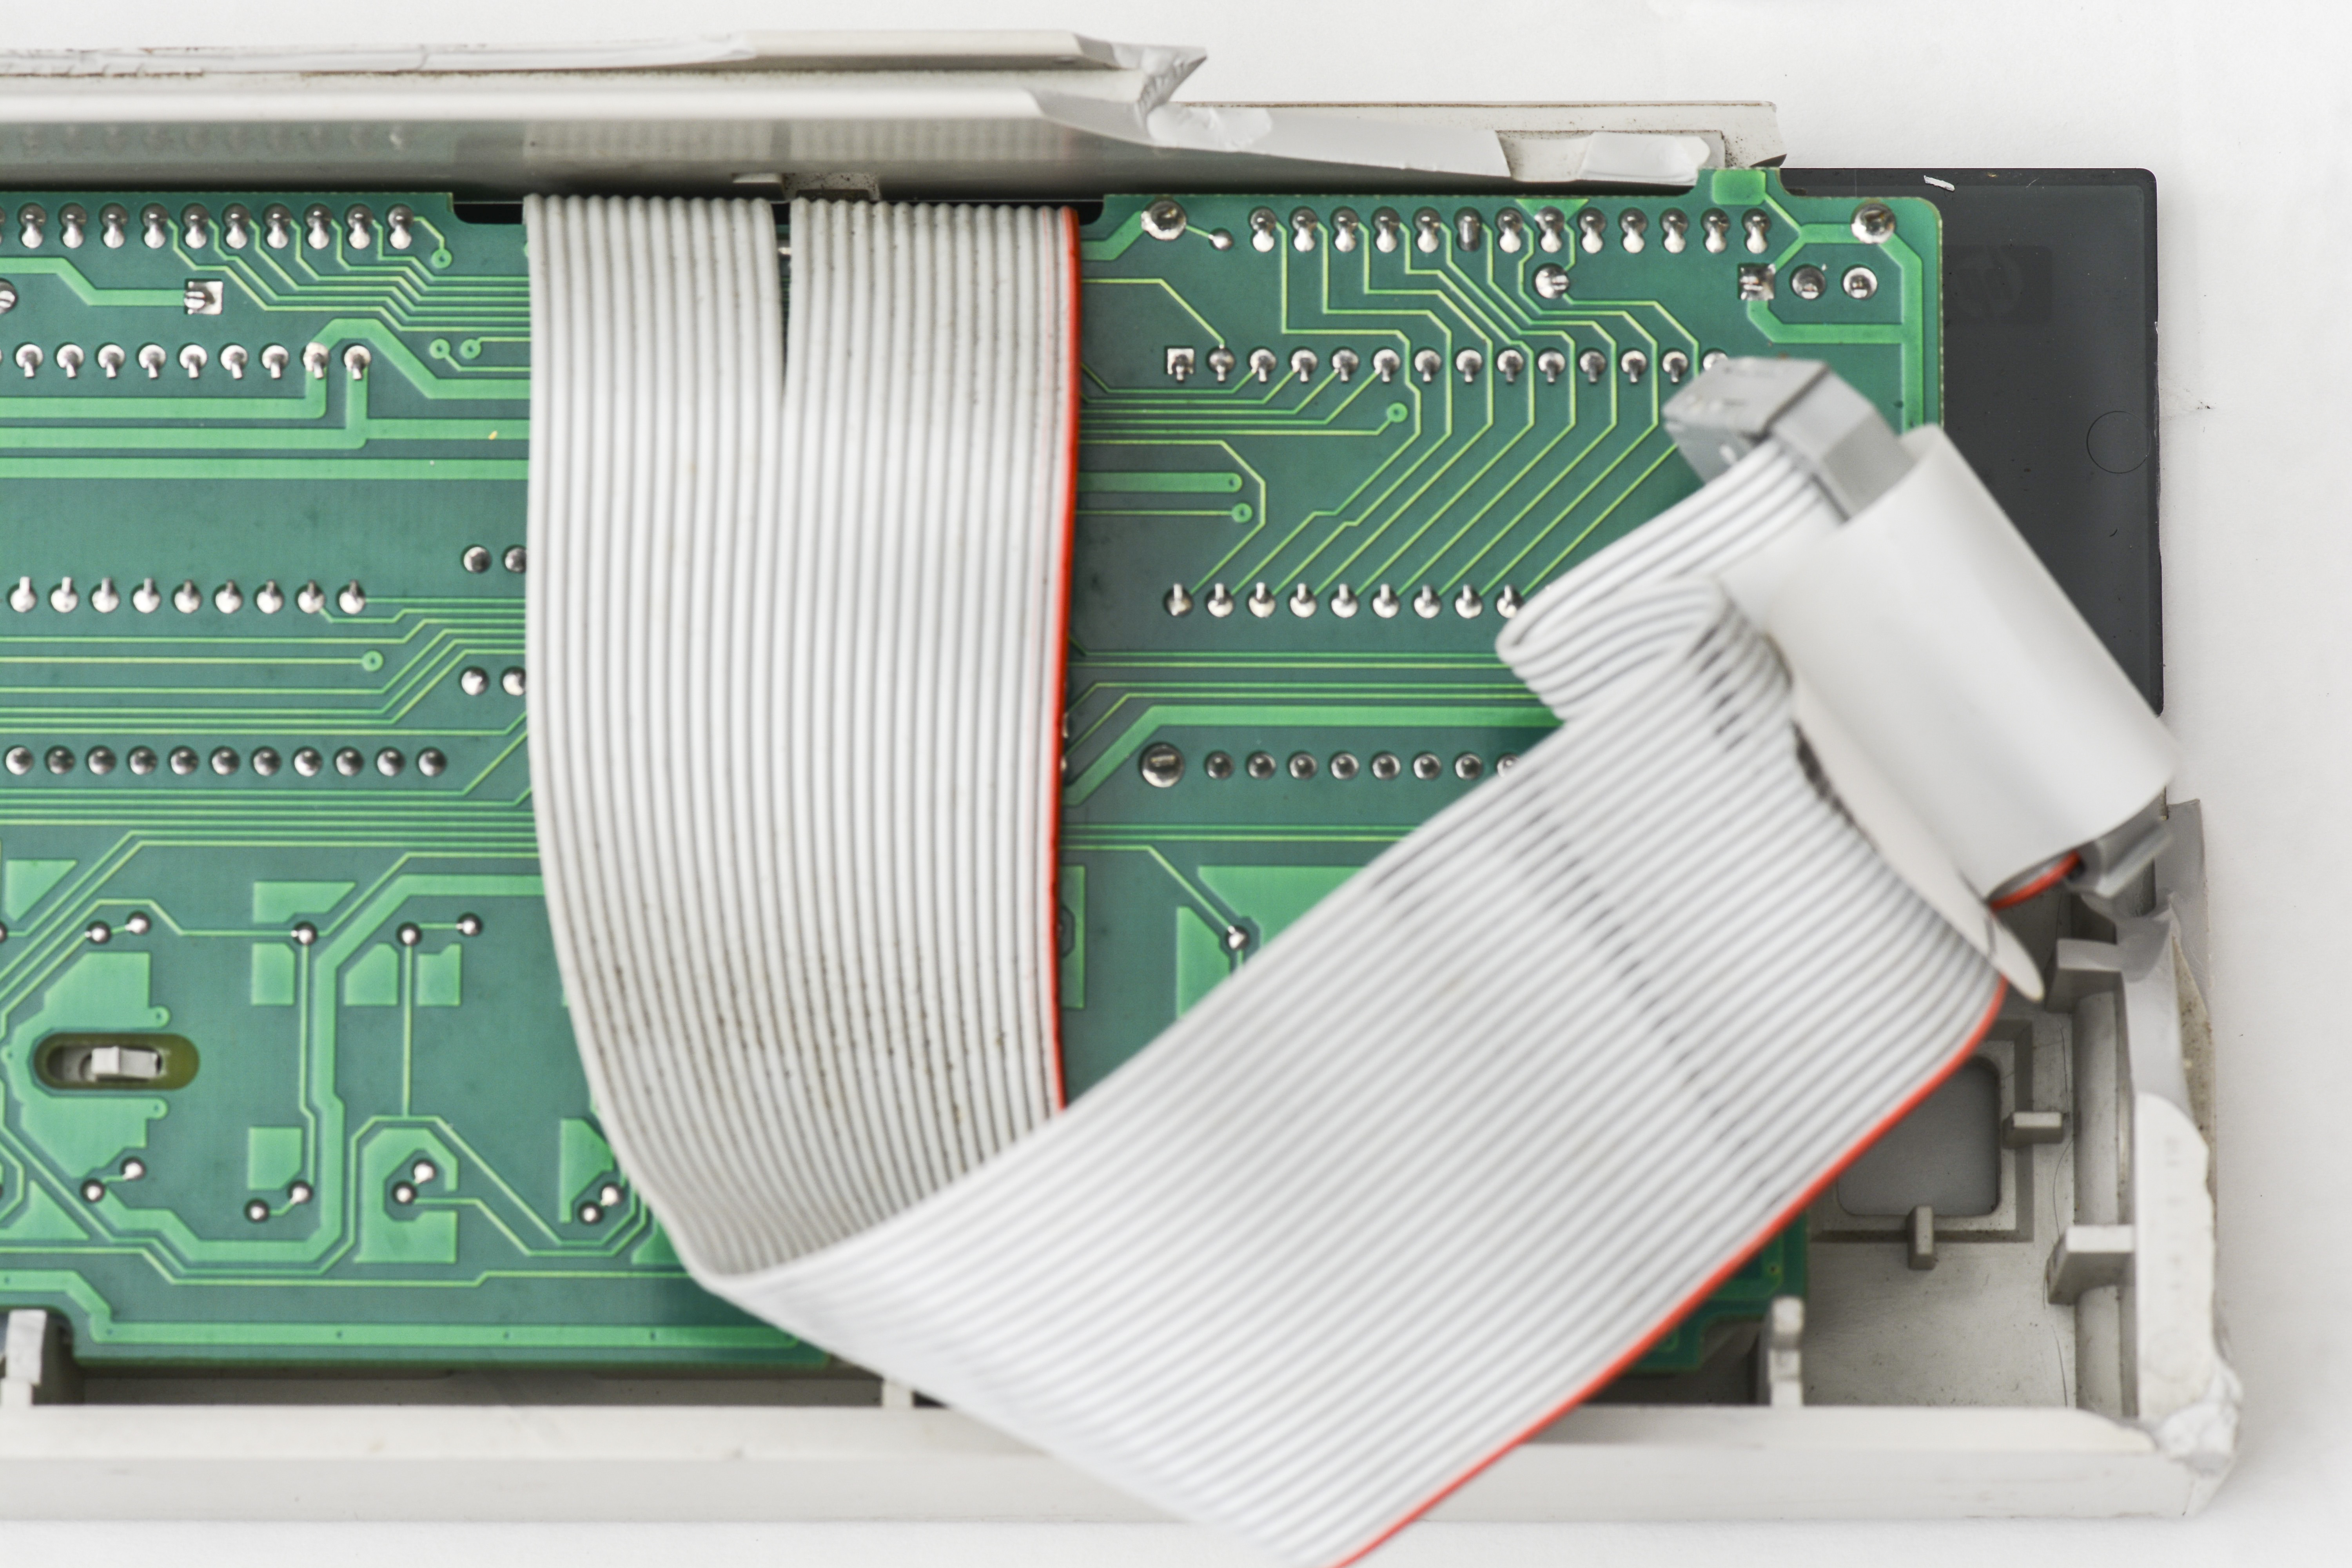
Image 13-14: Front panel cable
But VFD glass looks okay! Will see if it’s fully functional after power up with donor A5 digital board.
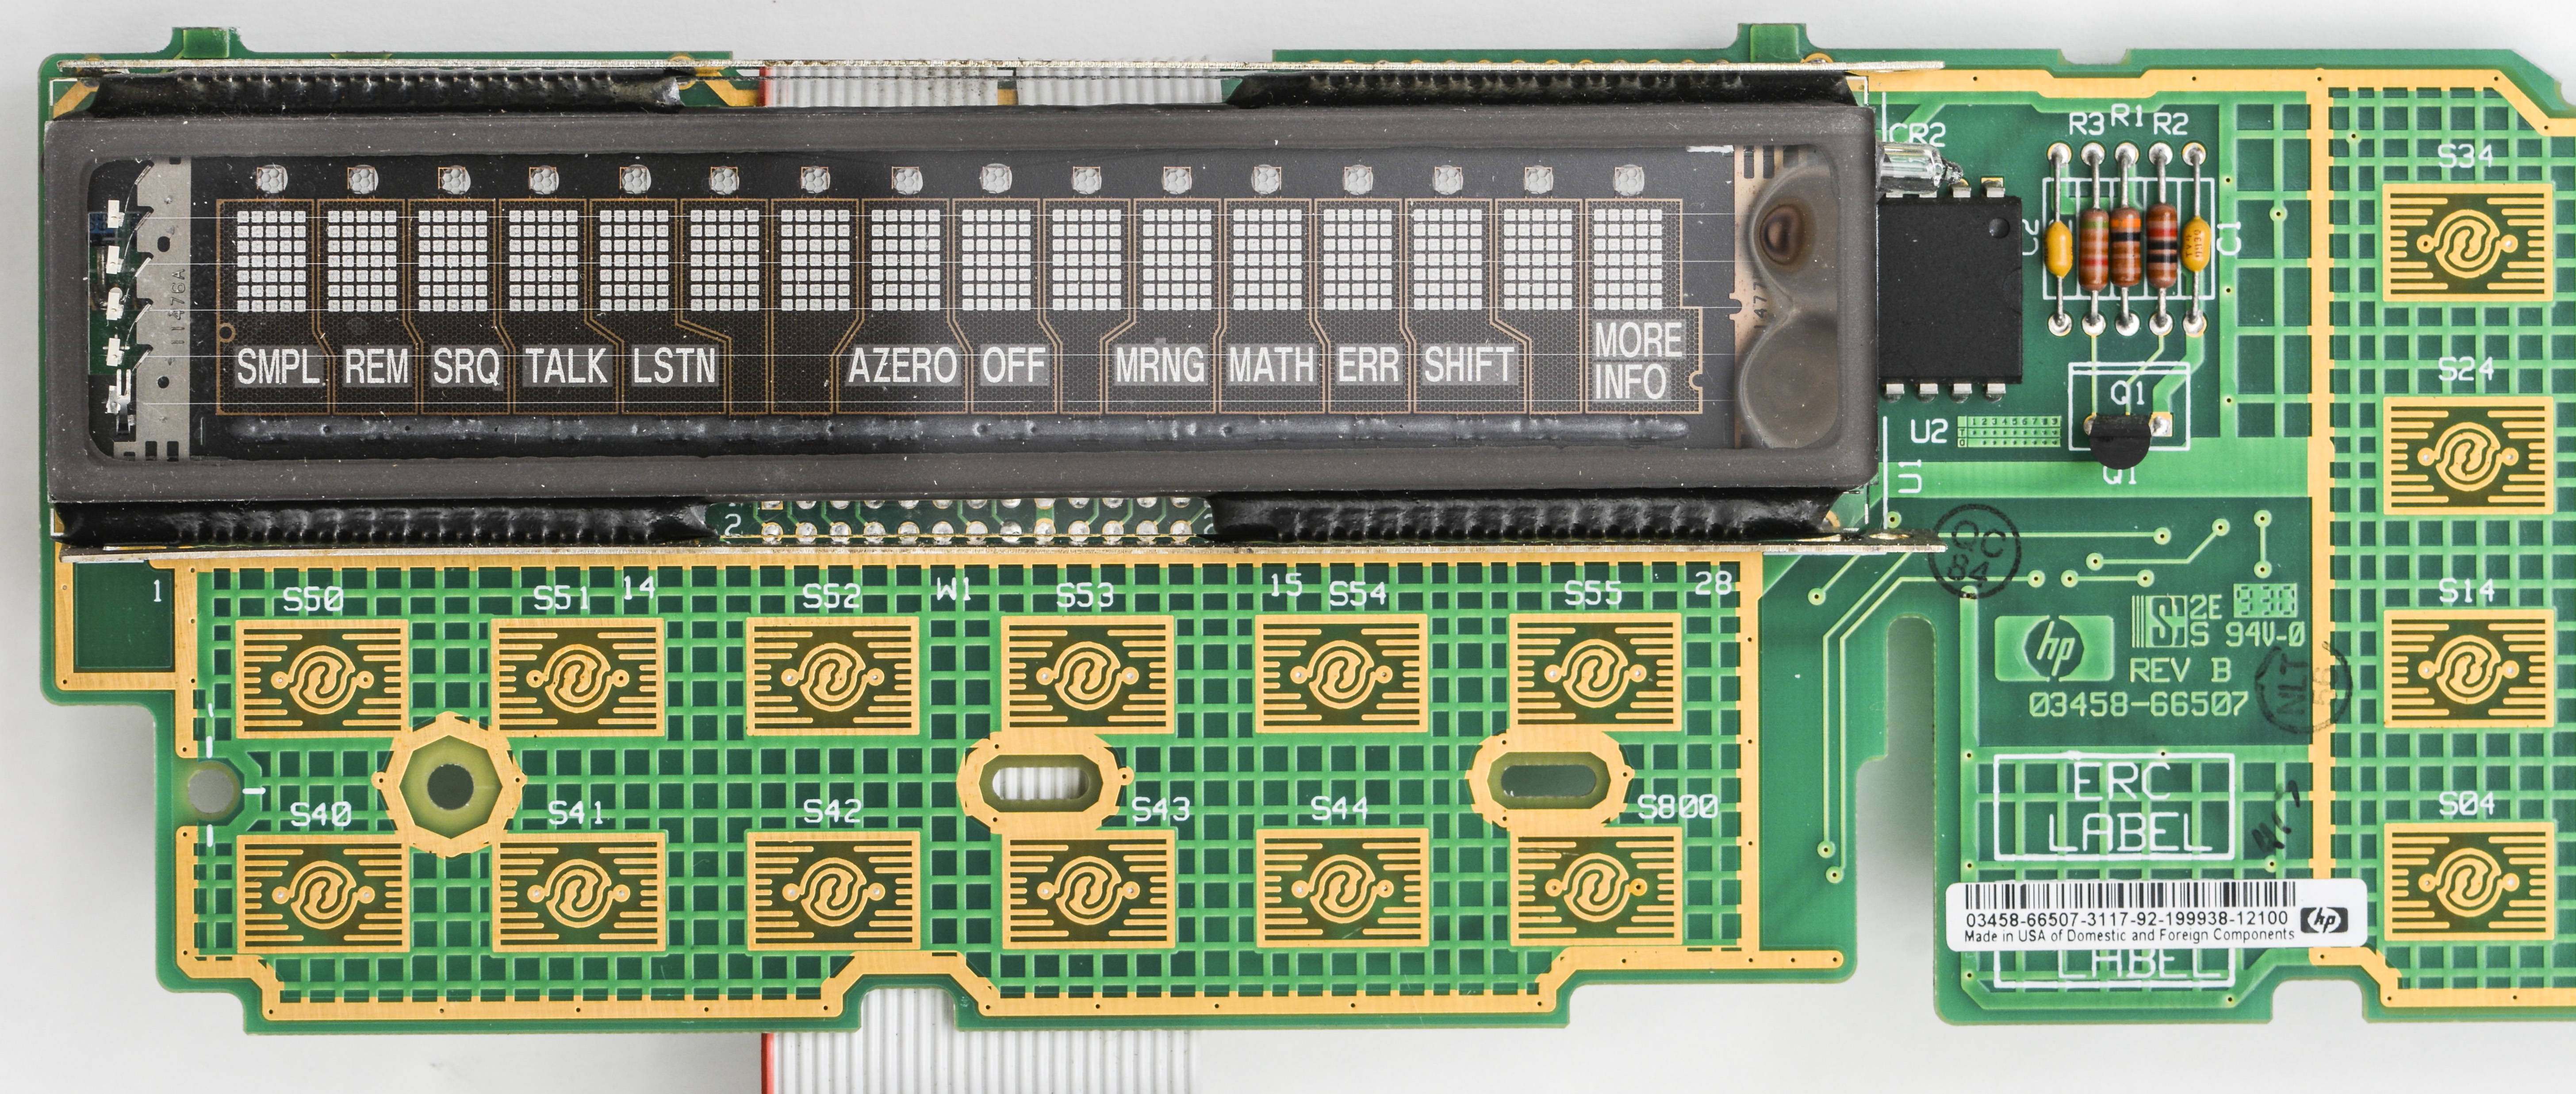
Image 15: Working VFD glass
| XFRMR Winding | Expected | Measured |
|---|---|---|
| Red-Red/Yellow | 1.8 Ω, 23 VAC | 1.73 Ω, 22.8 VAC |
| Red-Red/Yellow | 1.8 Ω, 23 VAC | 1.71 Ω, 22.8 VAC |
| Yellow-Yellow | 0.4 Ω, 10 VAC | 0.35 Ω, 10.2 VAC |
| Red-Yellow | >10 GΩ | OK |
| Red-Guard | >10 GΩ | OK |
| Red-GND | >10 GΩ | OK |
| Yellow-Guard | >10 GΩ | OK |
| Yellow-GND | >10 GΩ | OK |
Table 1: Transformer test results
Looking good, transformer appear to be healthy. It was quite a pricey part, as we learned during first HP 3458A repair. Schematics of transformer is shown on Image 16, in case our readers need a reminder.
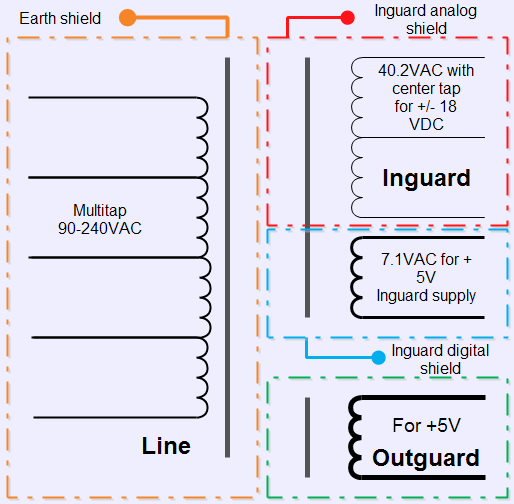
Image 16: HP 3458A’s transformer configuration
Now let’s test main power supply rails, both in guard (on A4 PCBA) and outguard (A6 PCBA). If these rails are bad, this could be a disaster and path to the infinite rabbit hole.
| Voltage rail | Expected | Measured |
|---|---|---|
| Outguard J400 | +5 VDC | +5.09 VDC, <3mVpk-pk |
| Outguard C8 | +15 VDC | +18.118 VDC, <3mVpk-pk |
| Outguard U200 | +8 VDC | +8.12 VDC, <3mVpk-pk |
| Inguard +5 | +5 VDC | +5.05 VDC, <3mVpk-pk |
| Inguard +18 | +18 VDC | +18.48 VDC, <3mVpk-pk |
| Inguard -18 | -18 VDC | -18.68 VDC, <3mVpk-pk |
Table 2: Power supply test results
No problems here too, everything is well within spec. Still have a chance for this repair project to be easy and quick? Yeah, I wish. Time will tell.
Time to dig deeper now.
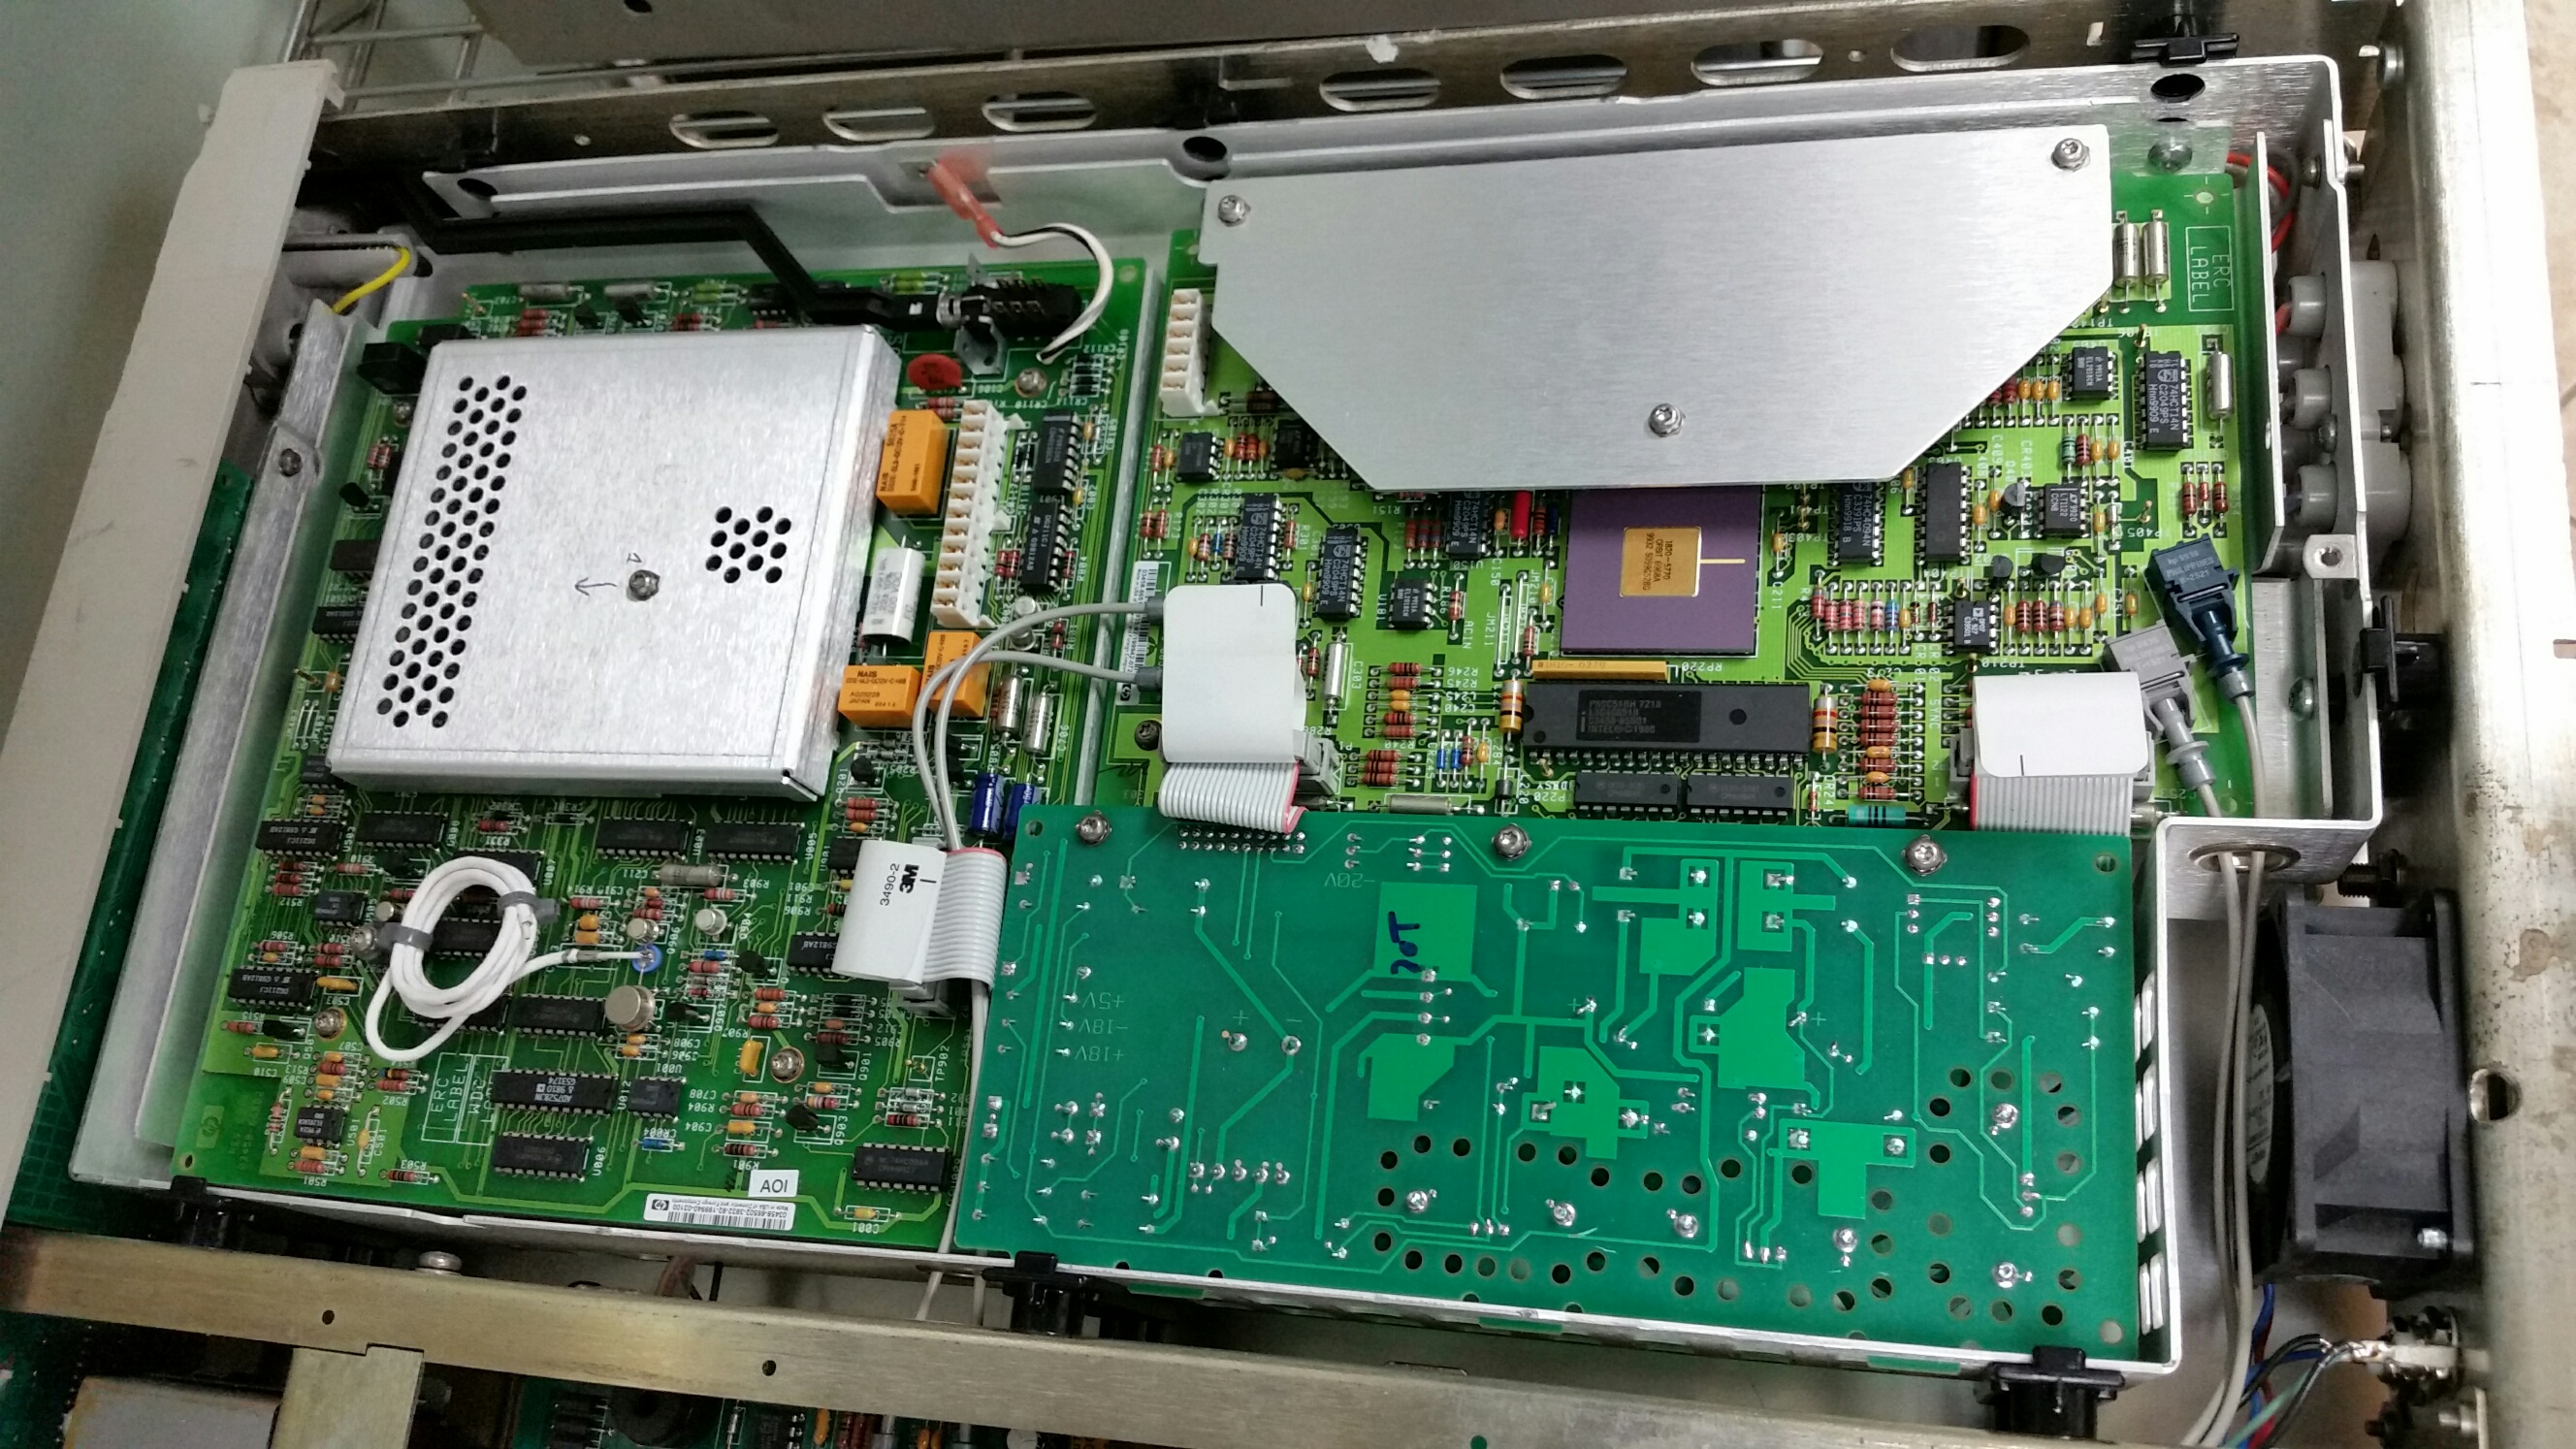
Image 17: Front panel
…
Day 2 diagnostics, A5 board test and installation
Outguard controller has arrived and ready for initial check and service. This A5 PCBA is newer to Rev.A from original HP 3458A, manufactured in 1996 with single firmware ST M27C4002 in DIP40 packag ROM chip. This ROM is UV-erasable EPROM, making firmware update relatively easy and possible in field, using regular UVA-UVC lamp and EEPROM-programmer.
Board P/N is 03458-66505 Rev.B and Engineering Revision tag is 3313. Two-layer PCB made in USA.
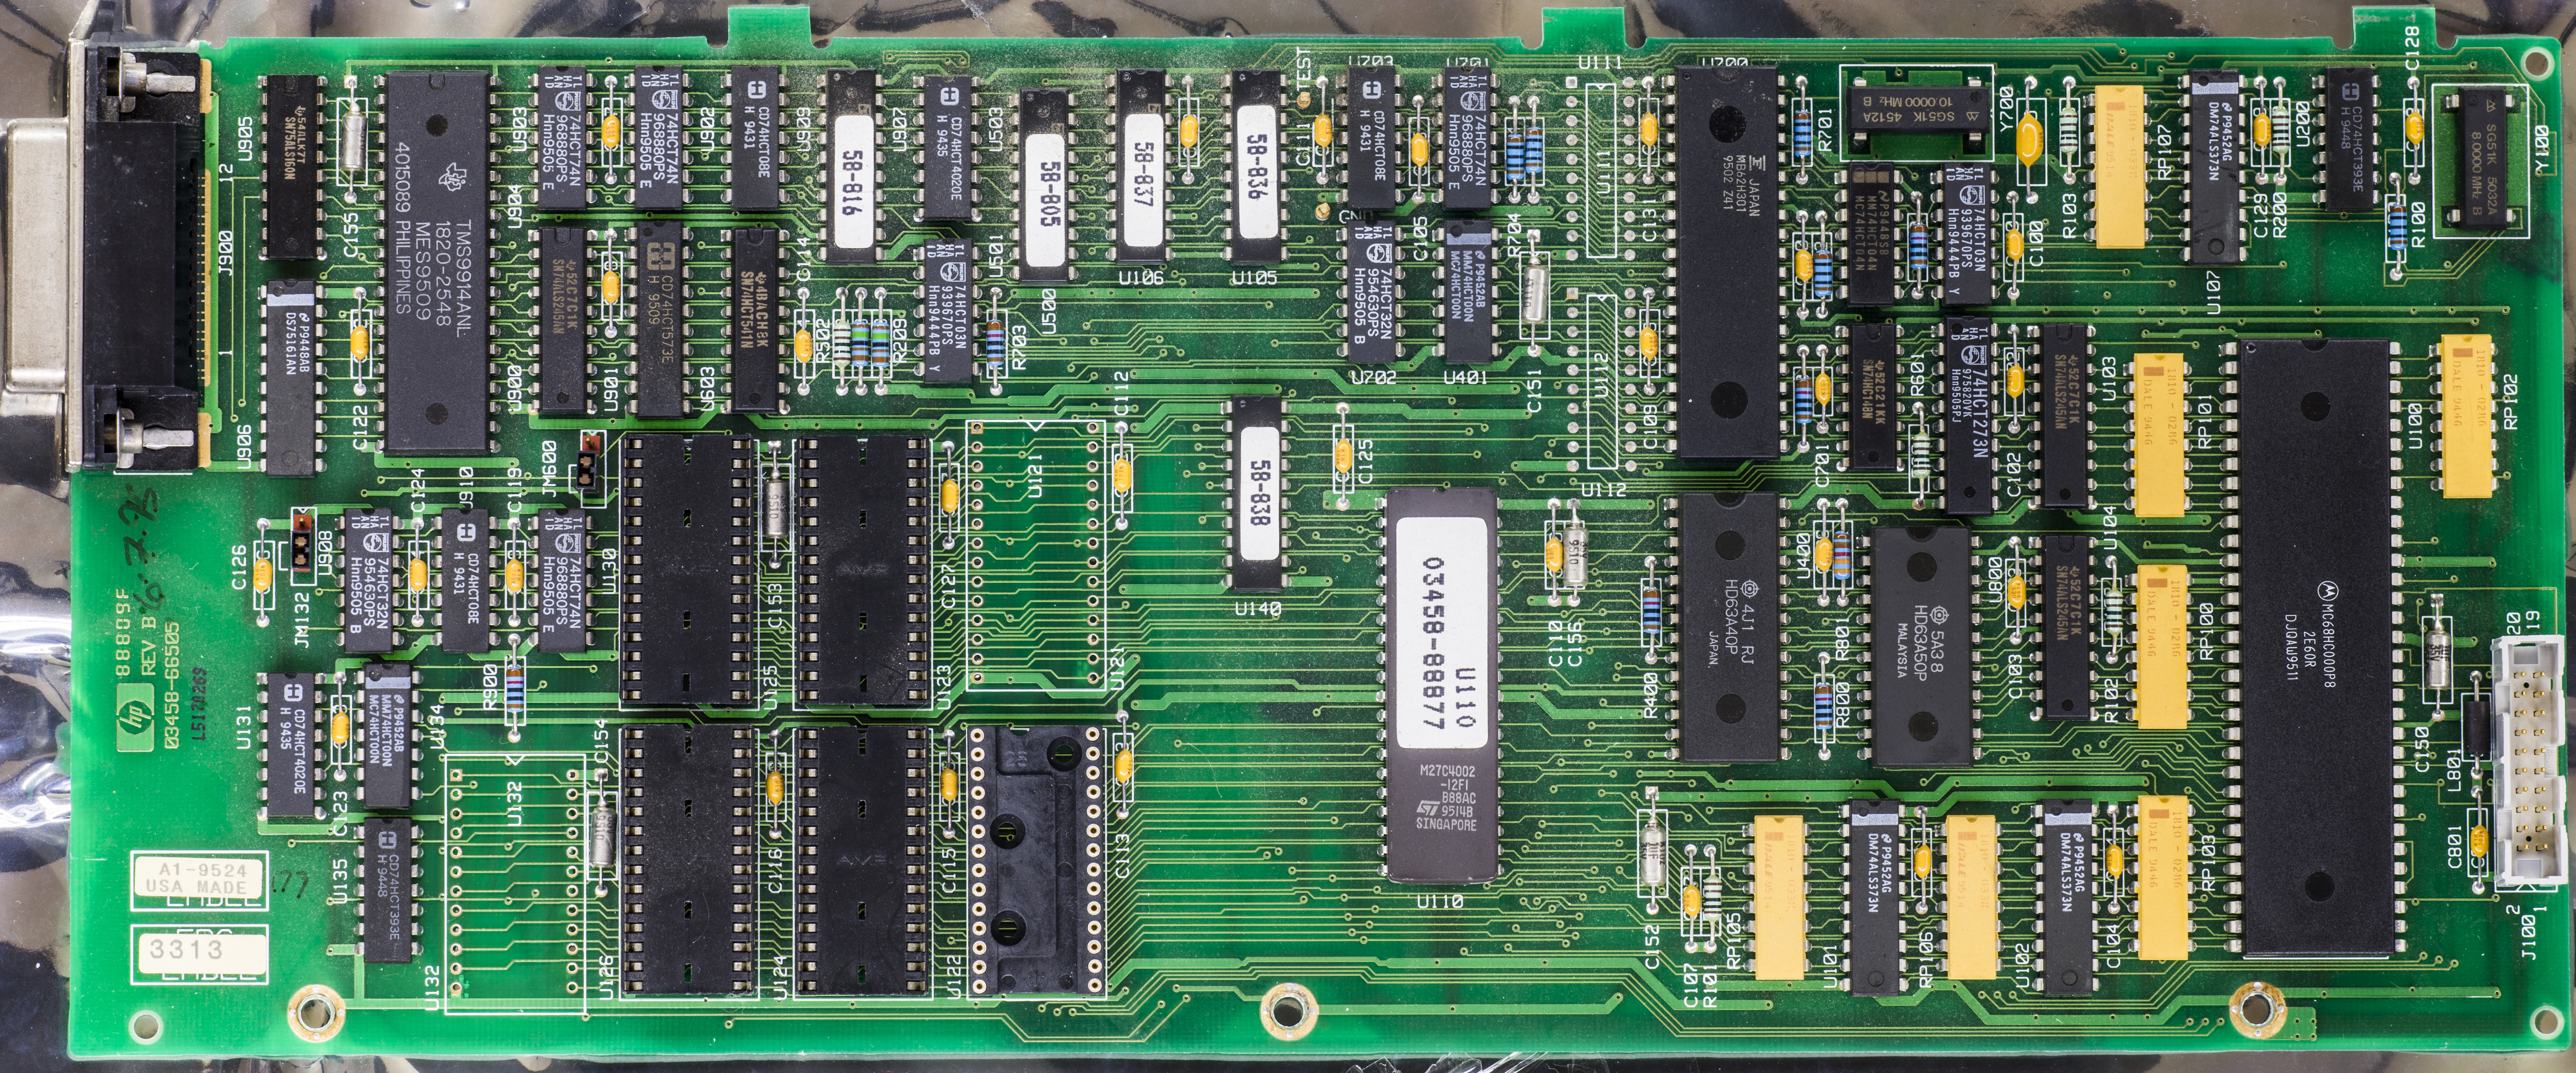
Image 18: Front panel
Board came with RAM socket and old 1995-dates Dallas chips, so those are to be removed and replaced with good quality collet sockets, to install fresh new Dallas NVRAMs. RAM on this board formed by pair non-volatile Dallas (today it’s MAXIM) DS1230, high and low bytes separately. If these NVRAM become bad, meter during power-on self-test will throw error RAM TEST 1 LOW or RAM TEST 1 HIGH depends on which IC died and lockup further operation.
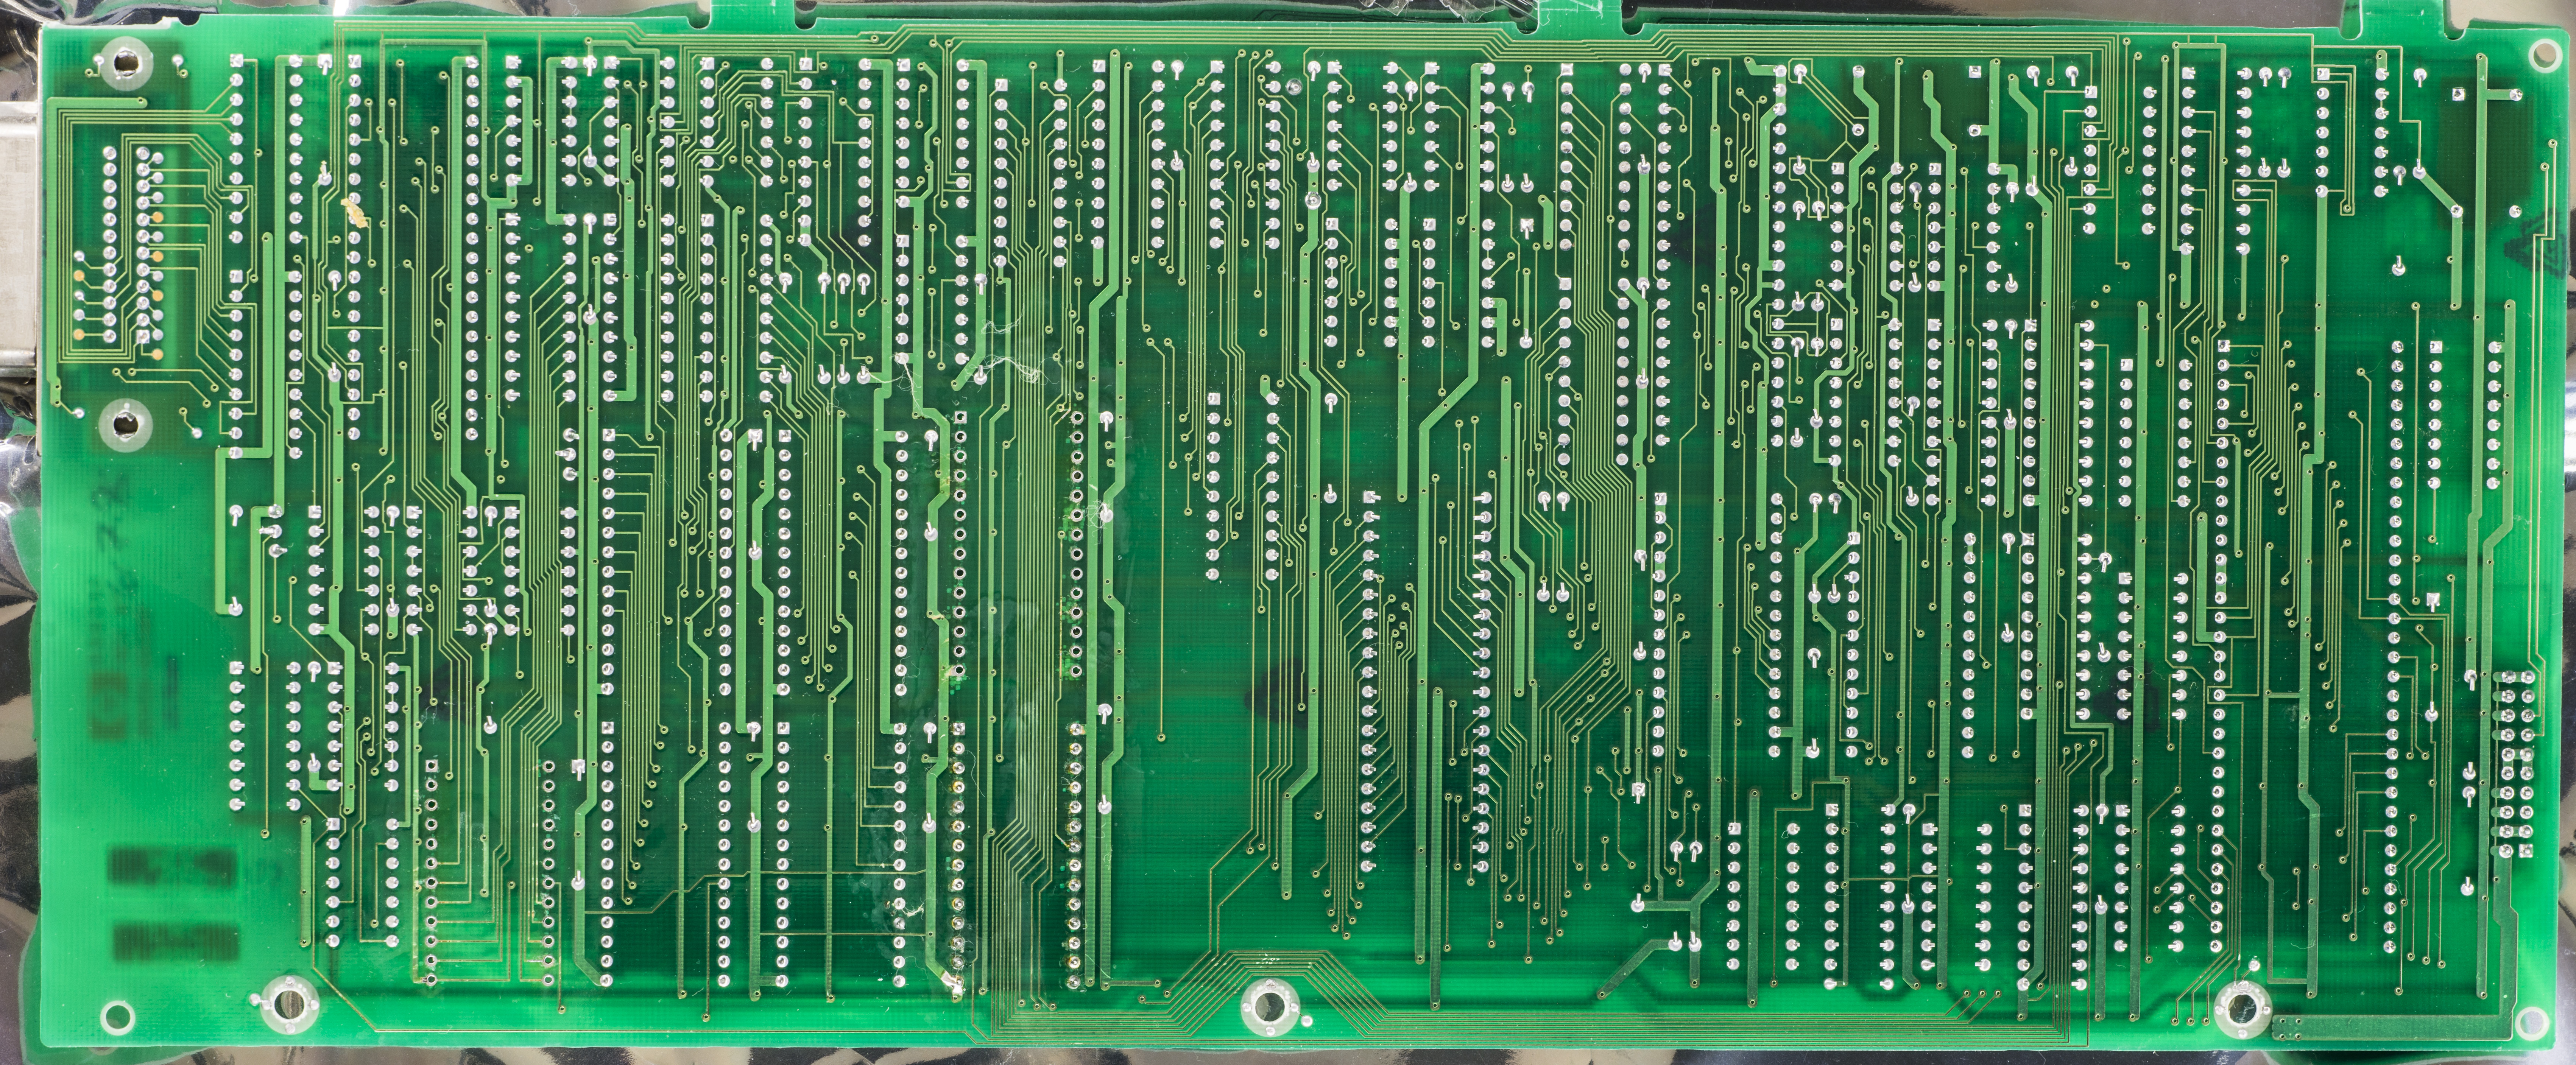
Image 19: Front panel
No bodges or issues on bottom side of the board, overall pretty clean.


Image 20-21: Front panel
New DS1230AB and DS1220 installed in sockets, ready for test. I programmed DS1220 with calibration dump from my good 3458A, so I could test operation of this A5 without losing calibration. Digital boards in 3458A can have different revisions and firmware versions, and calibration can be transferred intact, just make sure calibration DS1220 ROM is transferred between boards.
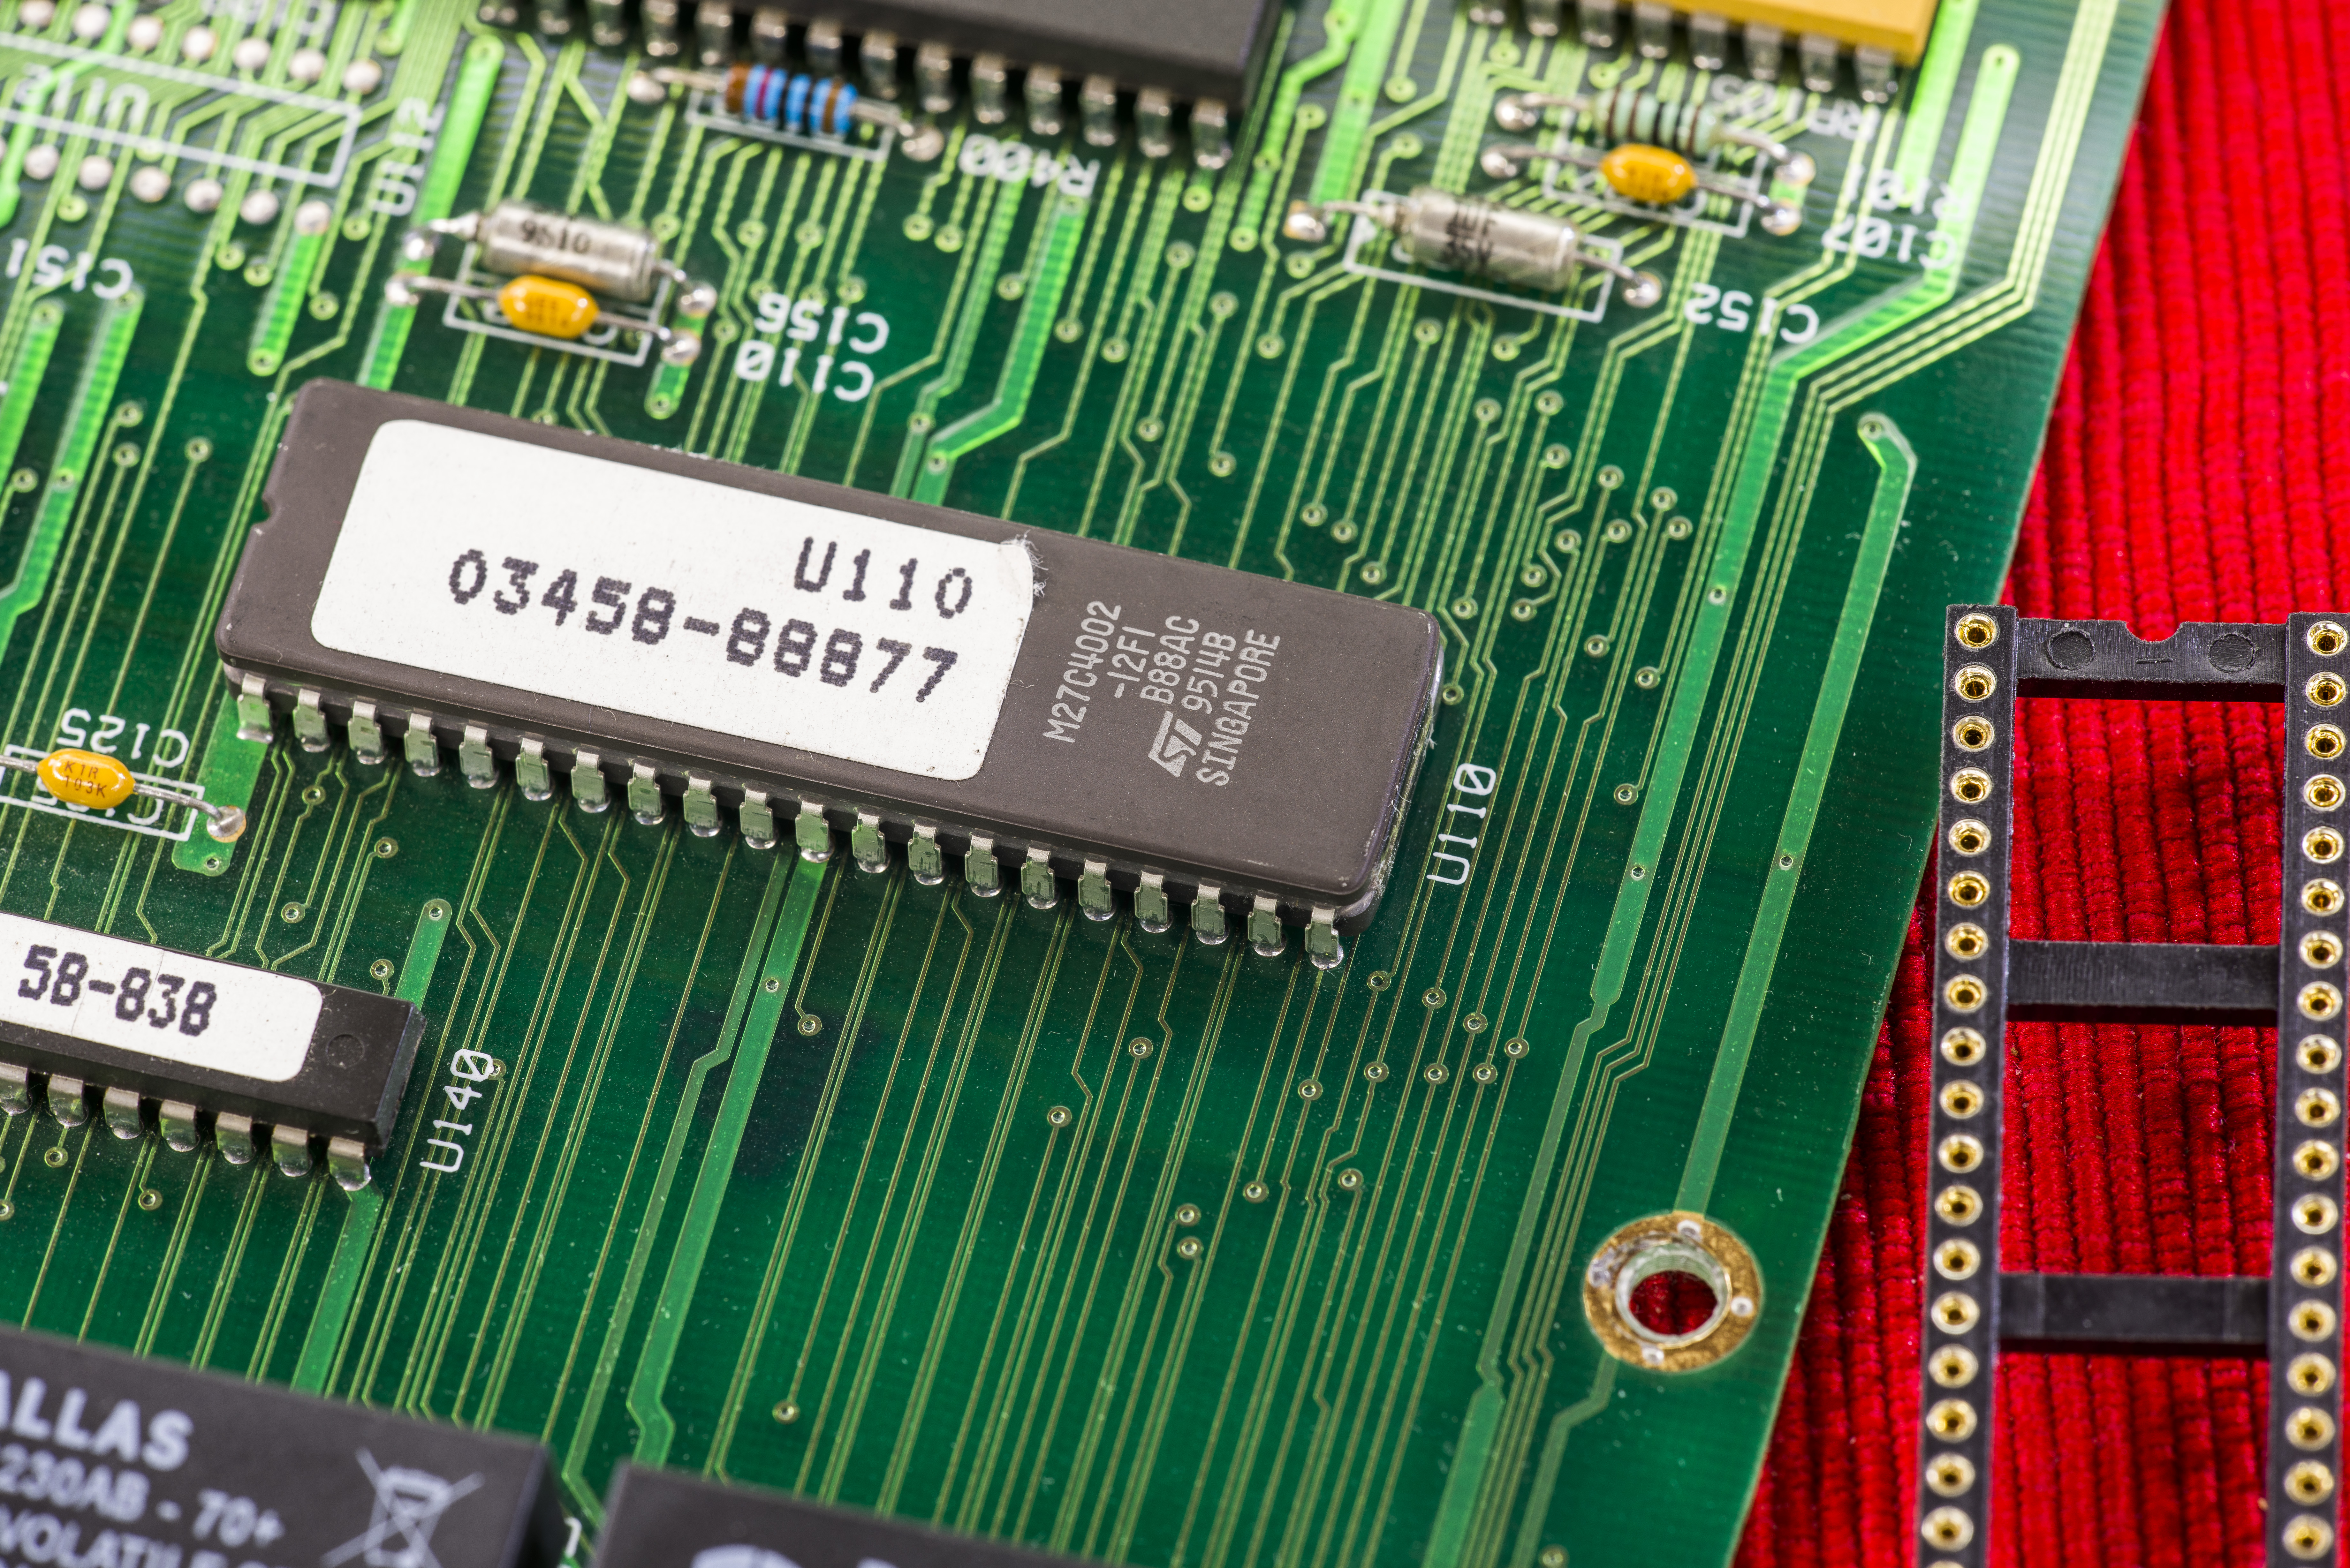
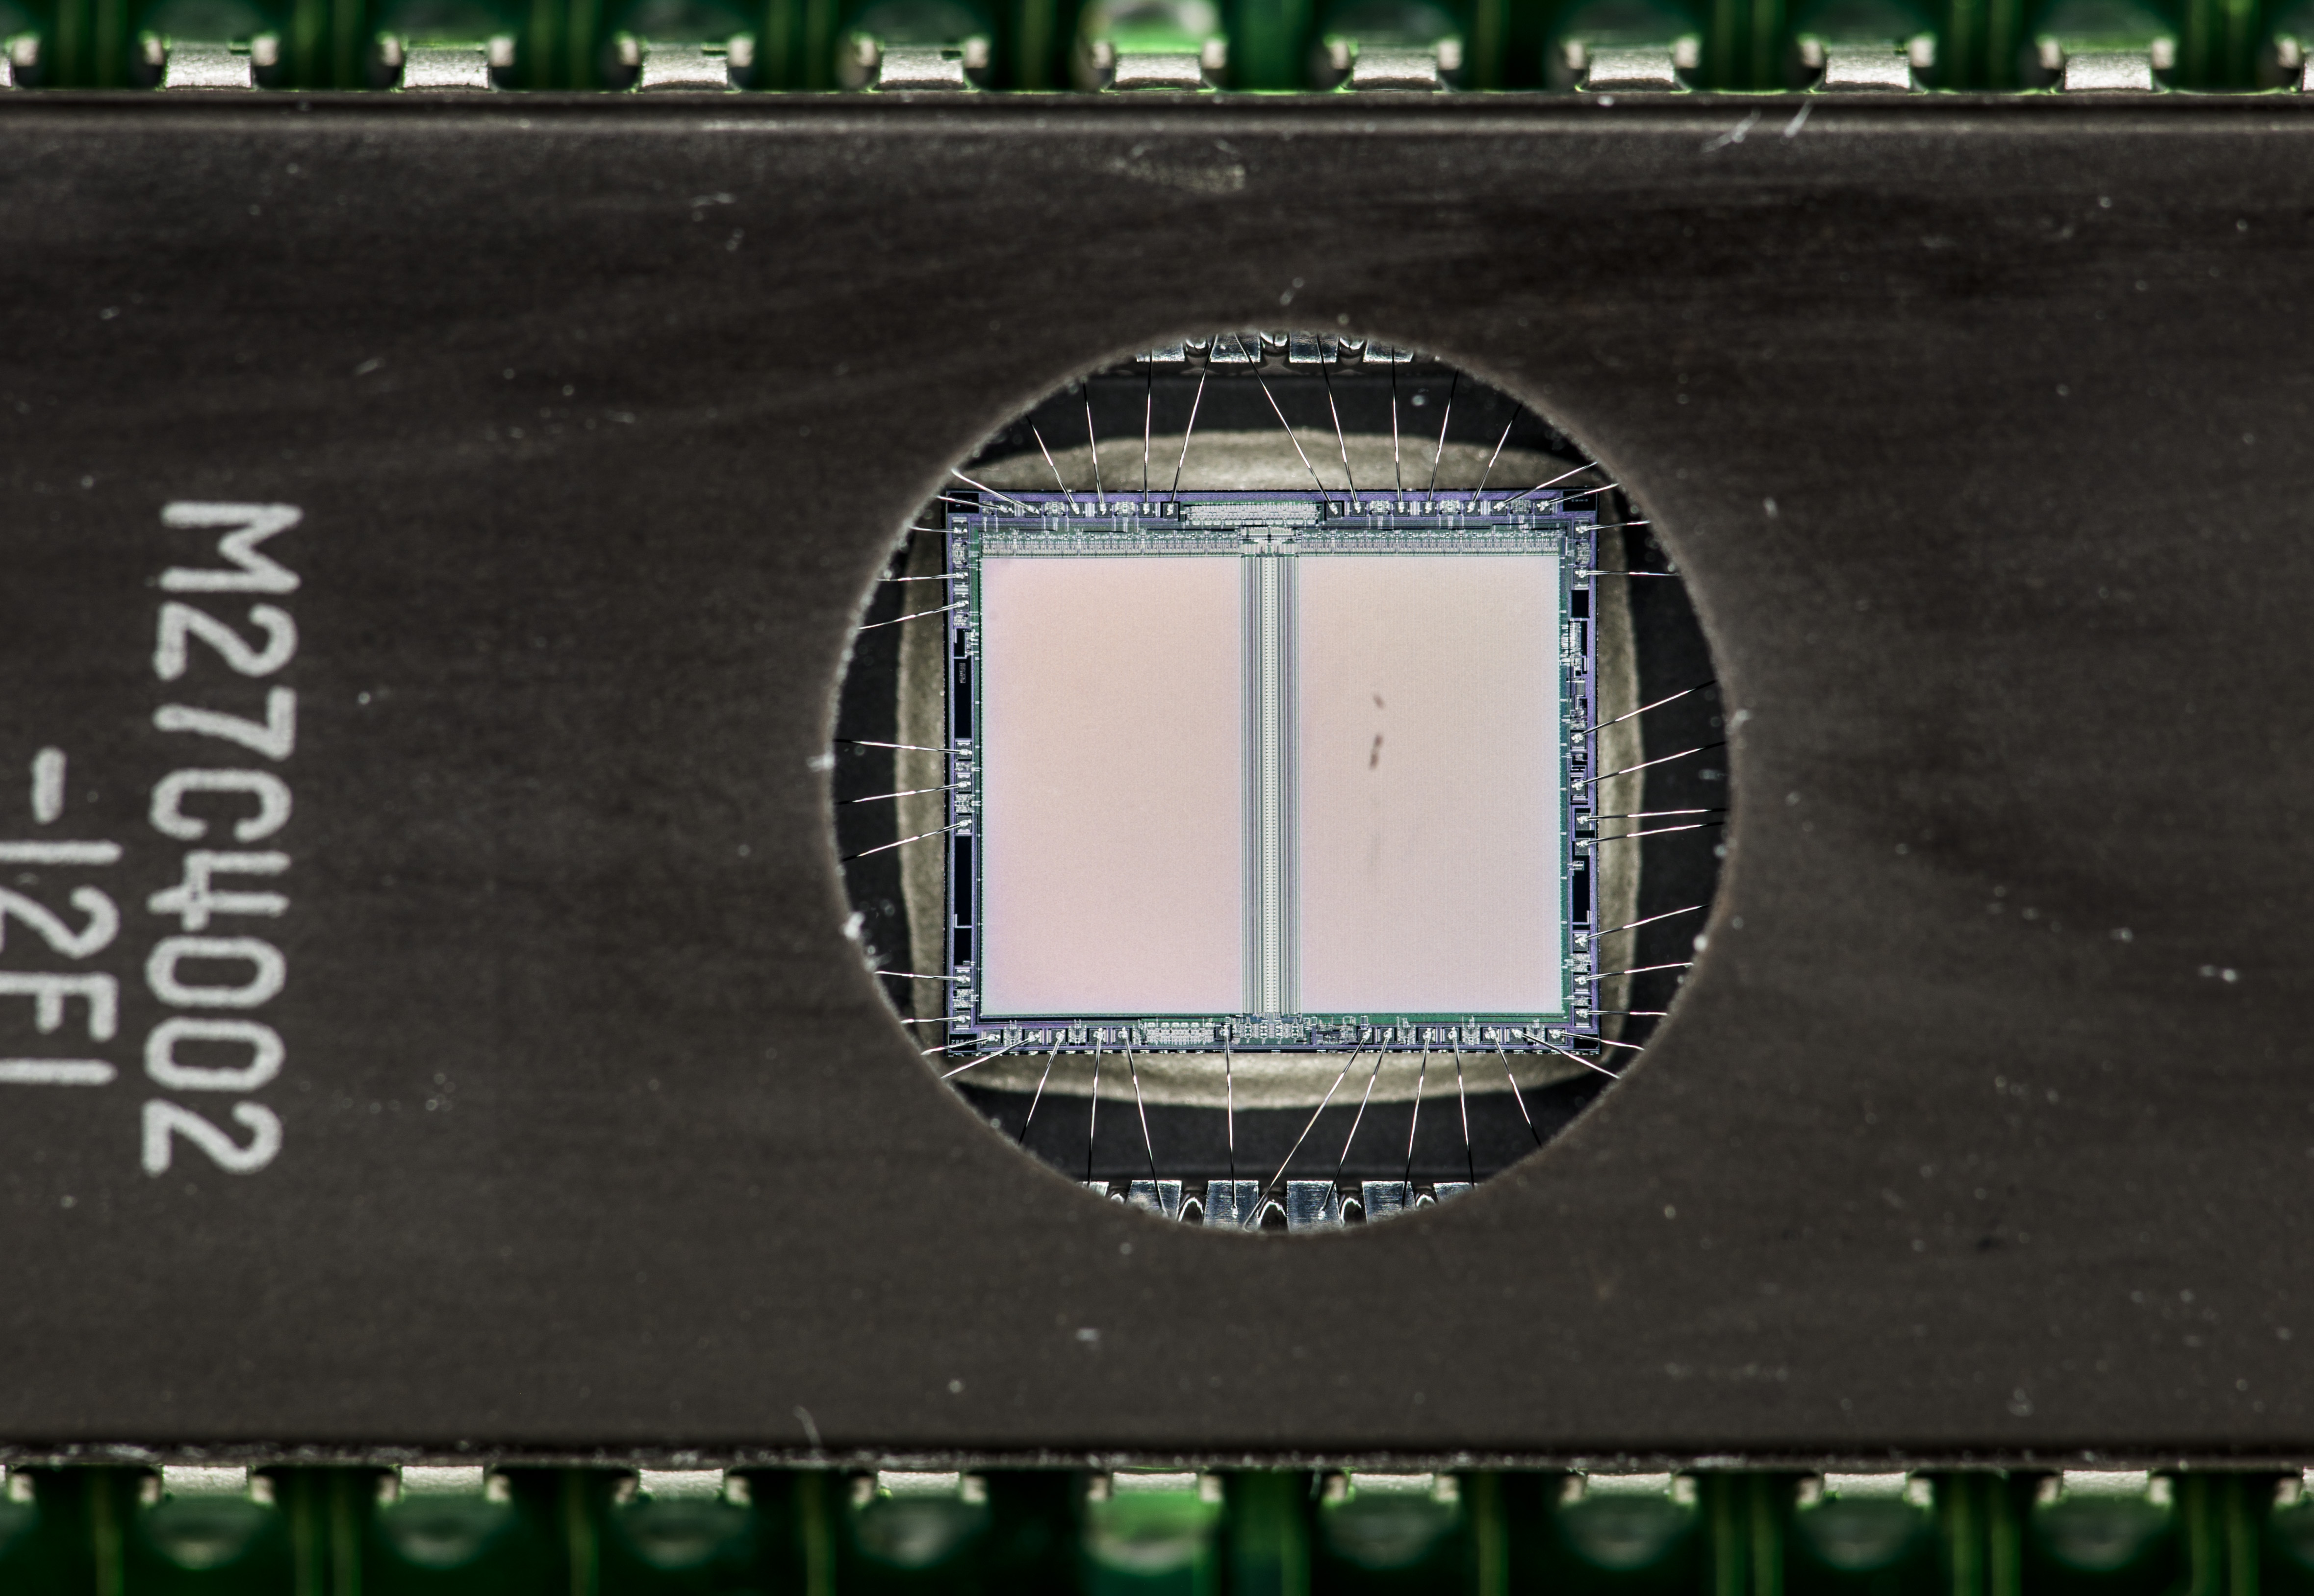
Image 22-23: Front panel
Firmware is Rev 7. I will update it later to latest Rev.9. Here is collection of firmware ROM dumps for reference:
Firmware ROM dumps for HP/Agilent/Keysight 3458A, read by general purpose ROM programmer. I used TL866CS from eBay to work with firmware ROMs. From information we have, firmware dumps are compatible with all hardware versions.
| ROM | Revision 2 | Revision 4.6 | Revision 6 | Revision 7 (1992) | Revision 8 (1998) | Revision 9 (latest) |
|---|---|---|---|---|---|---|
| U110 | 03458-88820 | 03458-88840 | 03458-88860 | 03458-88870 | 03458-88880 | 03458-88890 |
| U111 | 03458-88821 | 03458-88841 | 03458-88861 | 03458-88871 | 03458-88881 | 03458-88891 |
| U112 | 03458-88822 | 03458-88842 | 03458-88862 | 03458-88872 | 03458-88882 | 03458-88892 |
| U113 | 03458-88823 | 03458-88843 | 03458-88863 | 03458-88873 | 03458-88883 | 03458-88893 |
| U114 | 03458-88824 | 03458-88844 | 03458-88864 | 03458-88874 | 03458-88884 | 03458-88894 |
| U115 | 03458-88825 | 03458-88845 | 03458-88865 | 03458-88875 | 03458-88885 | 03458-88895 |
| 03458-88877 | 03458-88887 Single ROM |
Table 3: Firmware ROM dumps
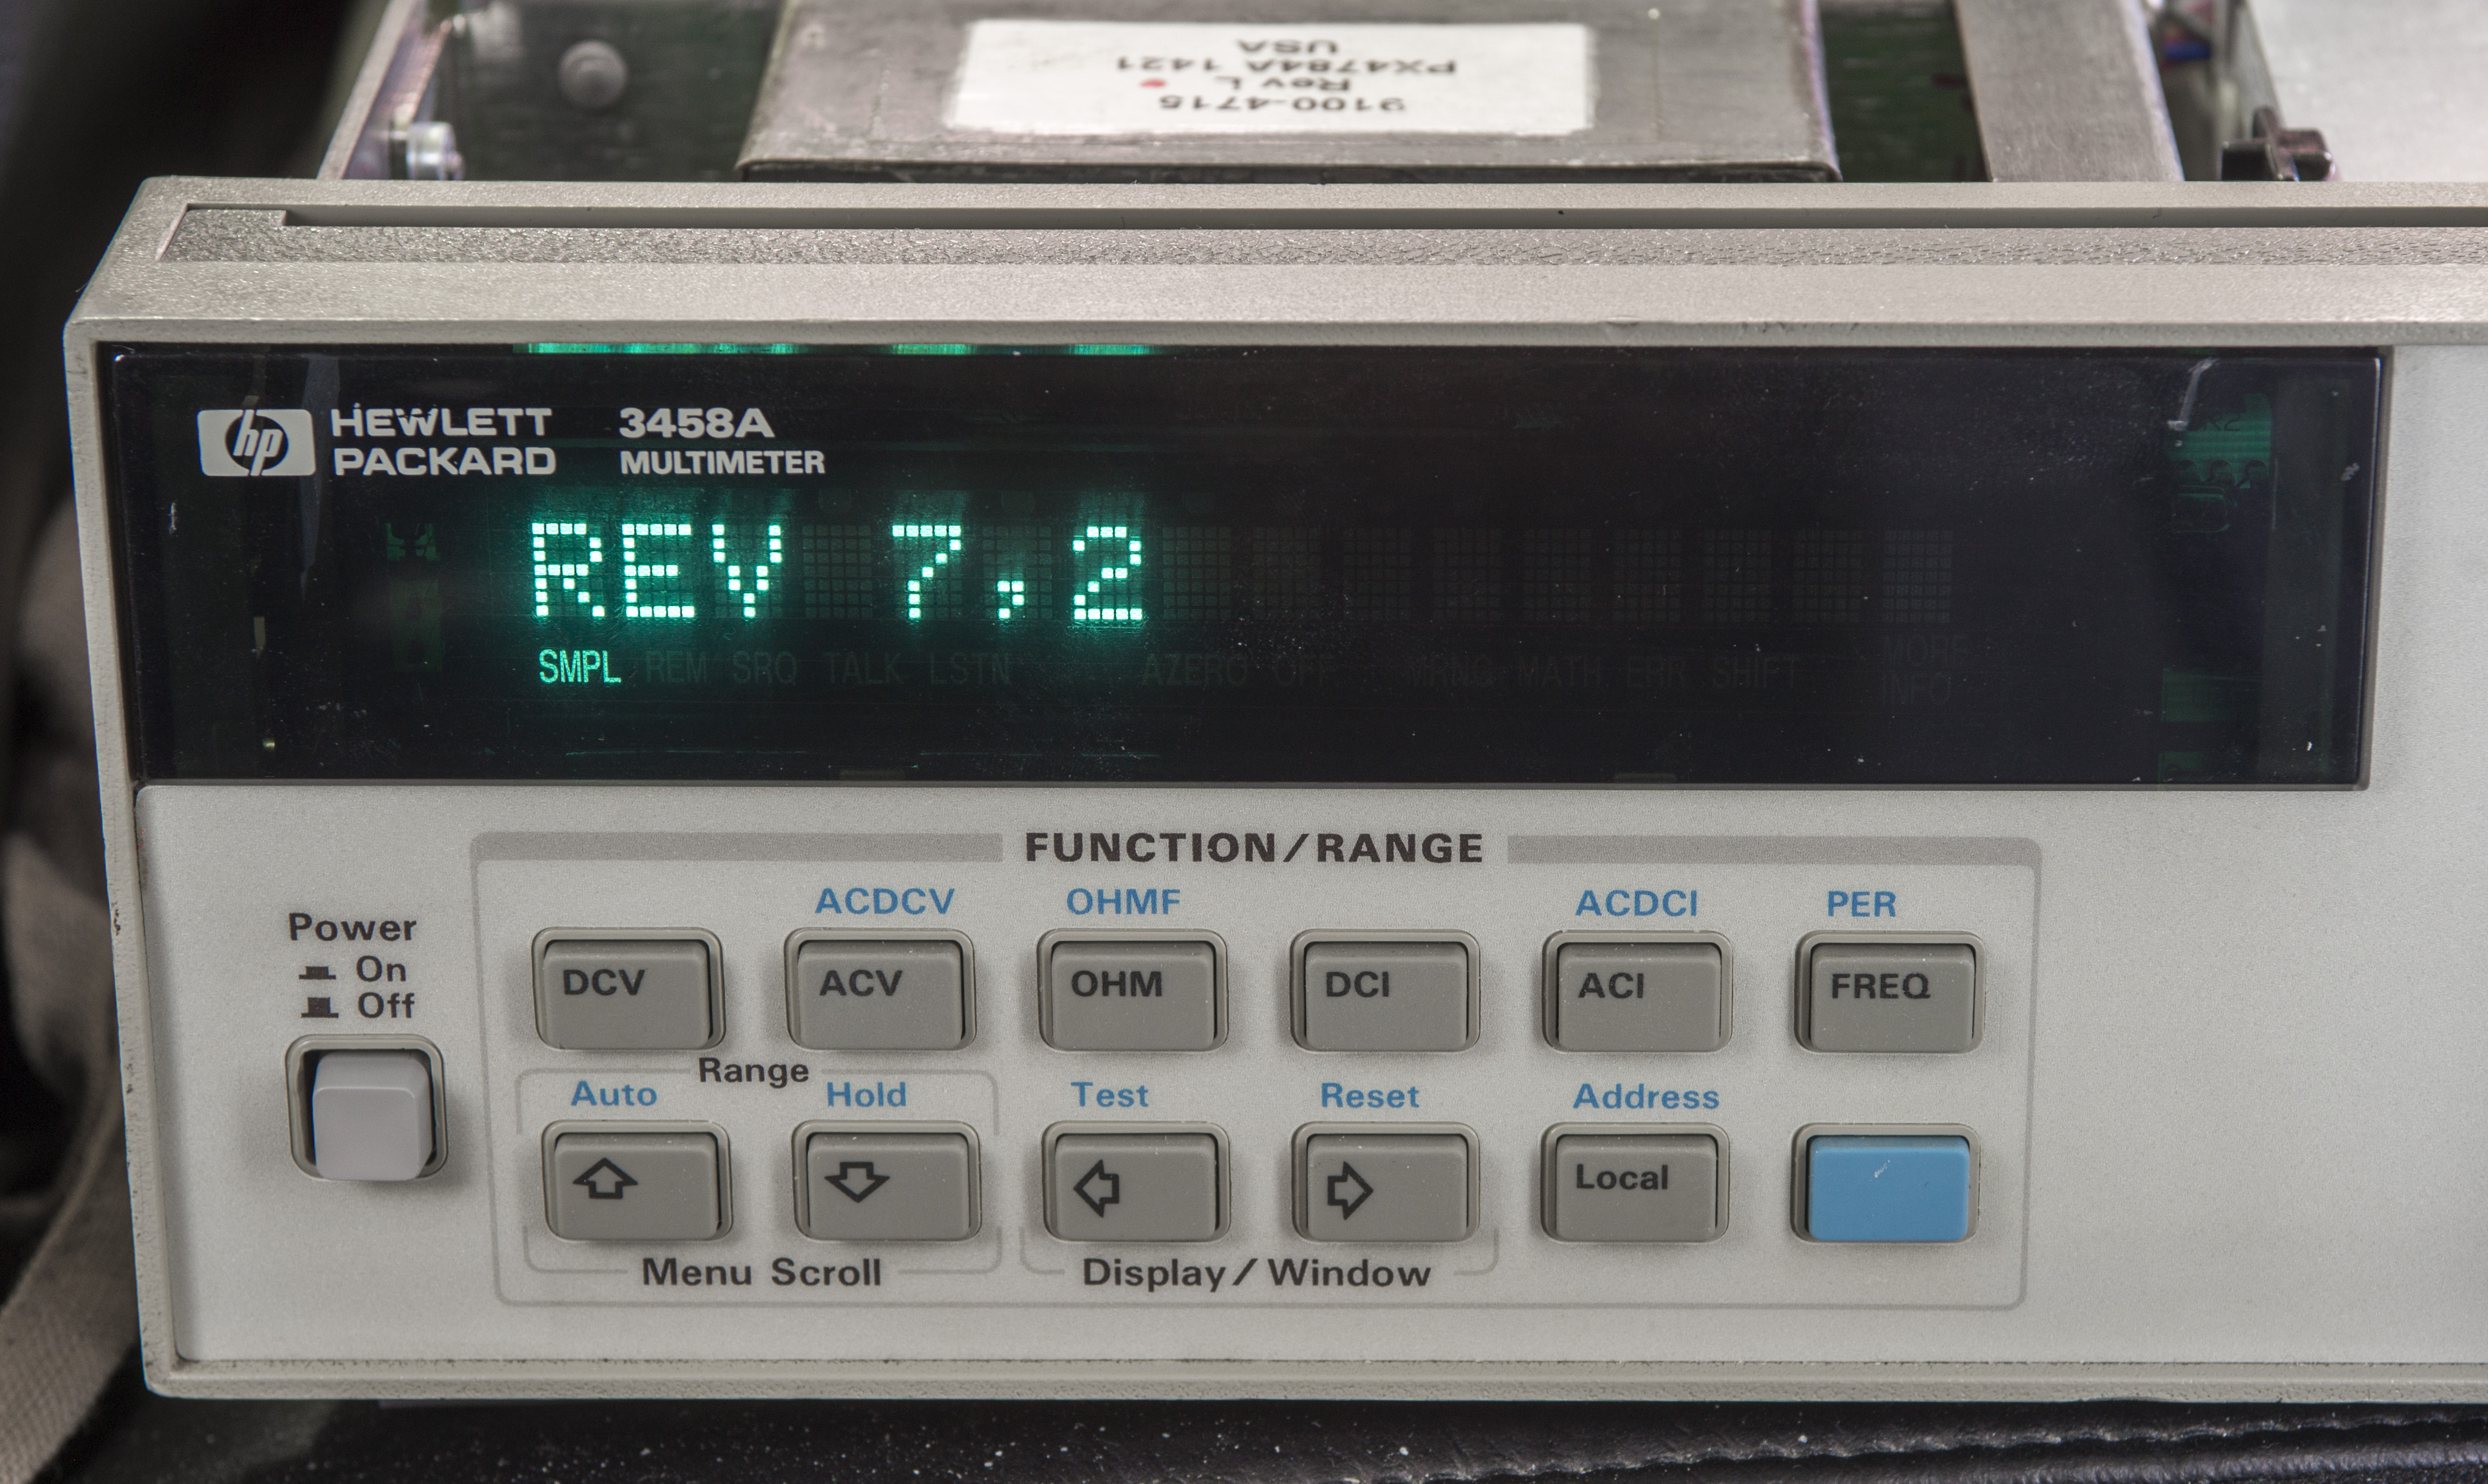
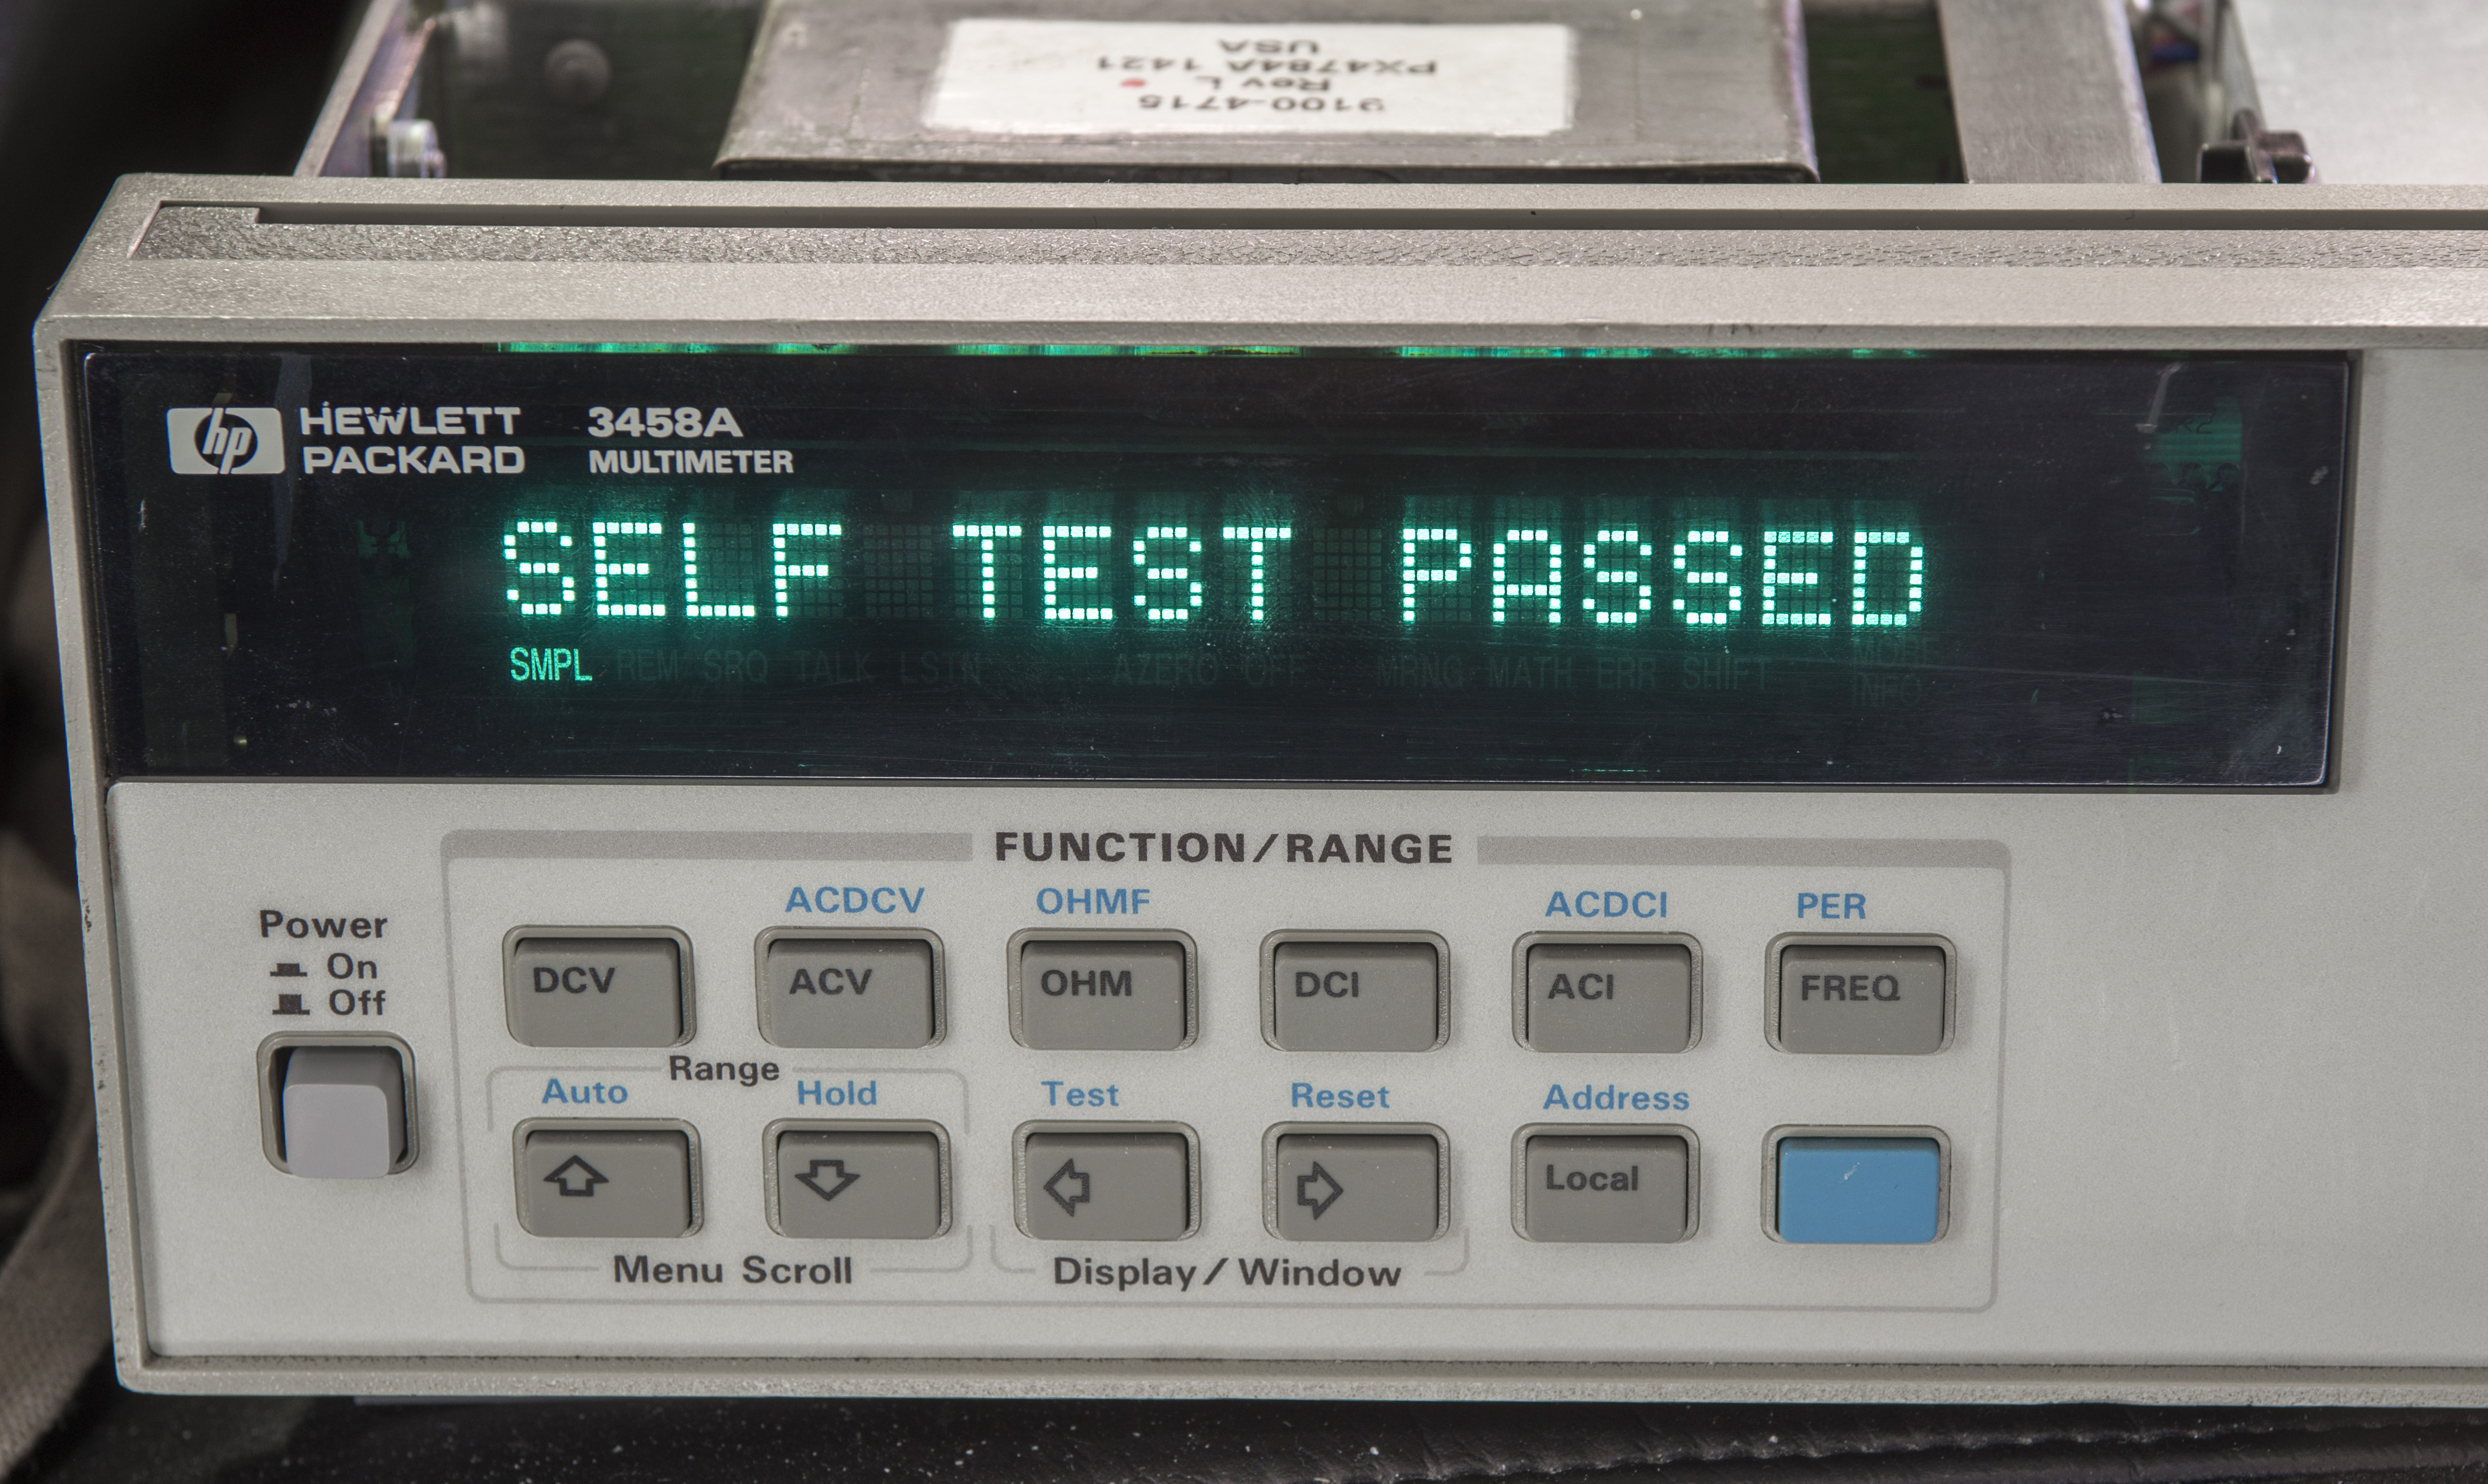
Image 24-25: First self-test pass
Board installed in good 3458A revealed no problems, everything works as expected, including GPIB interface. And to confirm that calibration is not lost or changed, here’s quick GPIB datalog chart, showing LTZ1000 module readout.
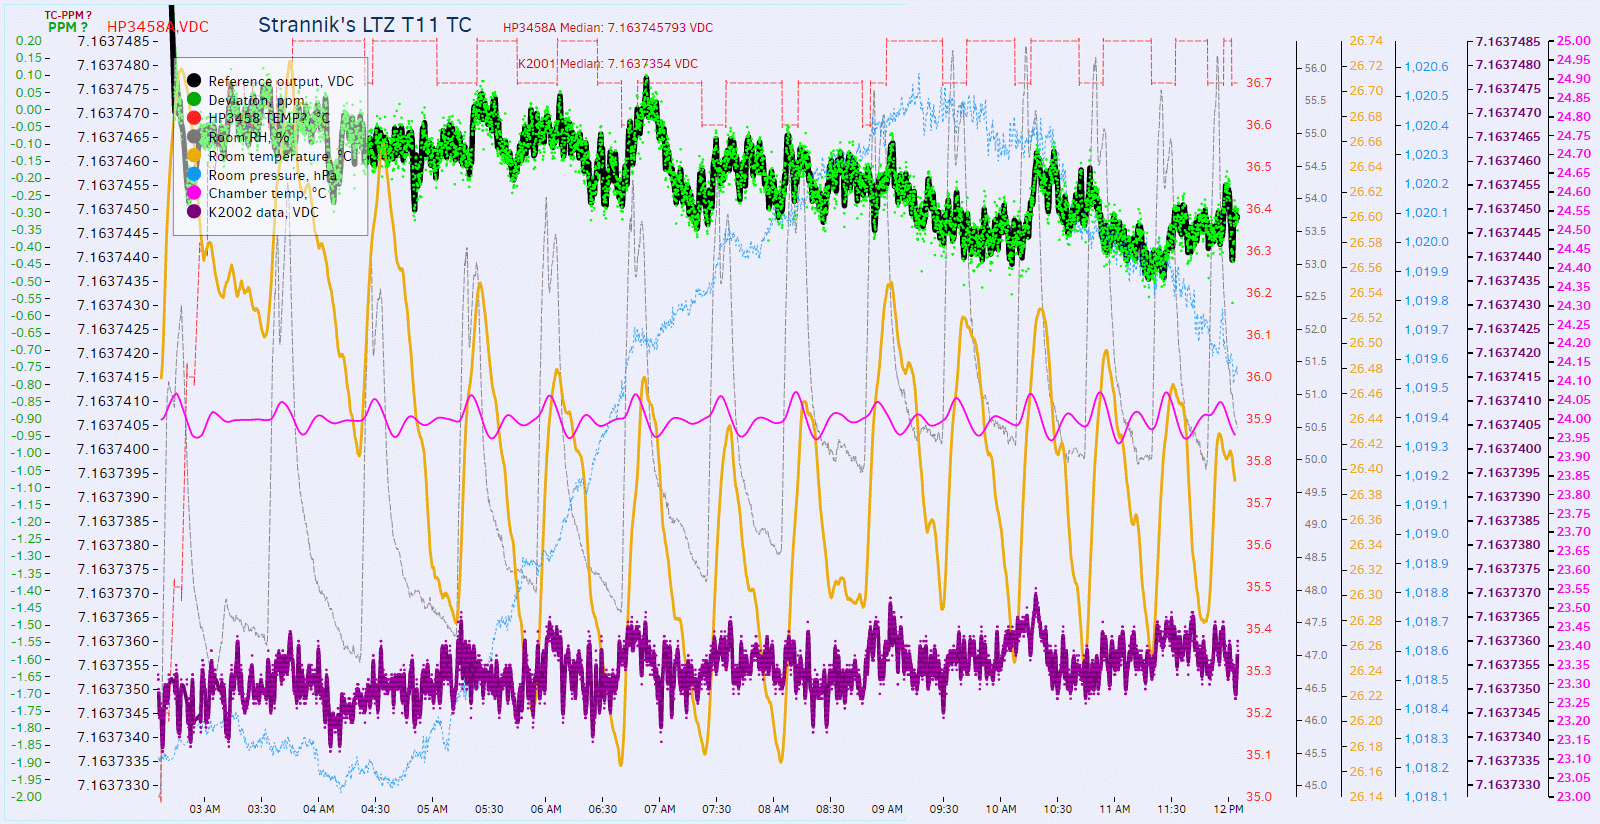
Image 26: Datalog over GPIB measuring LTZ reference with new A5 board
Reading is within ±0.2ppm from original value, prior to A5 board swap.
Since I already installed this fresh A5 in my good meter, I decided to keep it there, so no other hidden issues would arise, while this second sick 3458A will get it’s old A5. There is no functional difference, as both boards running now same Rev.9 firmware.
Day 3 diagnostics, A2 board
As high voltage AC path has incorrect reading, let’s check input HV AC attenuator operation. Schematics fragment from CLIP will be a great help on this.

Image 27: Schematics of A2 input AC stage with marked HV path
First suspects are U201, which is DG211 analog switch, low leakage protection JFETs and zeners Q202,Q203,CR203,CR204 and attenuation network resistors R204,R205,R206,R207,R208,R209.
Day 4, A3 reference measurements
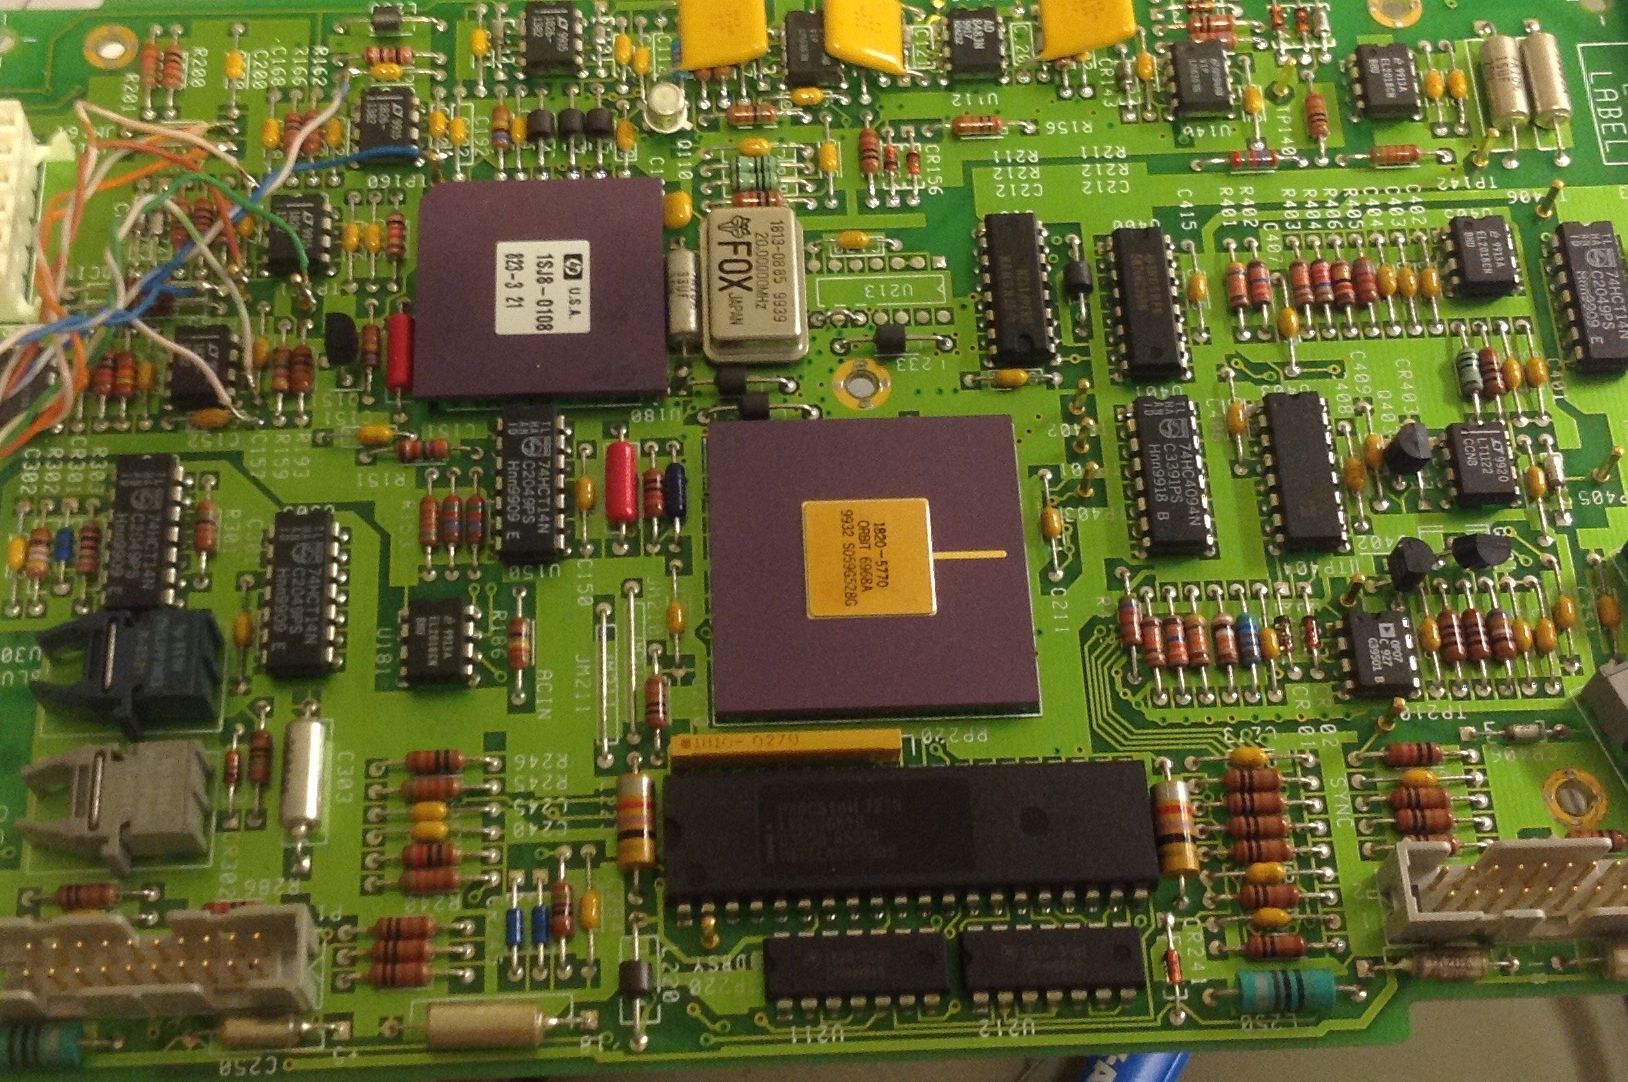
Image 28: Test points connection for reference voltage monitoring
Measurement of ADC references, which are derived by Linear LT1001 opamps and resistor network inside custom HP ASIC U180, which is famous for main cause of A/D failures and excessive drift.
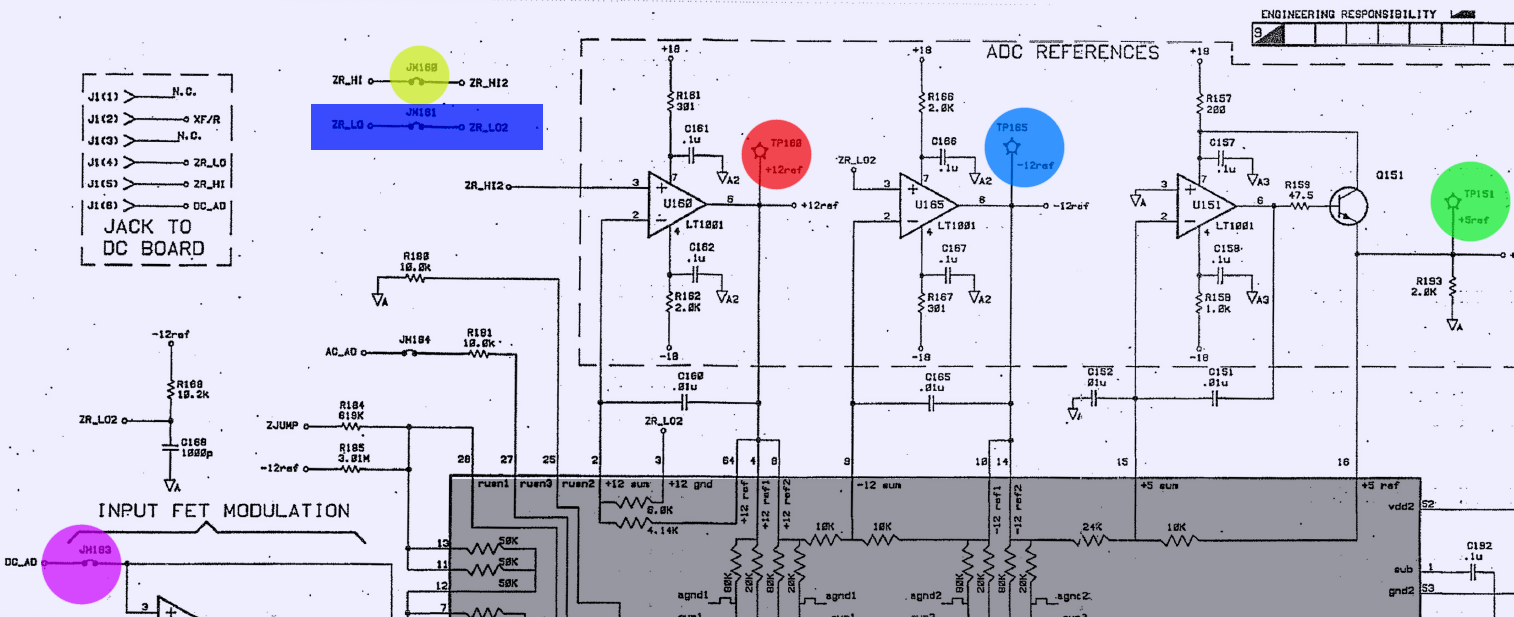
Image 29: A3 Reference blocks schematics
Here’s result taken by Keithley 2002 with scanner card and F732B as 10V cross-check reference.
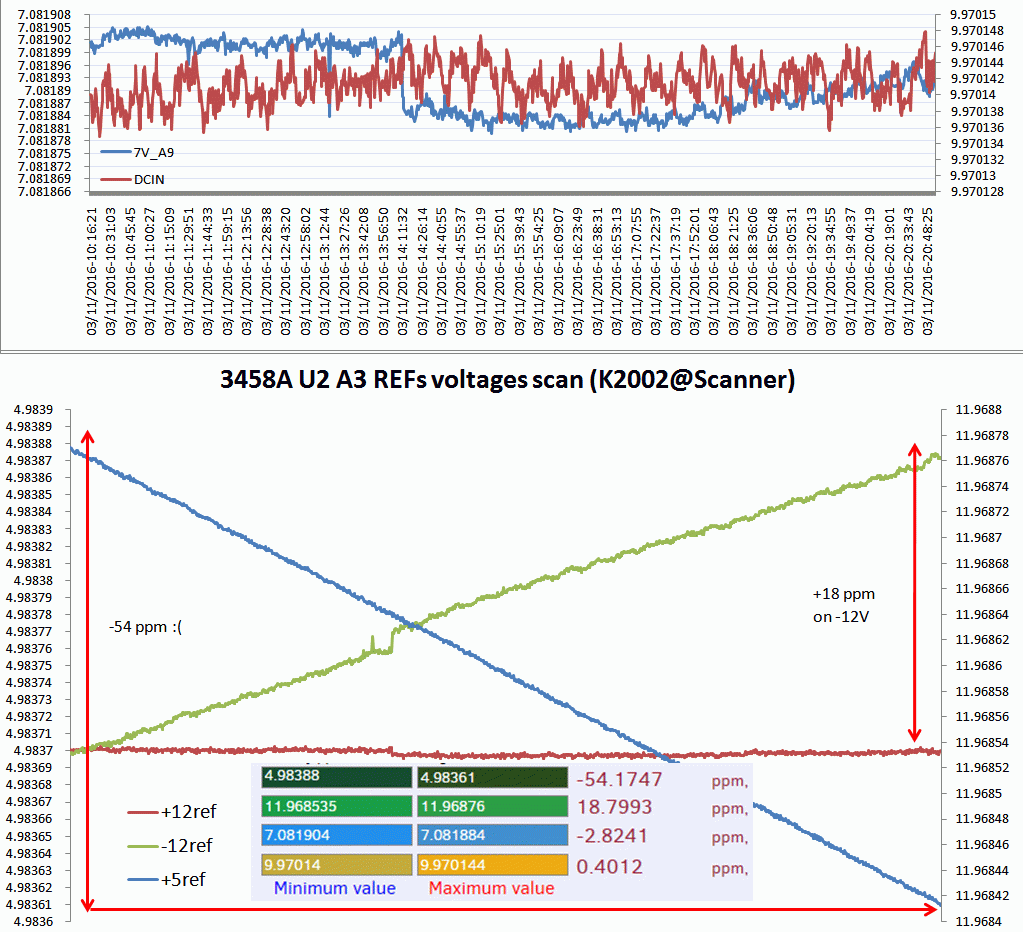
Image 30: Unstable reference voltages with large drift
No need further comments, U180 is dead. These +5, -12, +12 should be fixed ratio of main 7V output of LTZ1000A module A9, but due to bad resistors inside U180 hybrid, we can see large drifts over just few hours of time.
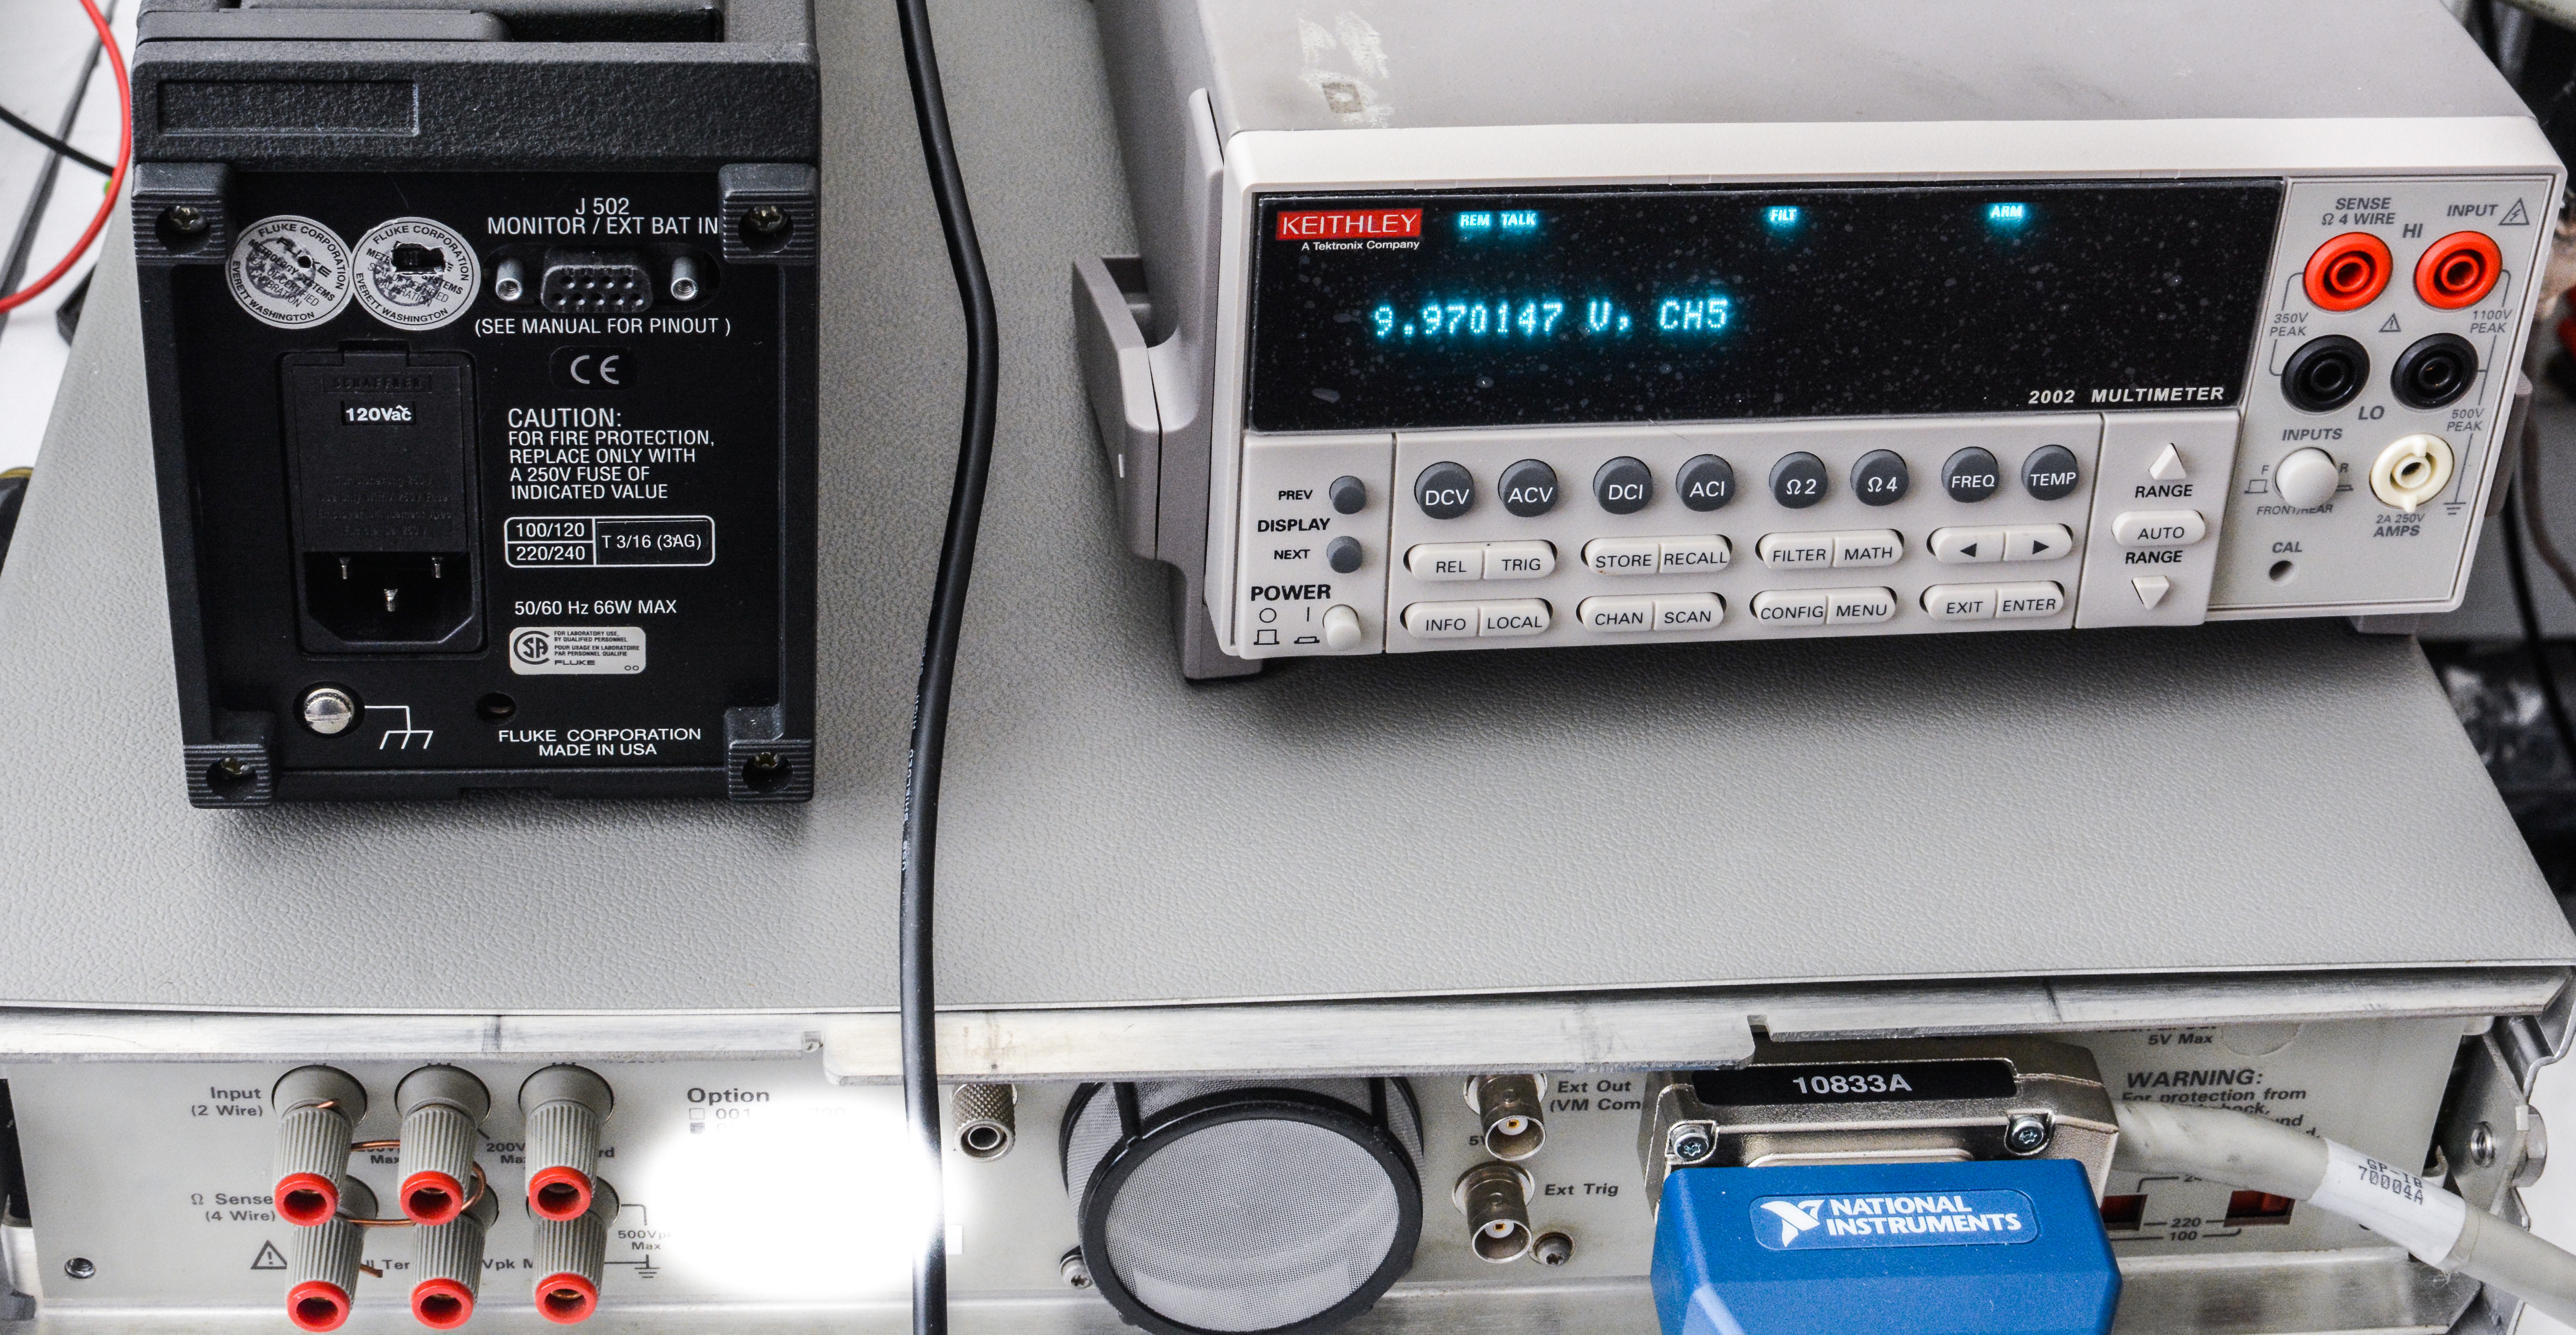
Image 31: Used Keithley 2002 with Fluke 732B (rear shown) standard
Also few extra photos were taken.

Image 32: Top side showing A1 PCBA
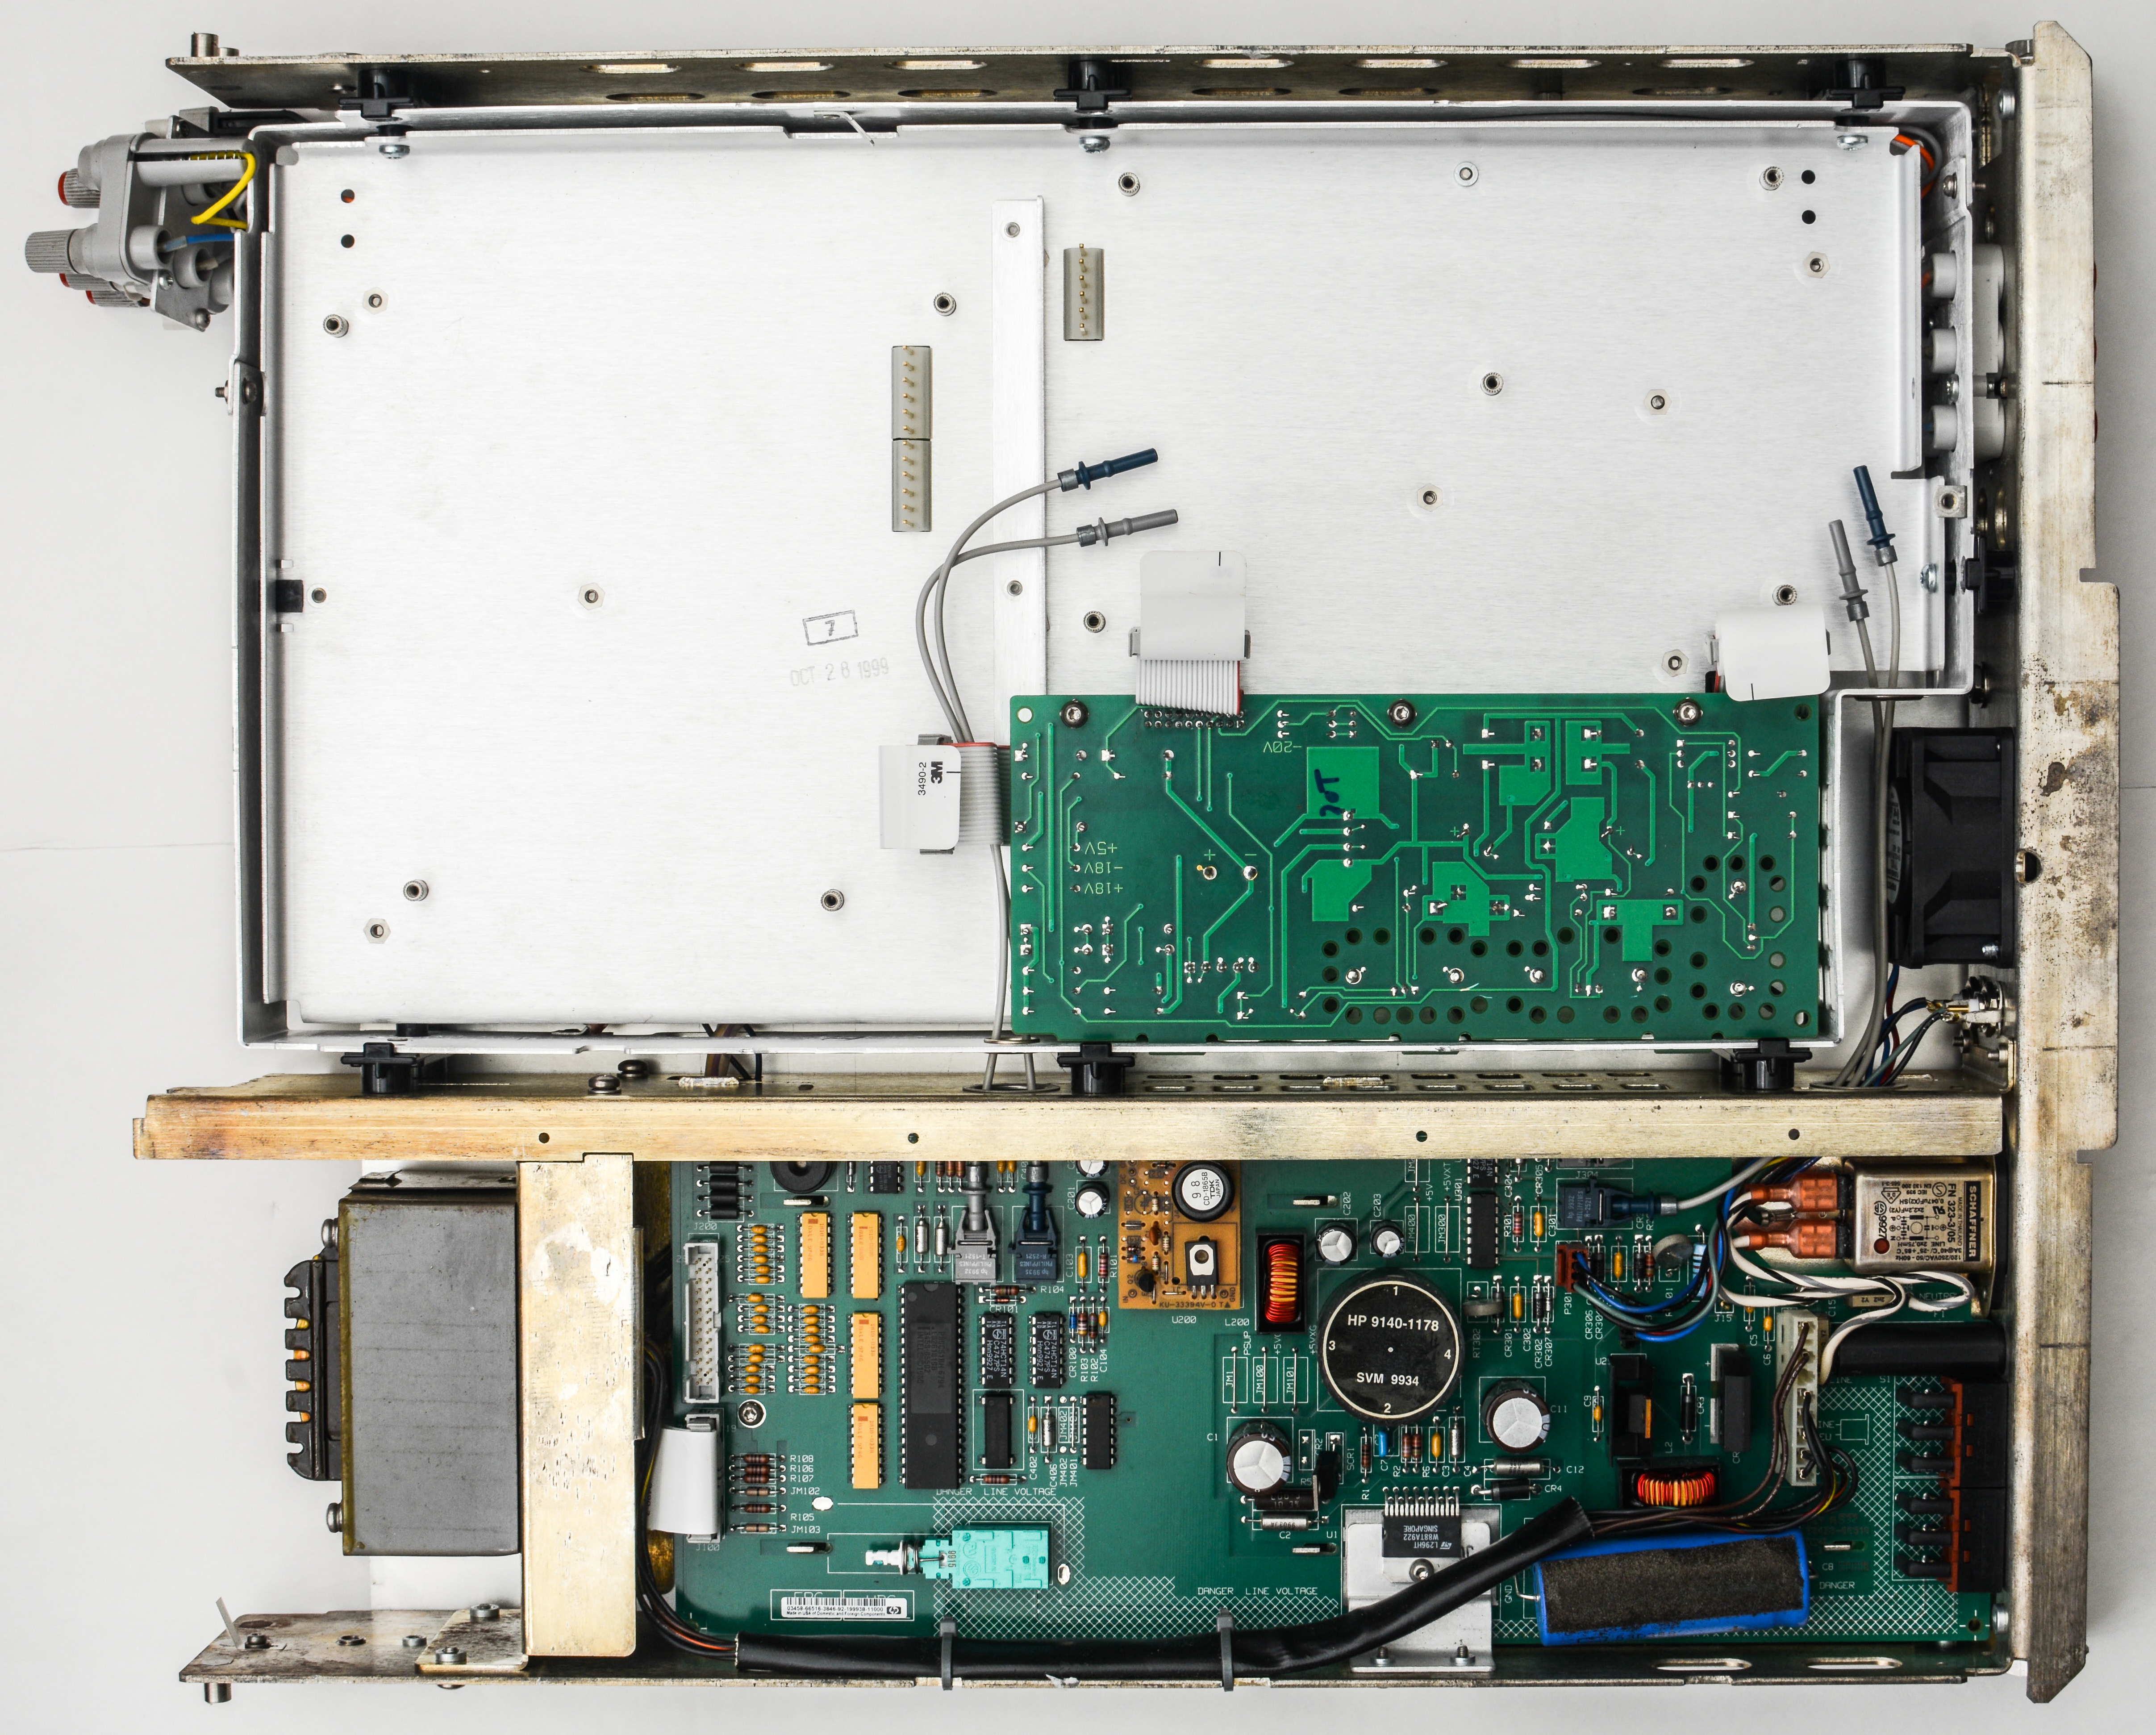
Image 33: Side showing A6 and A4 PCBA
A4 PCBA:
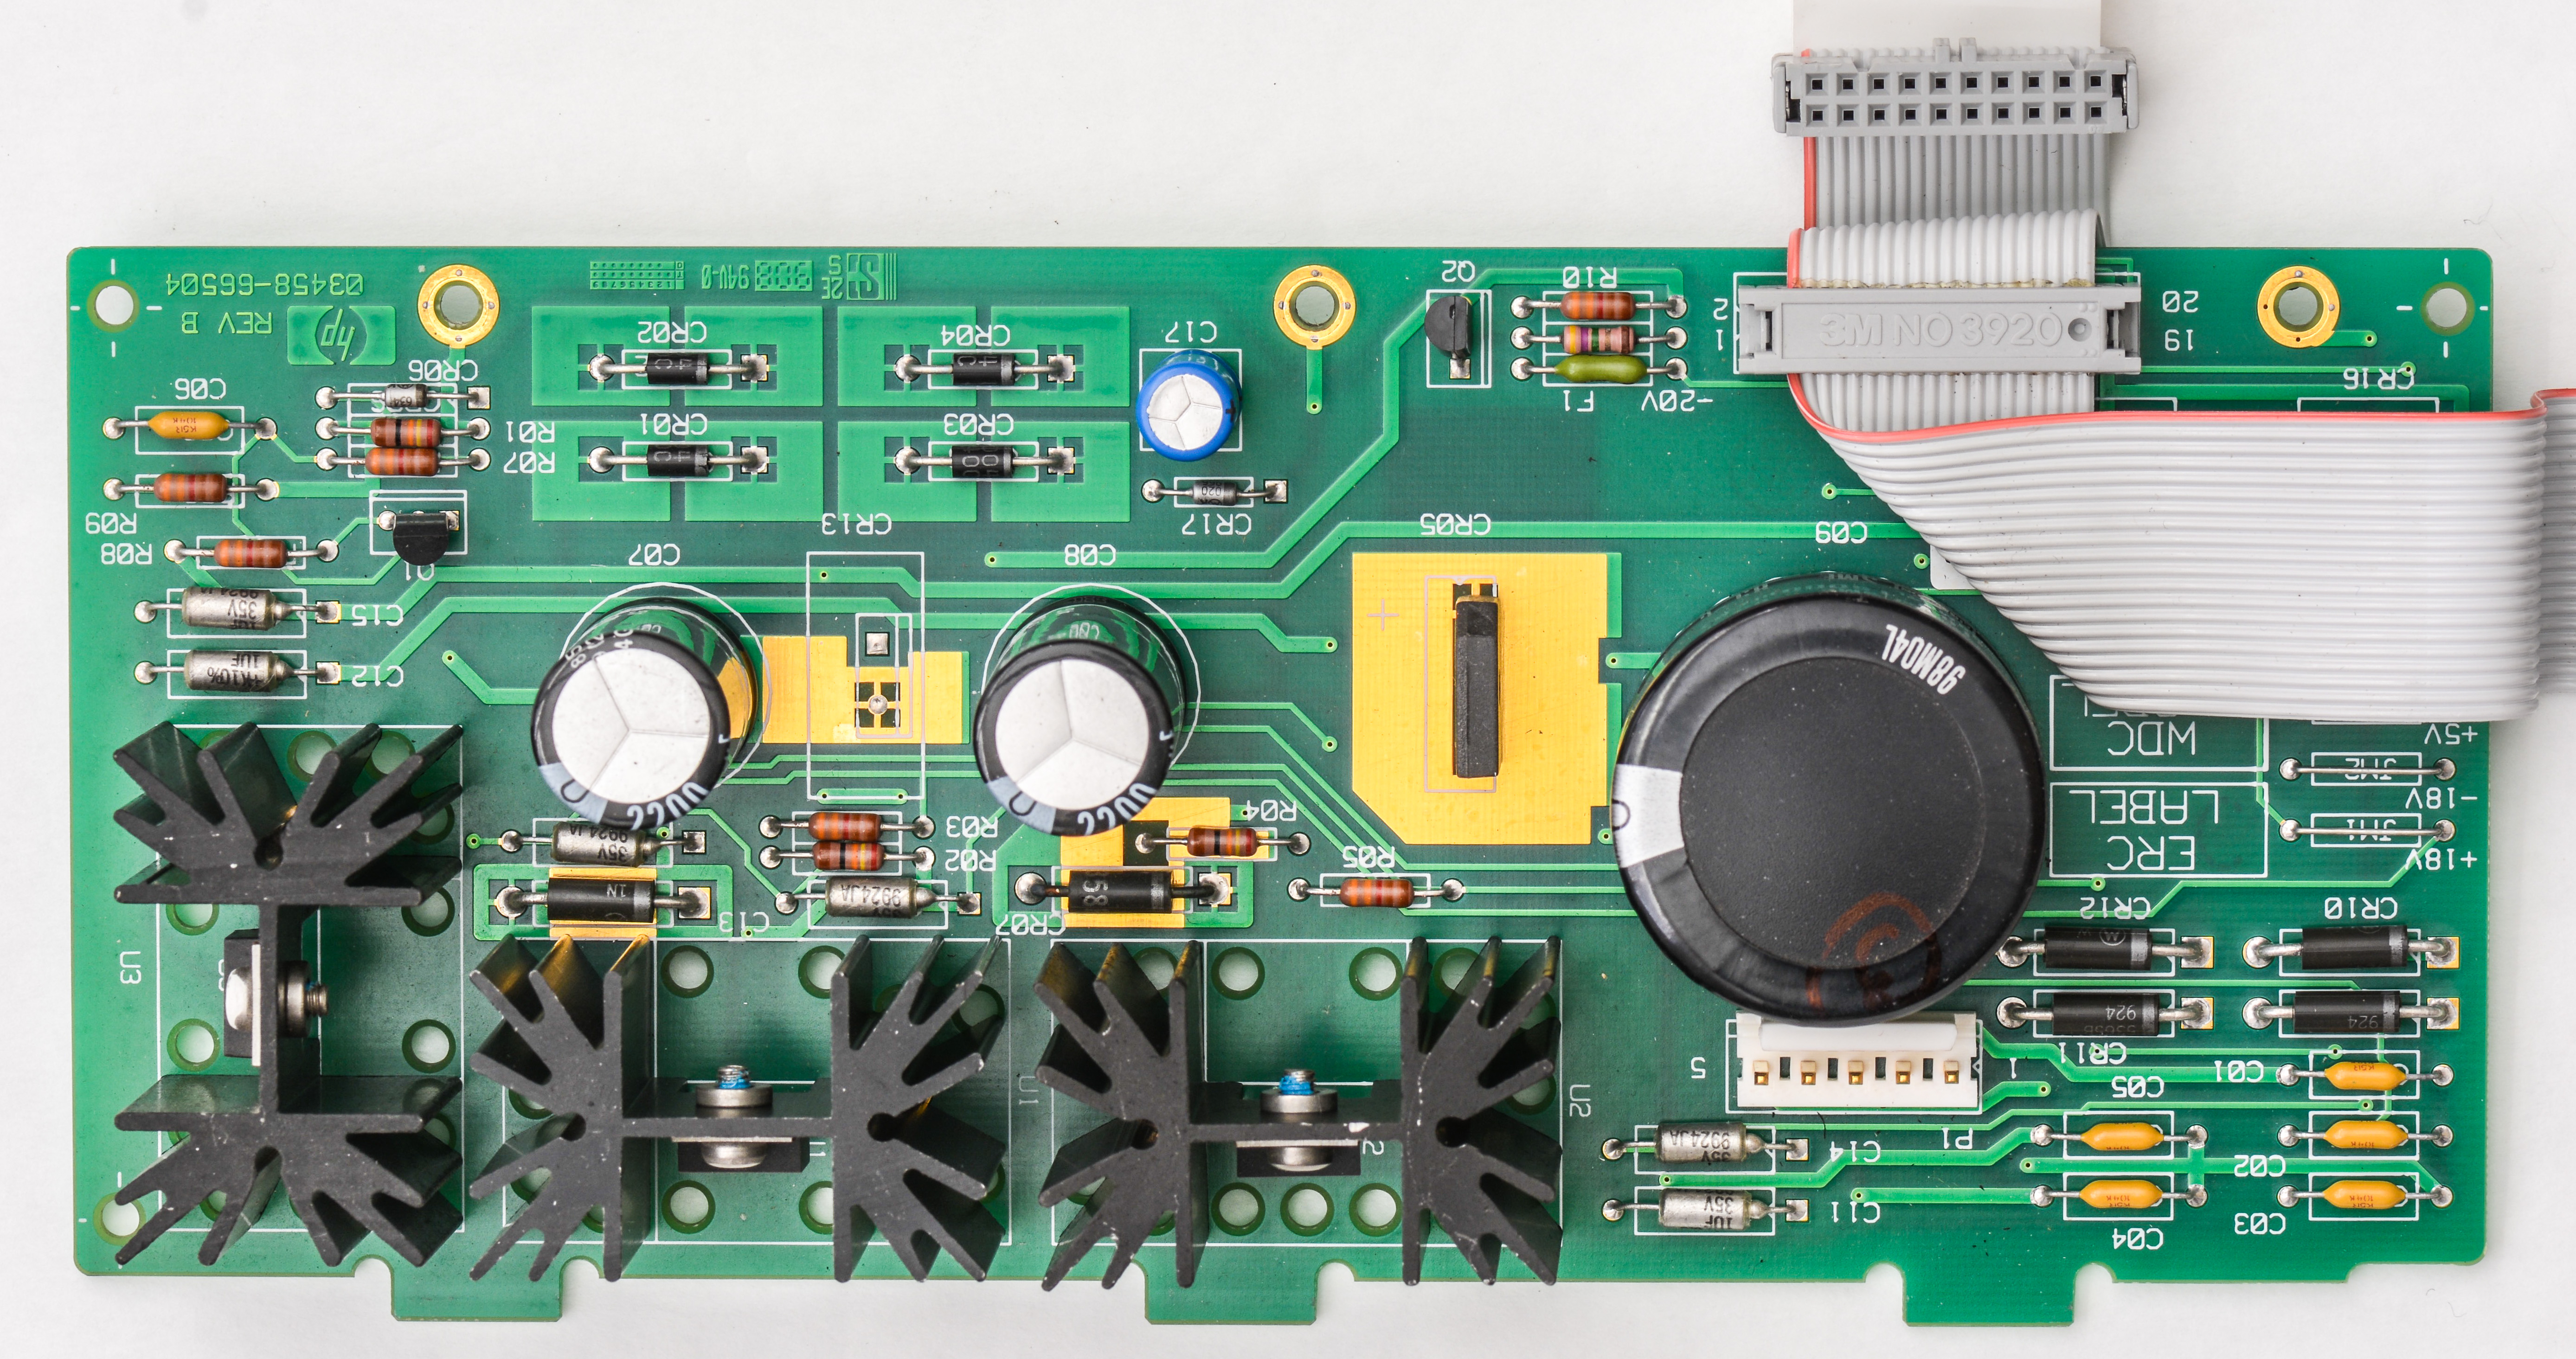

Image 34-35: A4 inguard-power supply board
Now we need to repeat all that “find-good-A3” quest once again. Anyone still believe it’s possible to get good working 3458A on eBay under 3000-4000$ USD? Cost of A/D PCBA from Keysight service center is around $1300 USD, if reminder is required.
Day 5, A1 Test with good A2 and A3 boards
This board have later upgraded 40.000 KΩ reference resistor, R207 with Vishay VHP101 mark on it, so it’s expected to have less than ±0.3ppm/°C TCR.
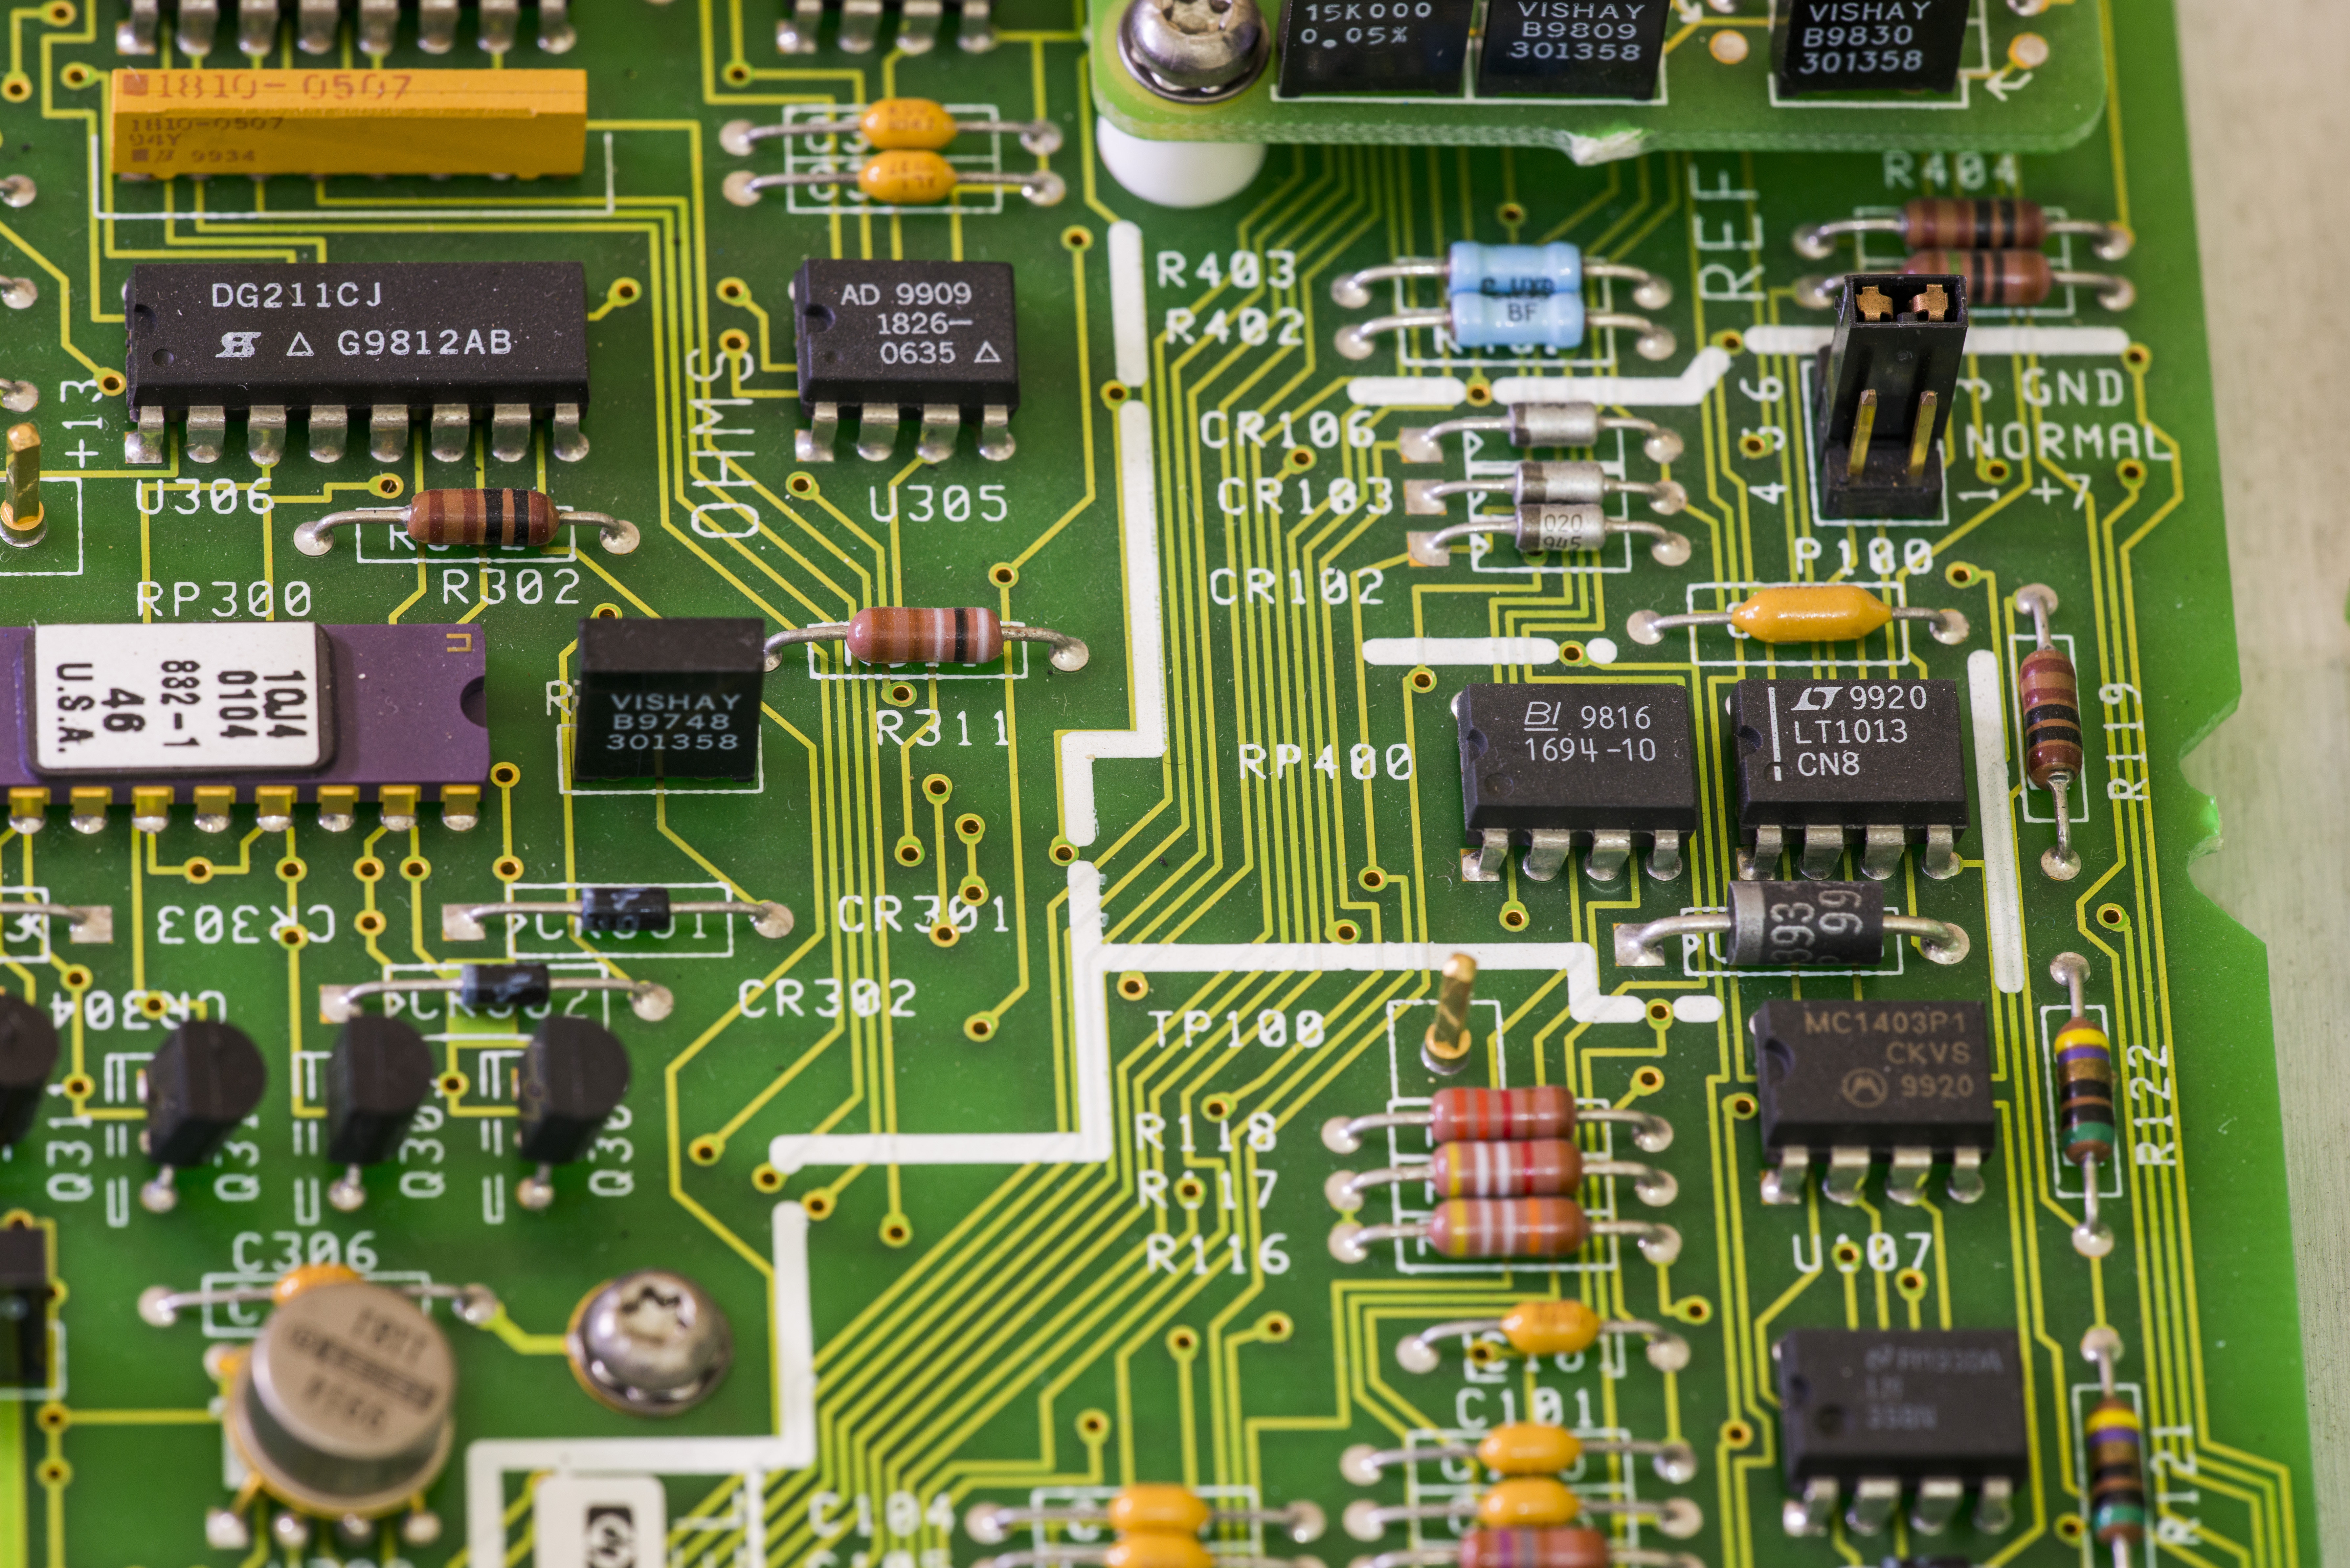
Image 36-38: A1 components
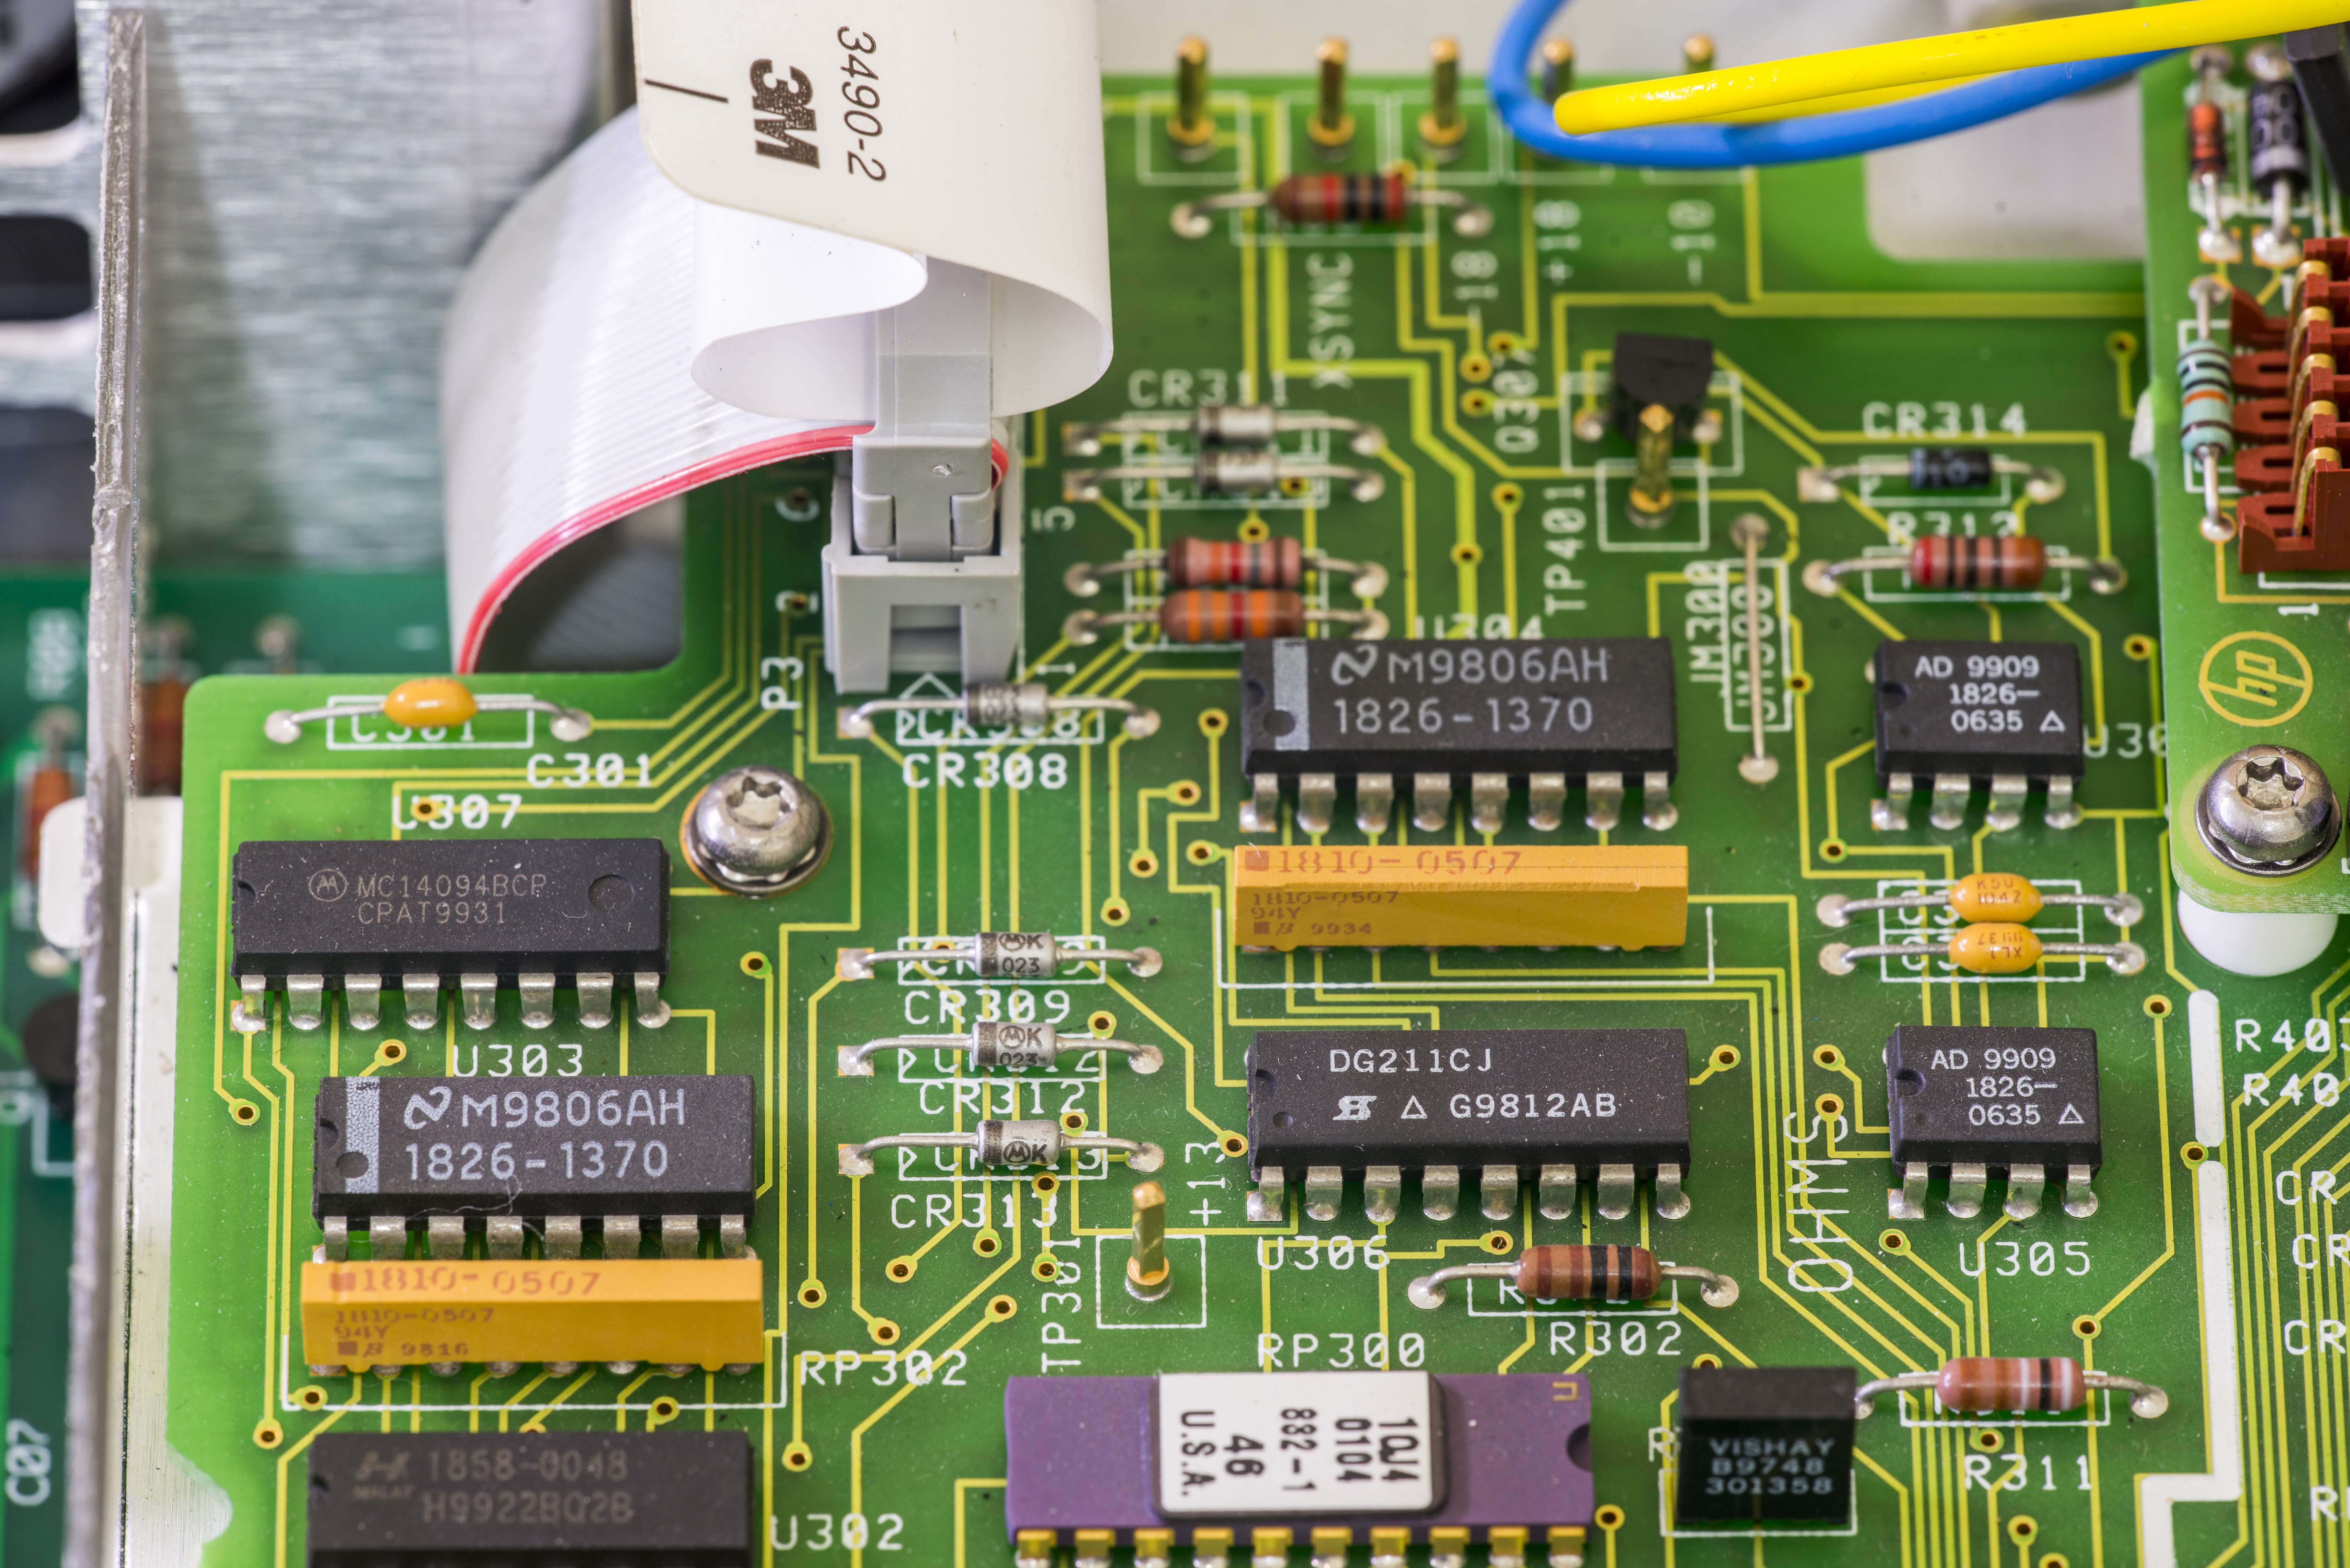
Image 39-41: A1 components
Image 42-44: A1 components, ohm protection
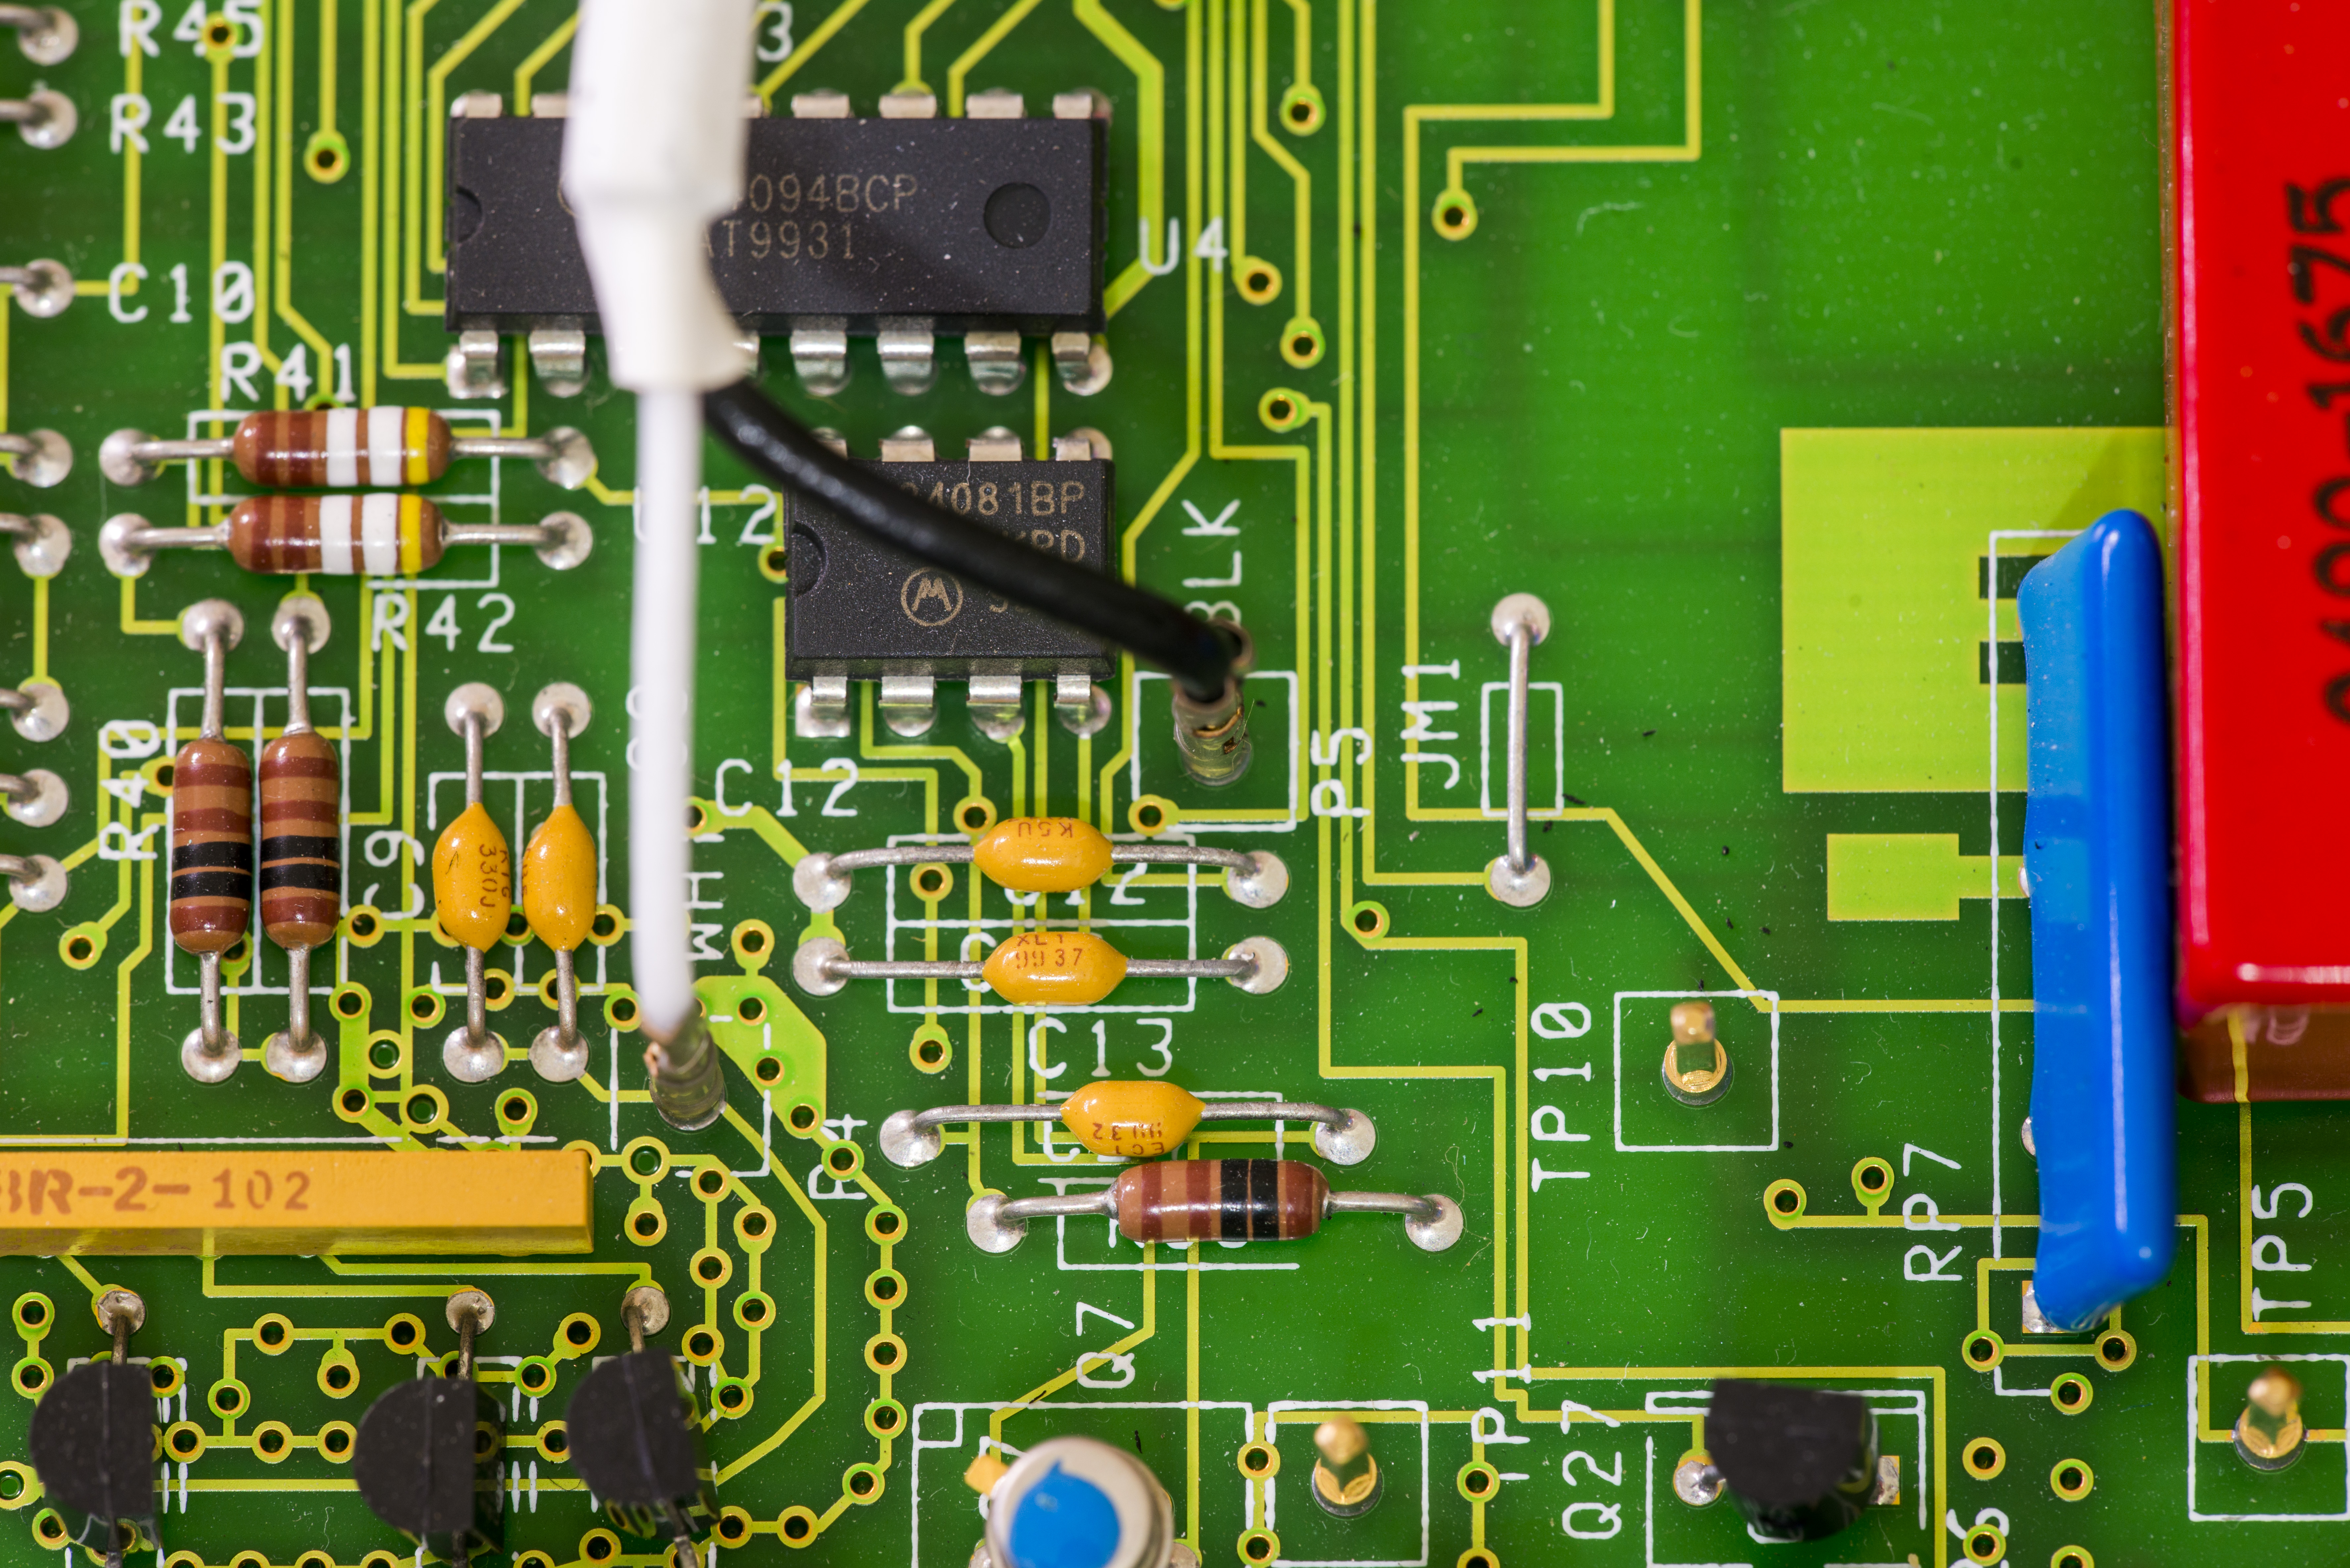
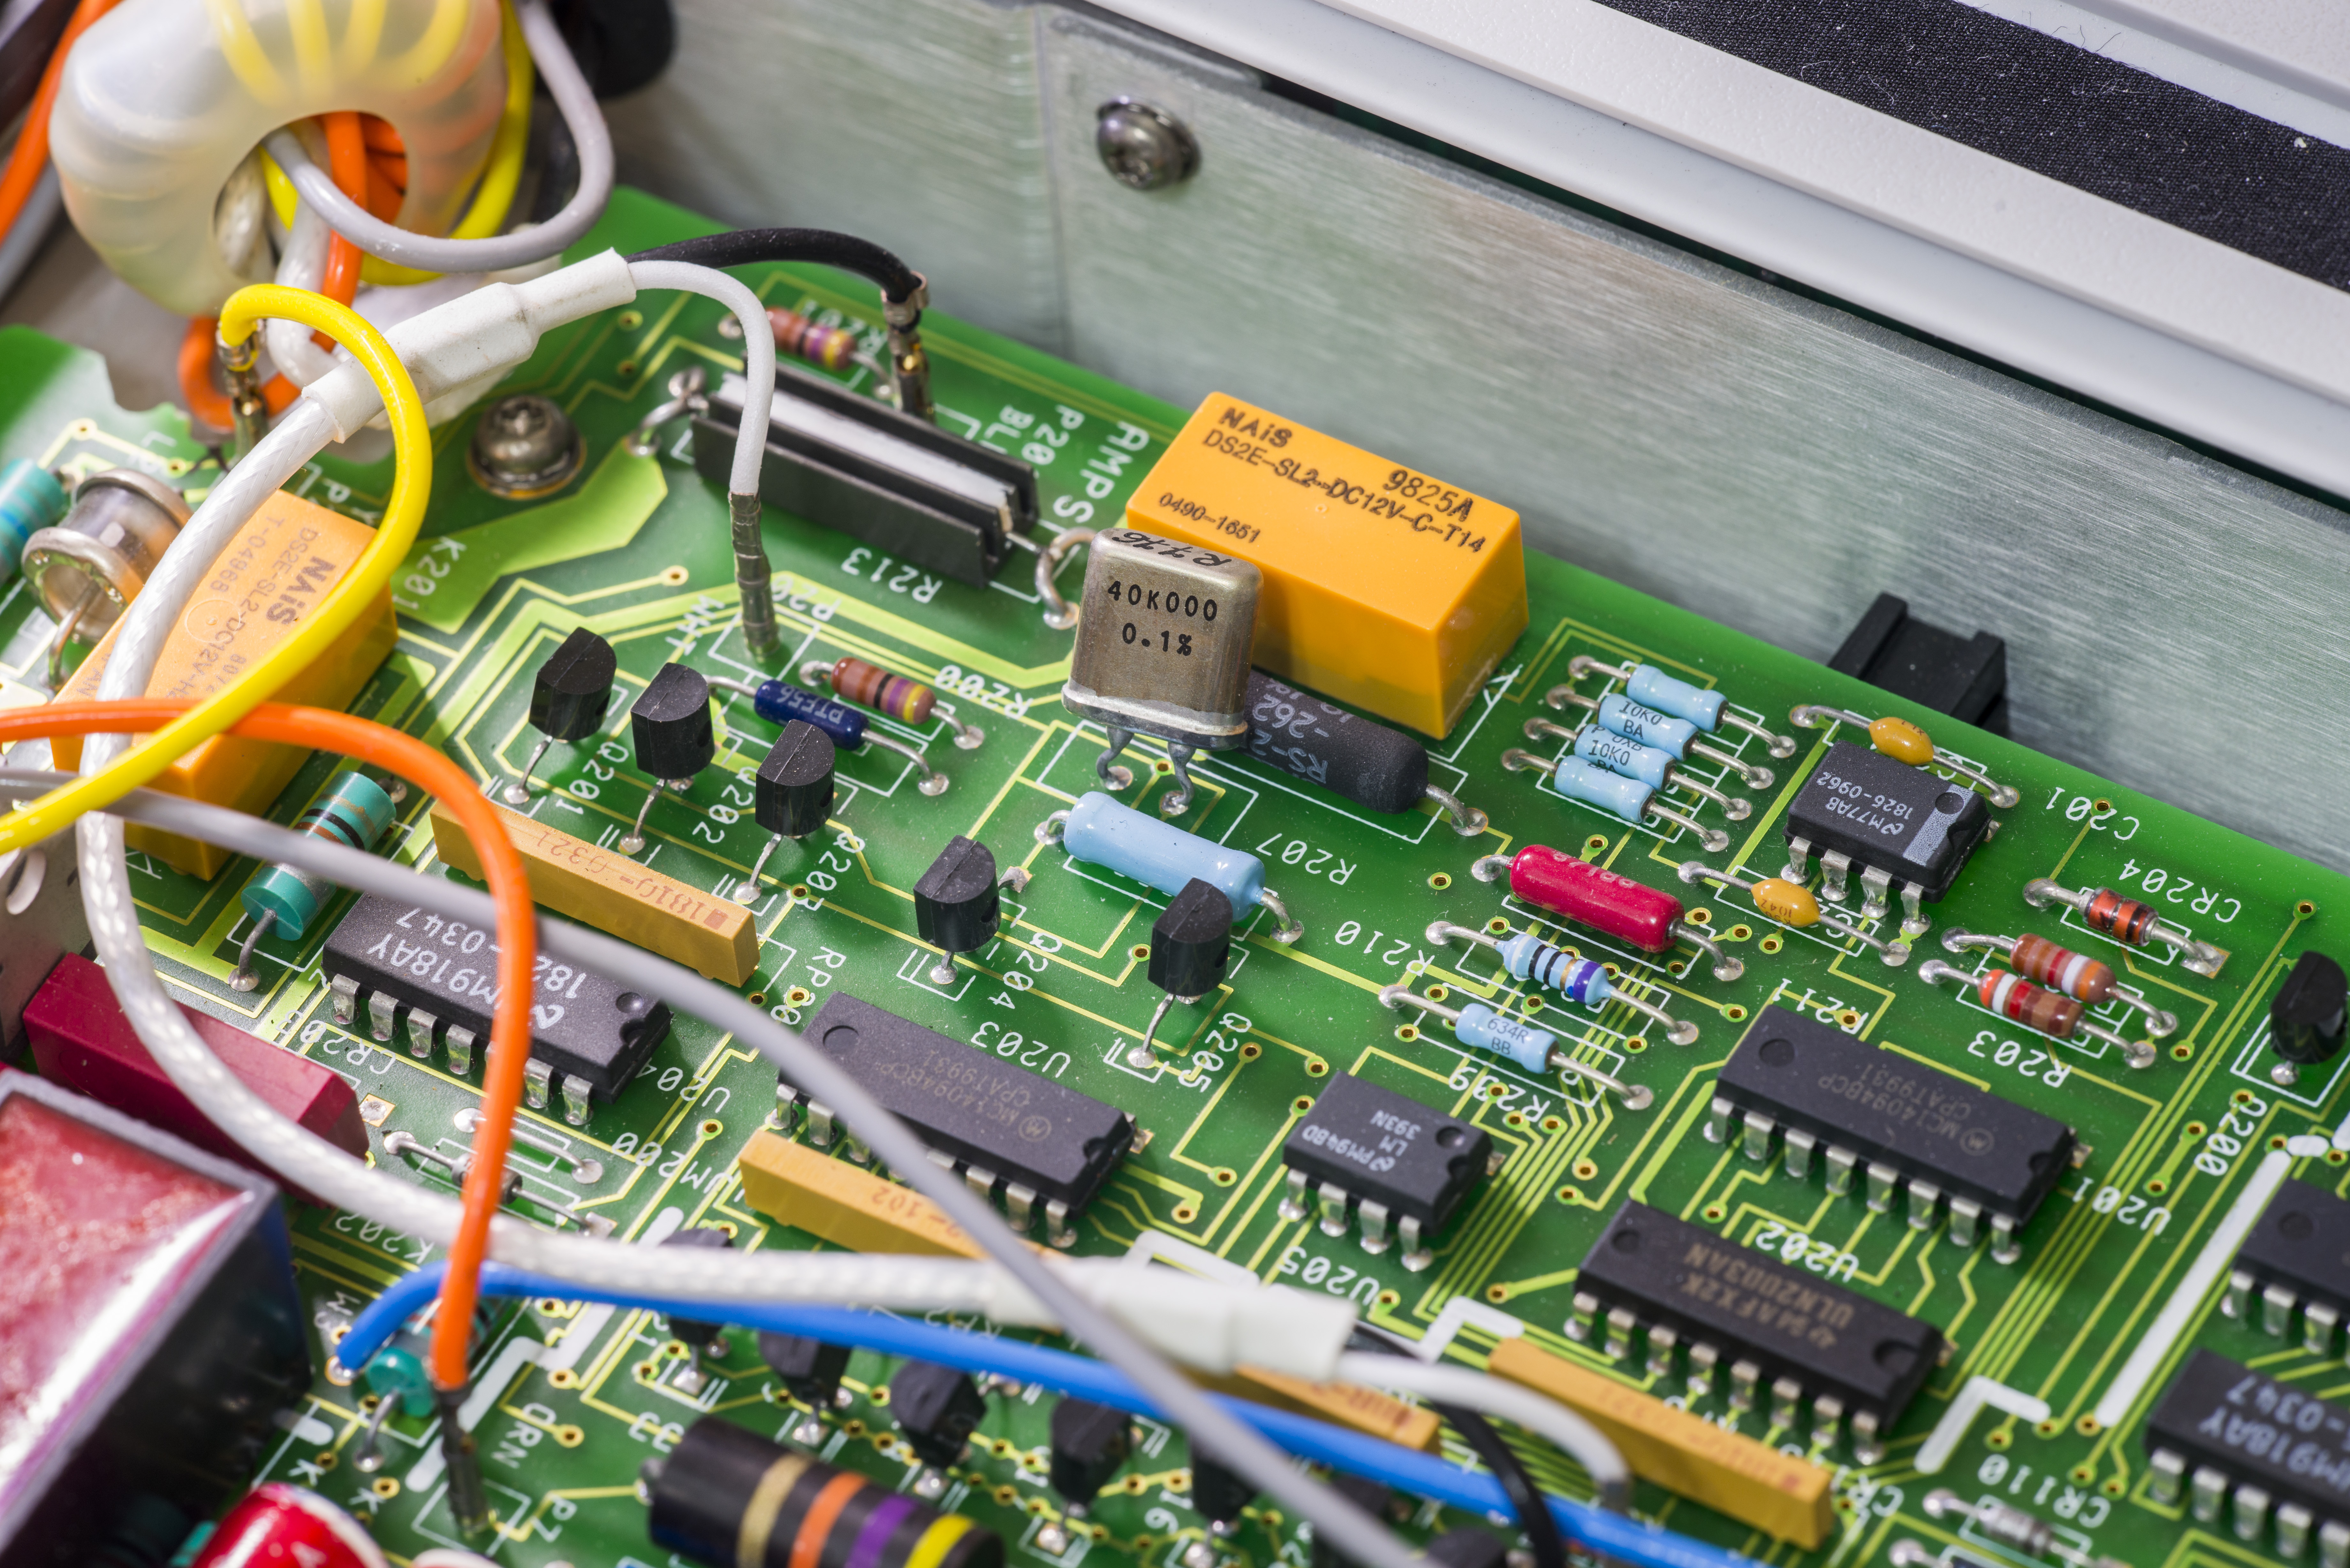
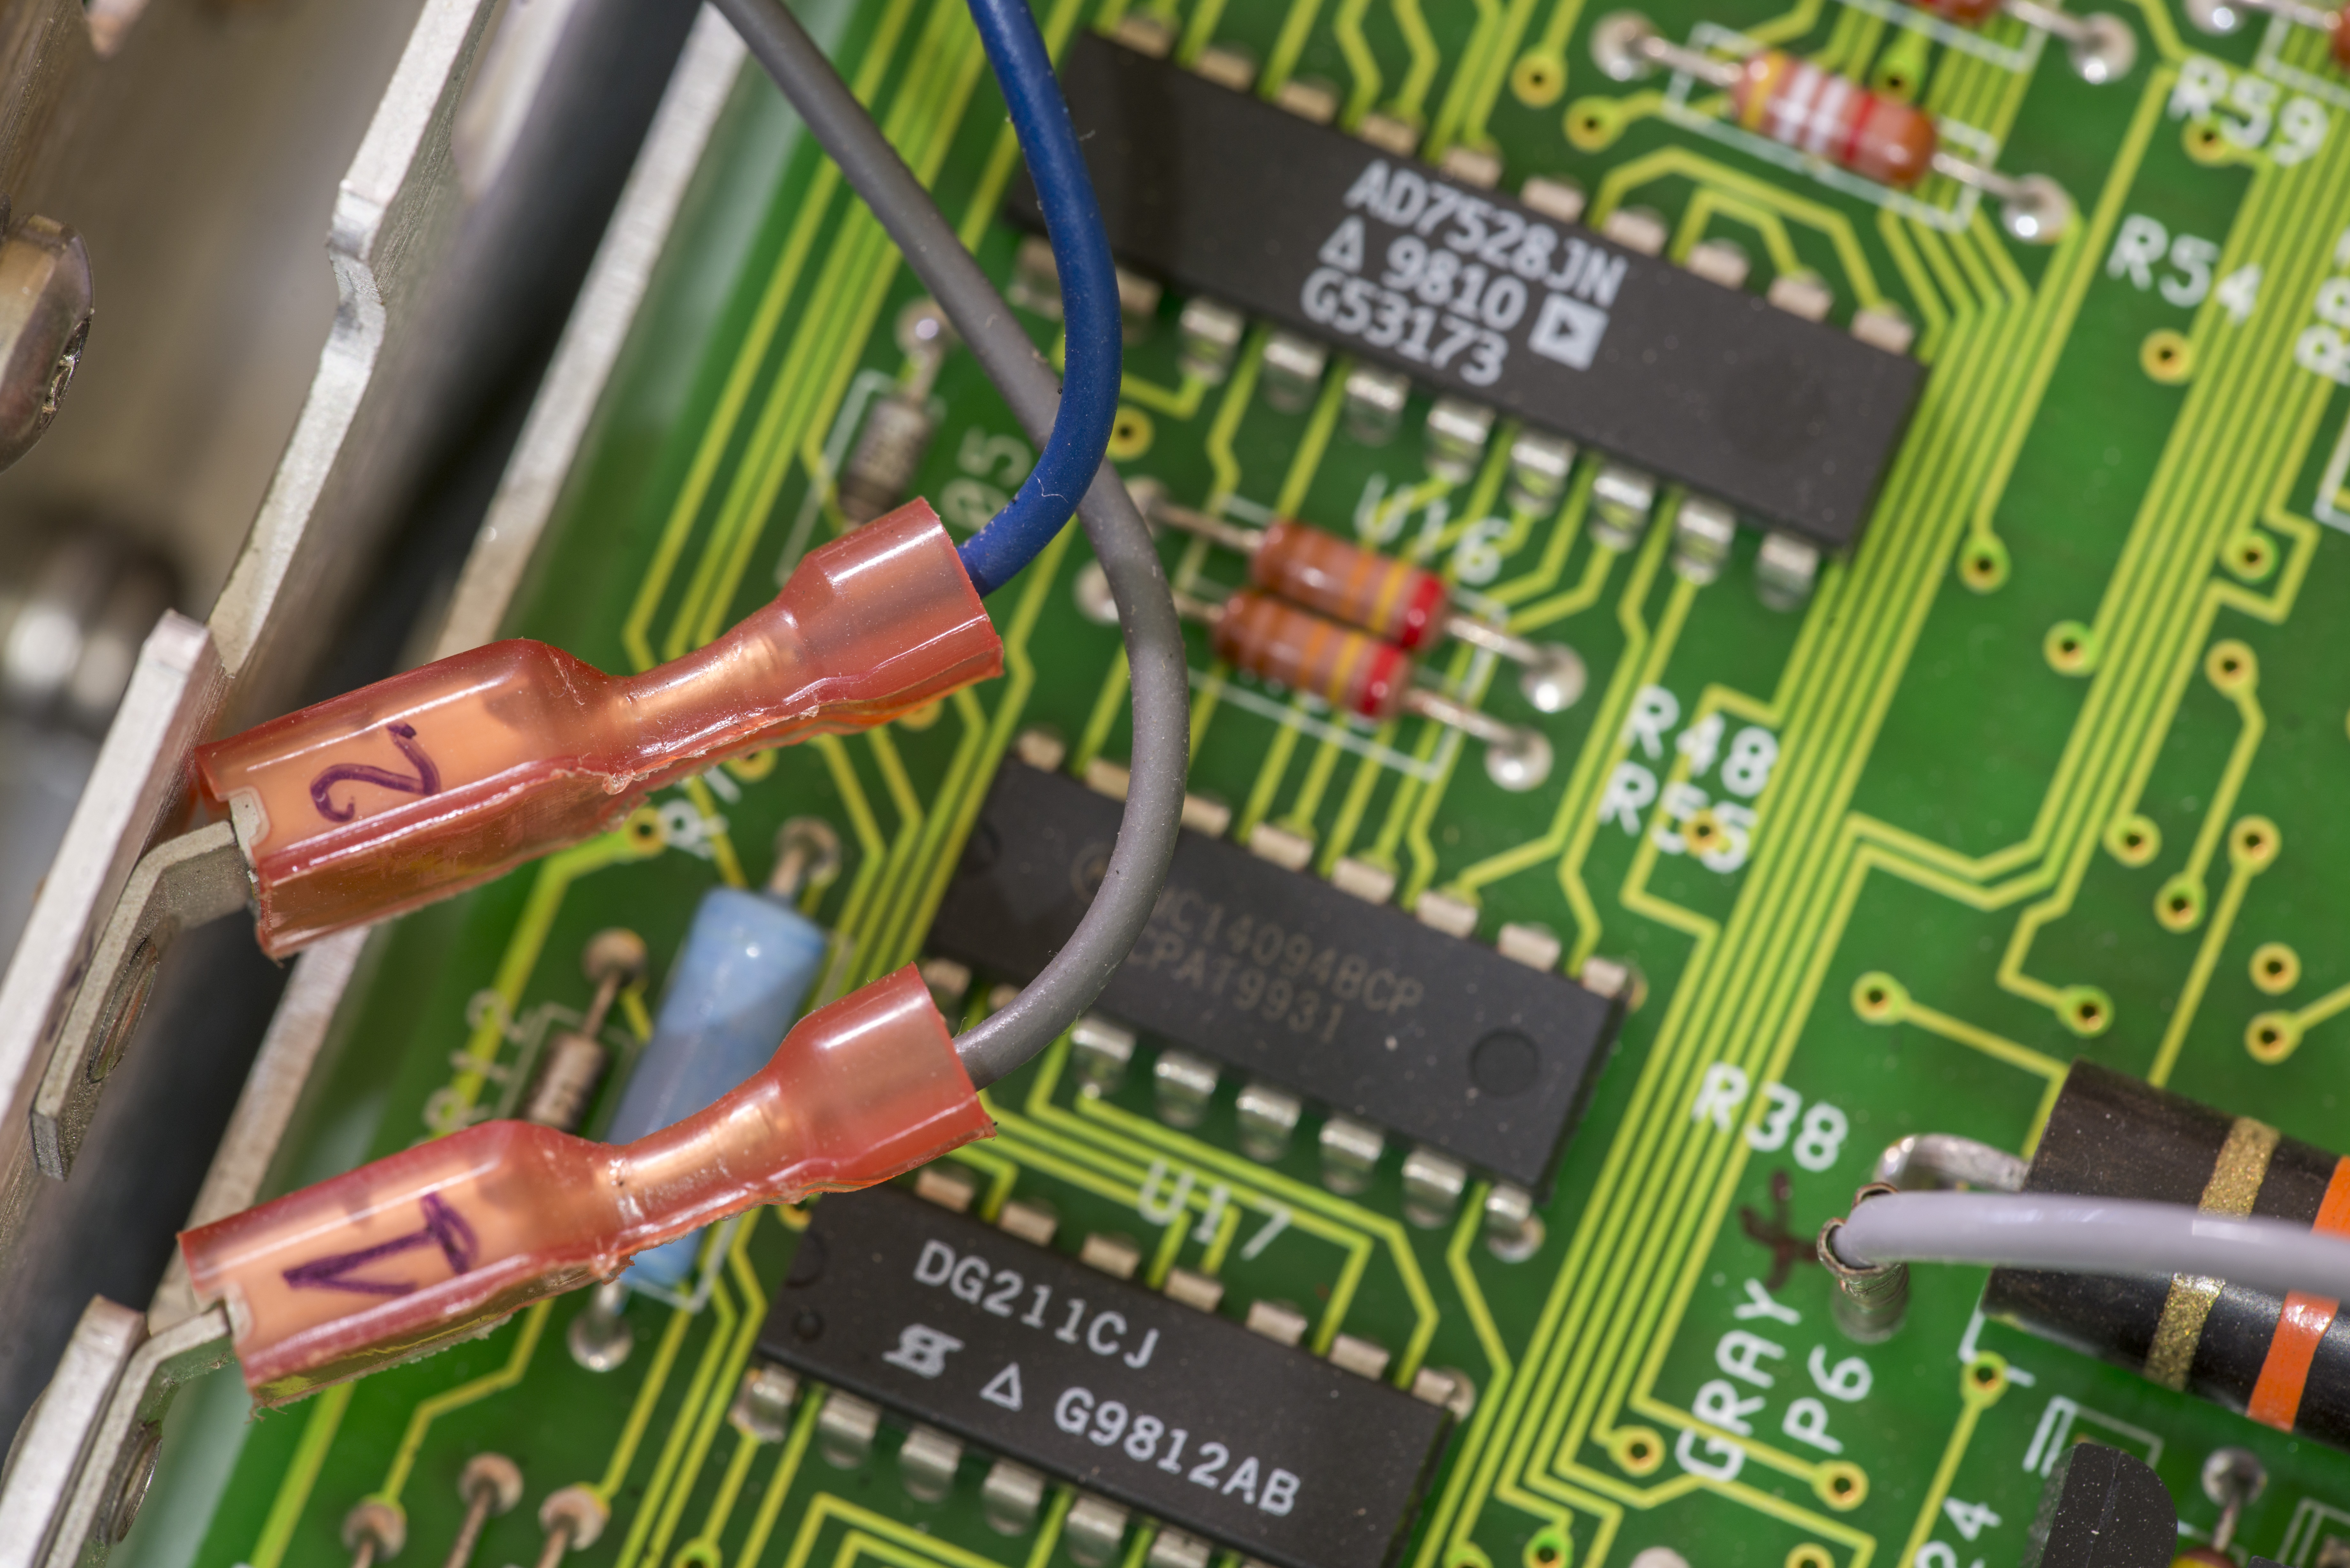
Image 45-47: A1 components, 40KΩ reference resistor and DCI shunts
To verify correct A1 DC board function faulty original AC Board (A2) and A/D Converter board (A3) were temporarily replaced by ones from good 3458A. This will help us to isolate any issues of A1, and by using verified A2/A3 guesswork is out.
And here we go with first test:
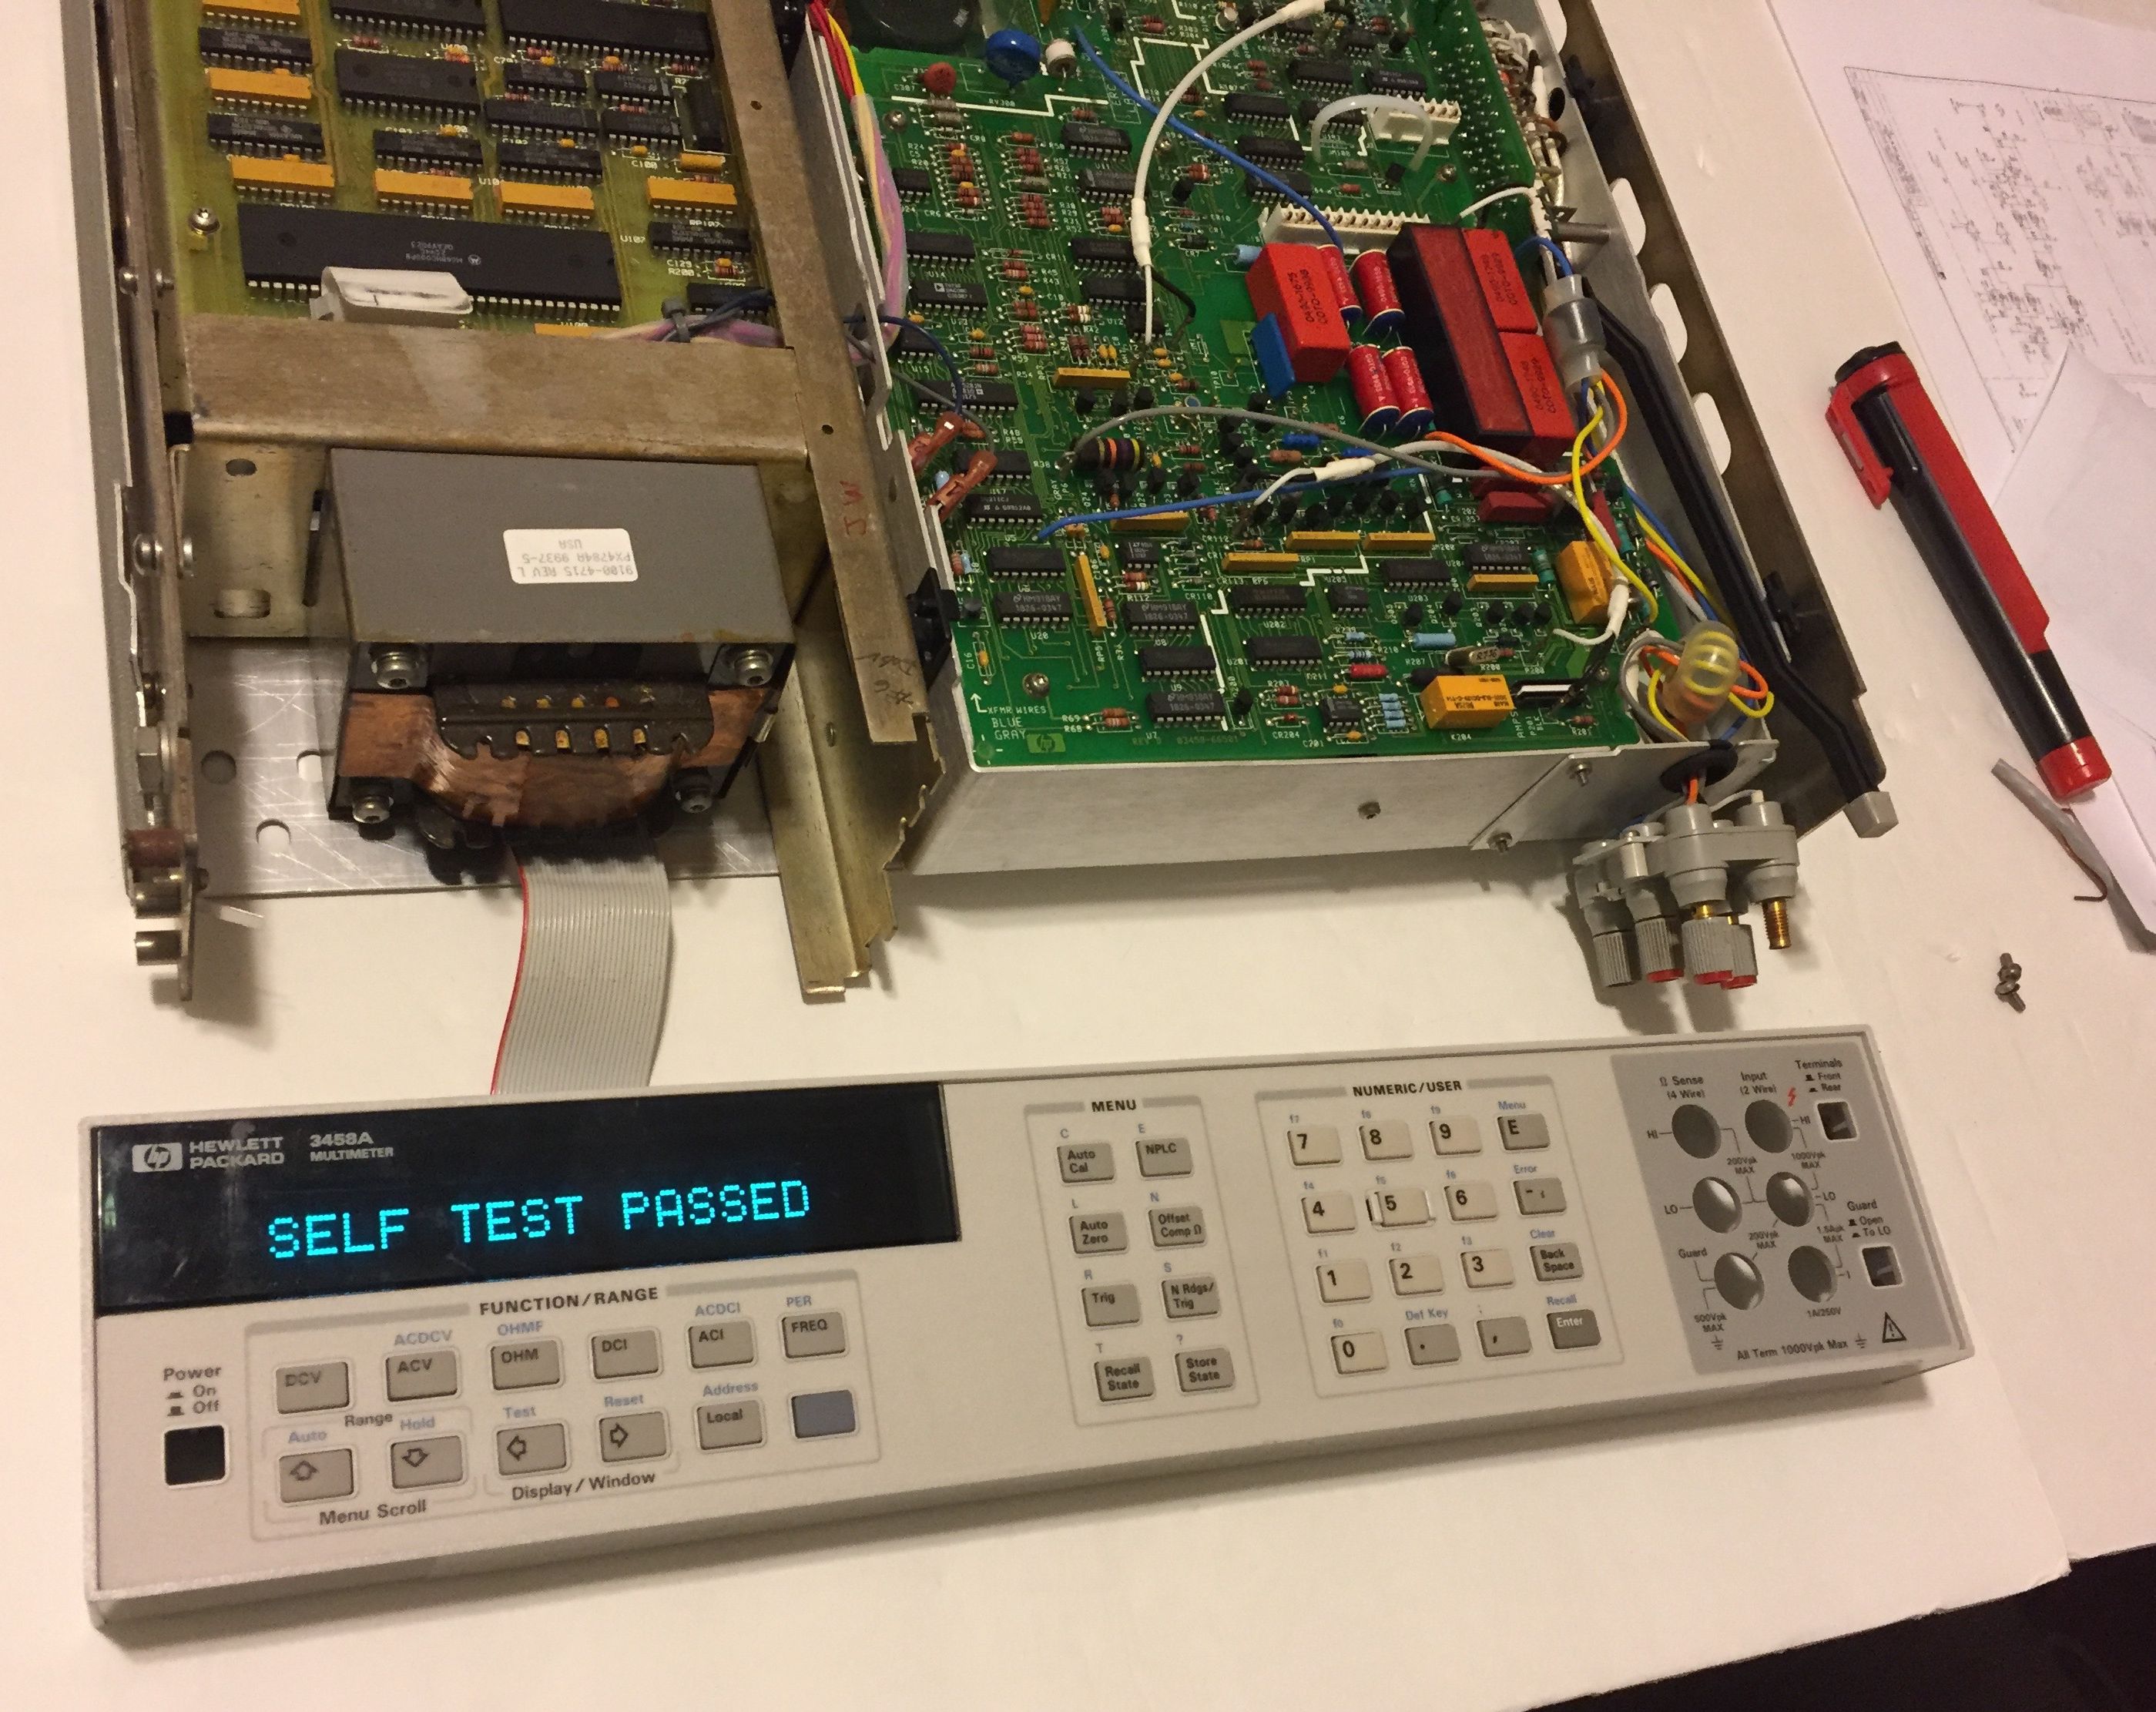
Image 48: Self-test pass with new A3 installed
Surprisingly it passed self-test just fine. Artifact calibration ACAL ALL also went OK, so there is high chance of good condition at least in A1 PCBA. Funny enough, I would rather prefer this board to be faulty than A3, as it’s relatively easy to fix, while with bad U180 hybrid not much we can do.
Next would be test stability of 10 VDC signal, to make sure it’s all good and stable, before making conclusions on A1.
Day 6-9: New A3 installation and initial tests
After several weeks of wait, brand new replacement A3 finally arrived. There are multiple revisions of A3 board assembly in 3458A units over its 28 years of lifetime.
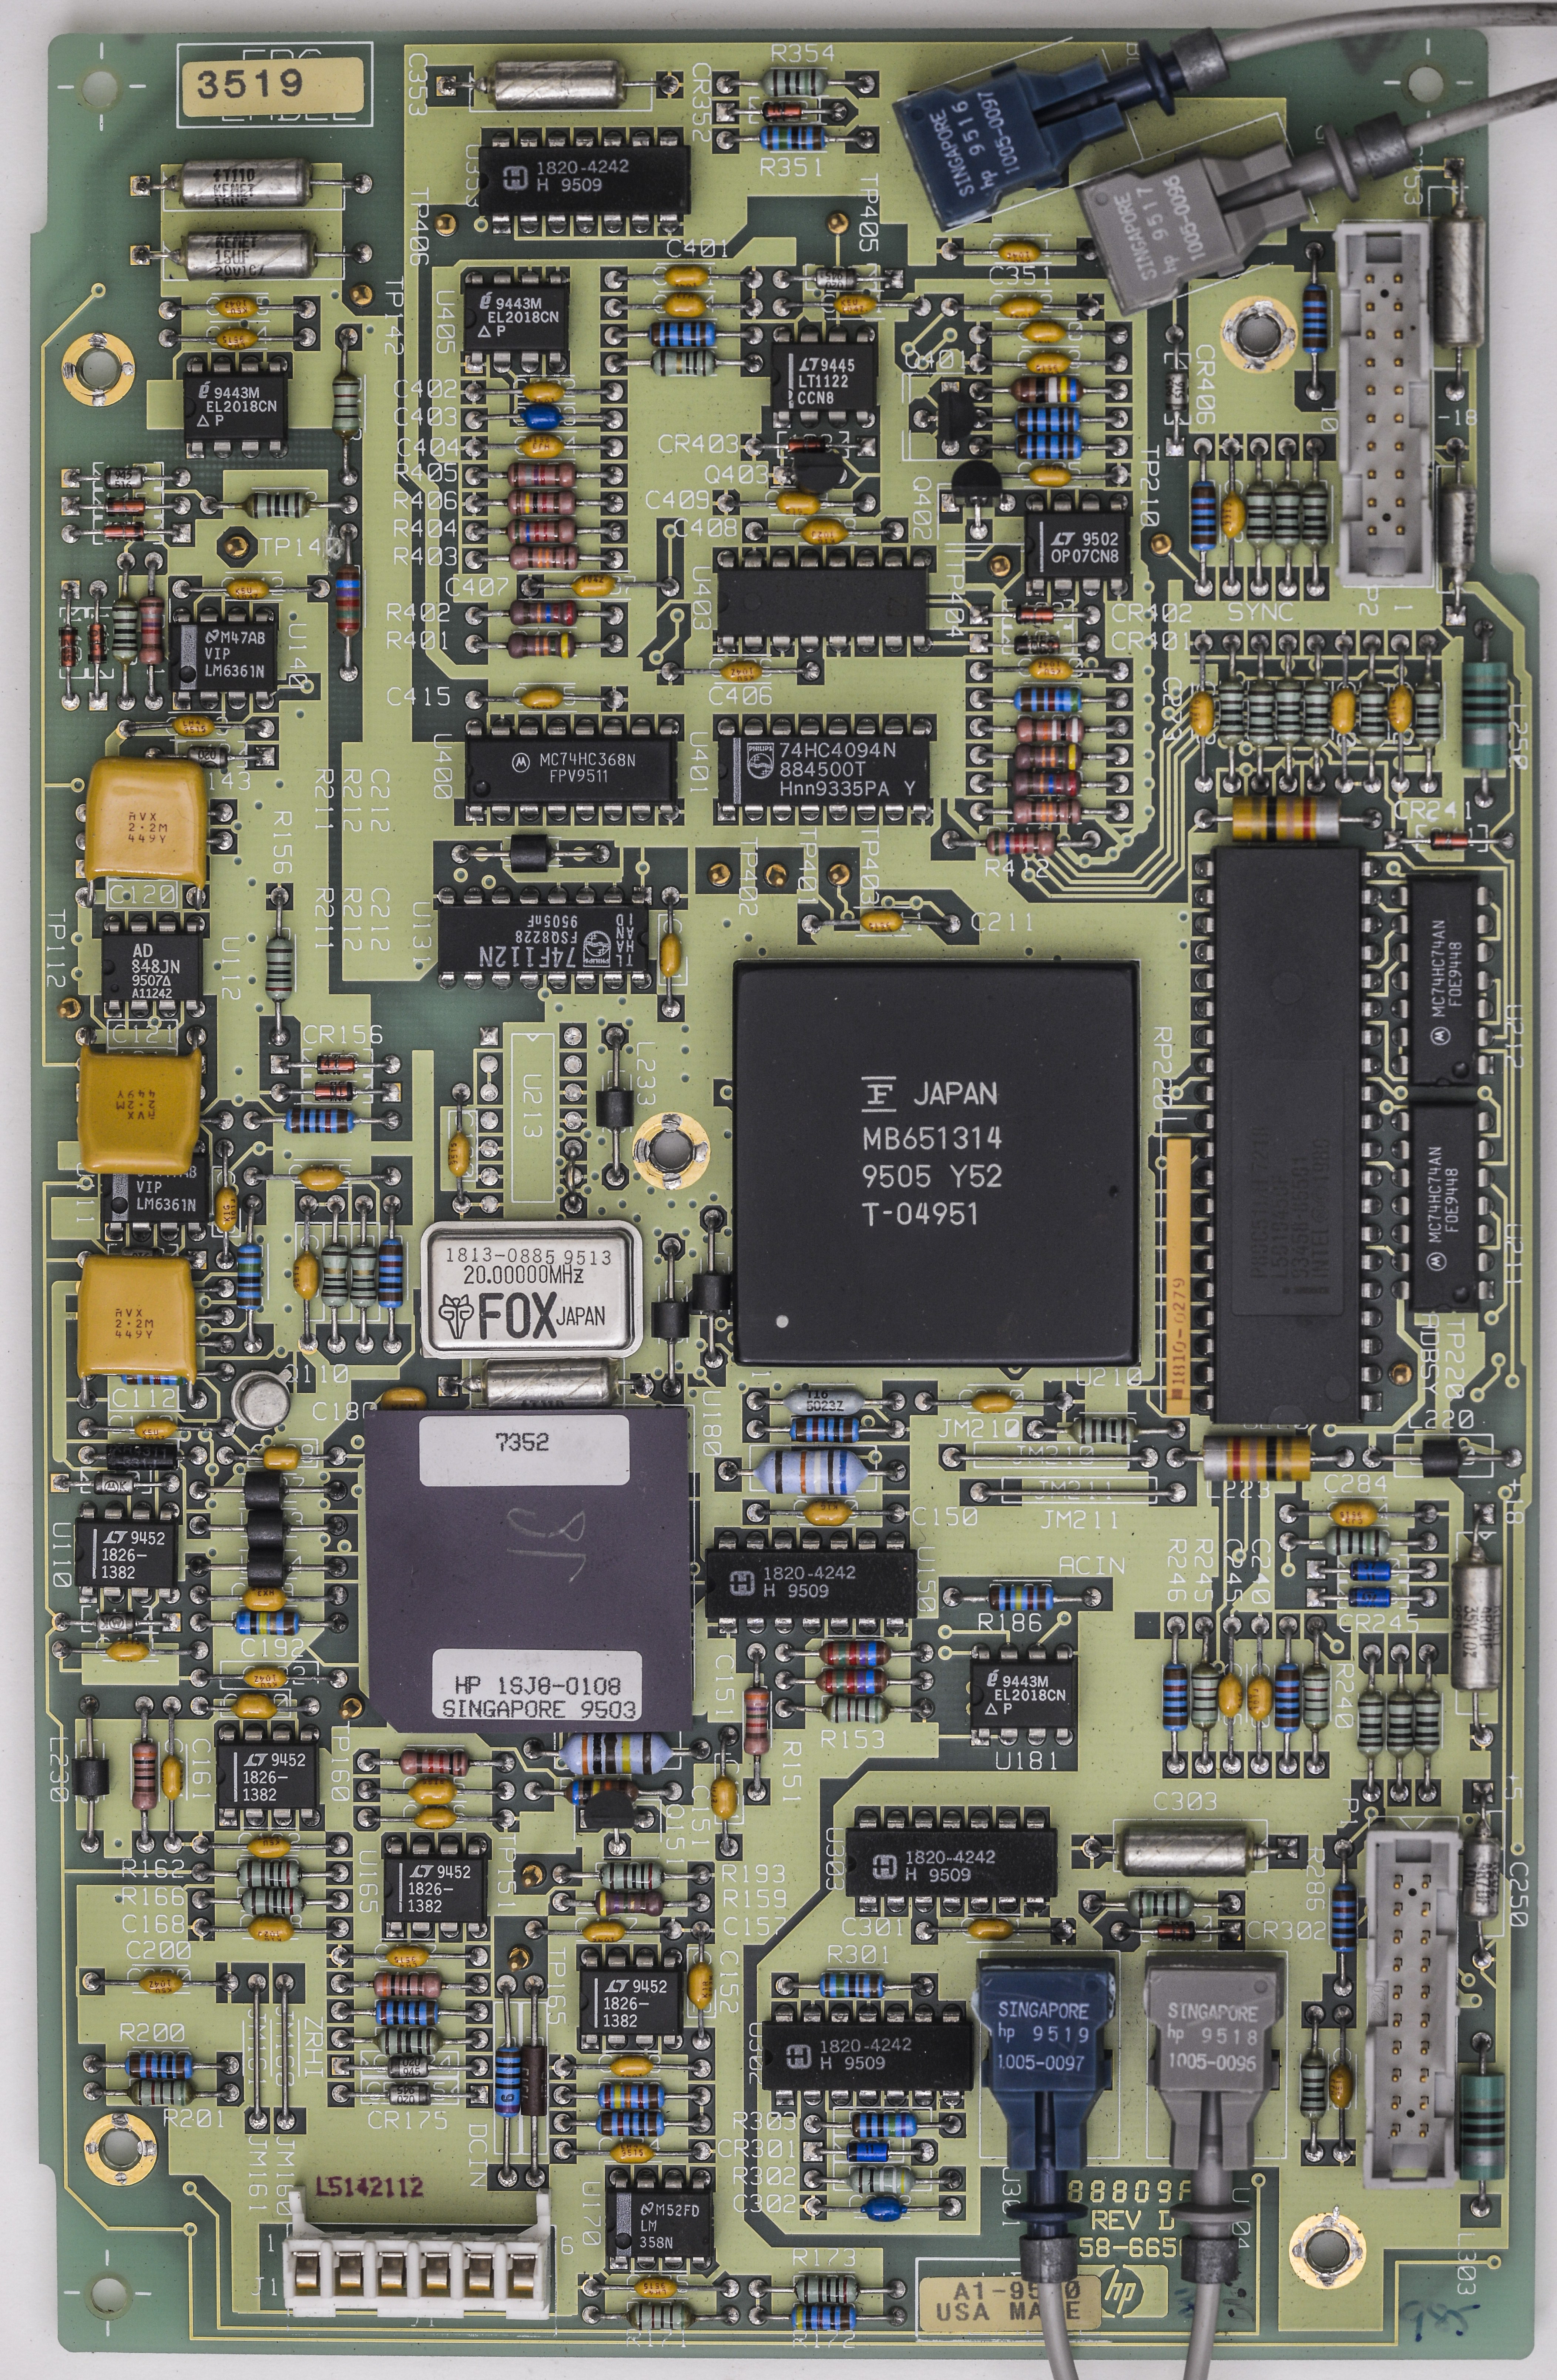
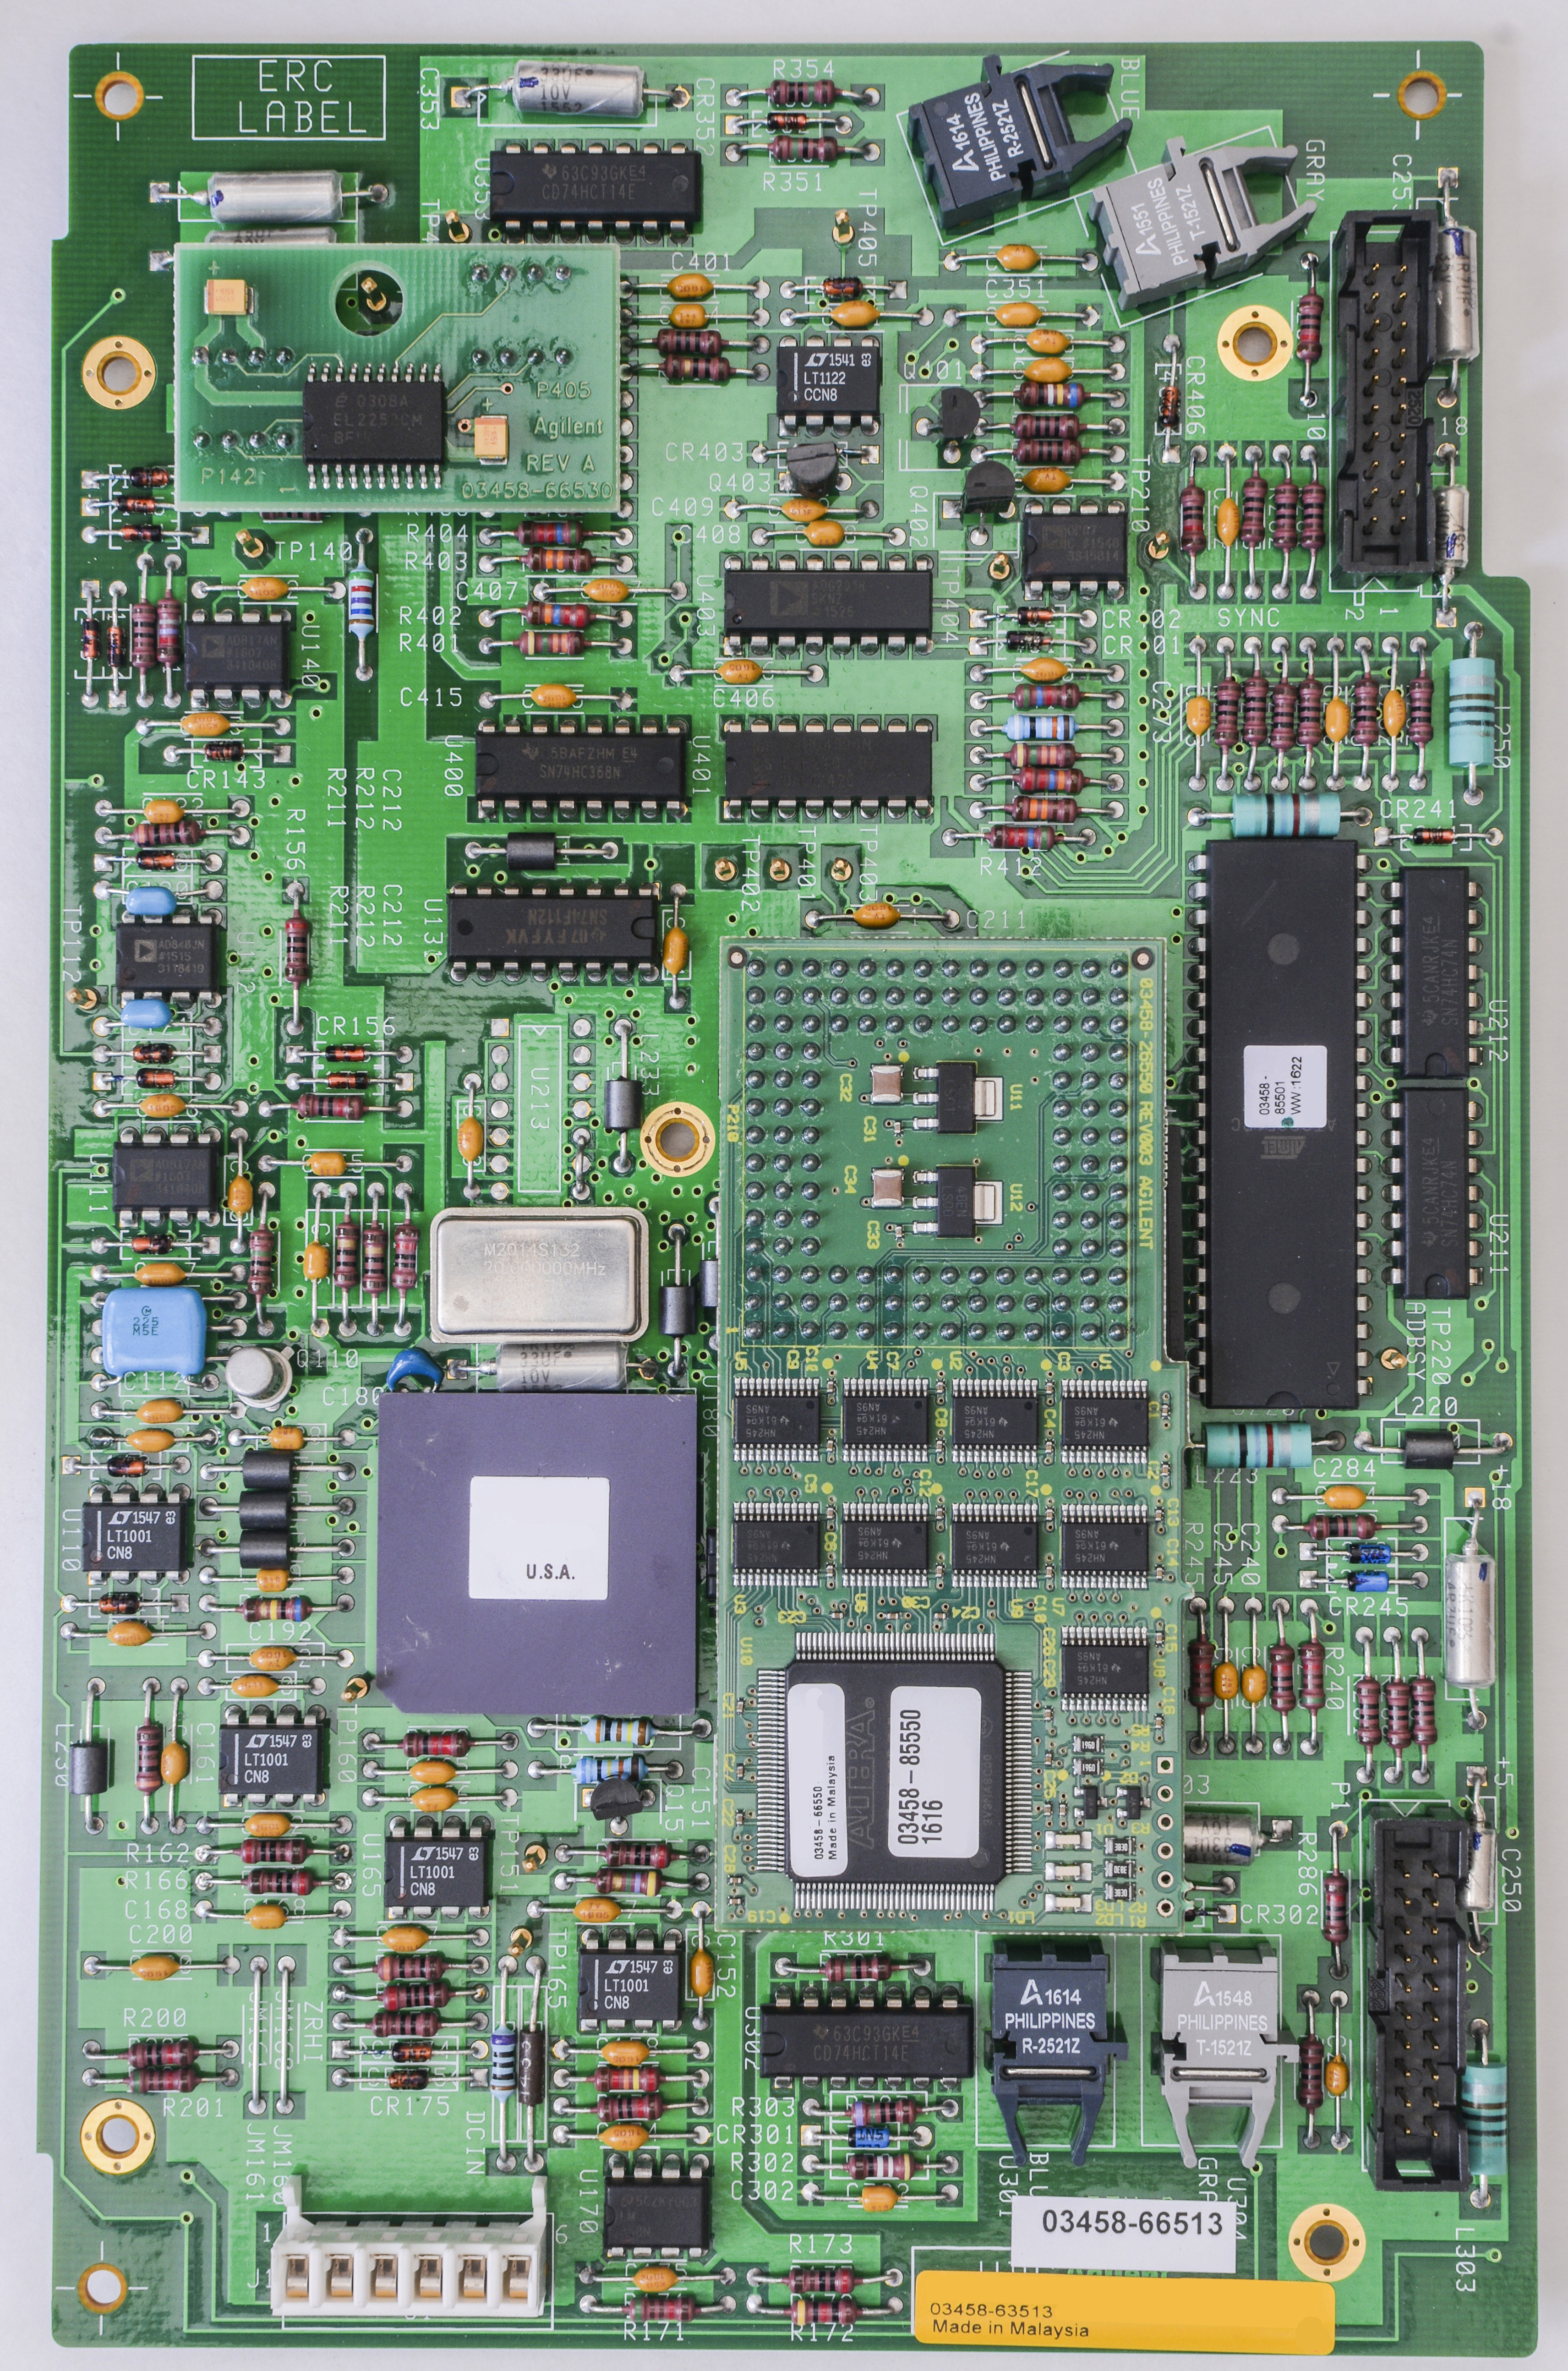
| A3 PCBA Version SKU | 03458-66503 Rev.A | 03458-66503 Rev.C | 03458-66503 Rev.D | 03458-66513 Rev.A | 03458-66513 Rev.B | |
|---|---|---|---|---|---|---|
| Board photograph | 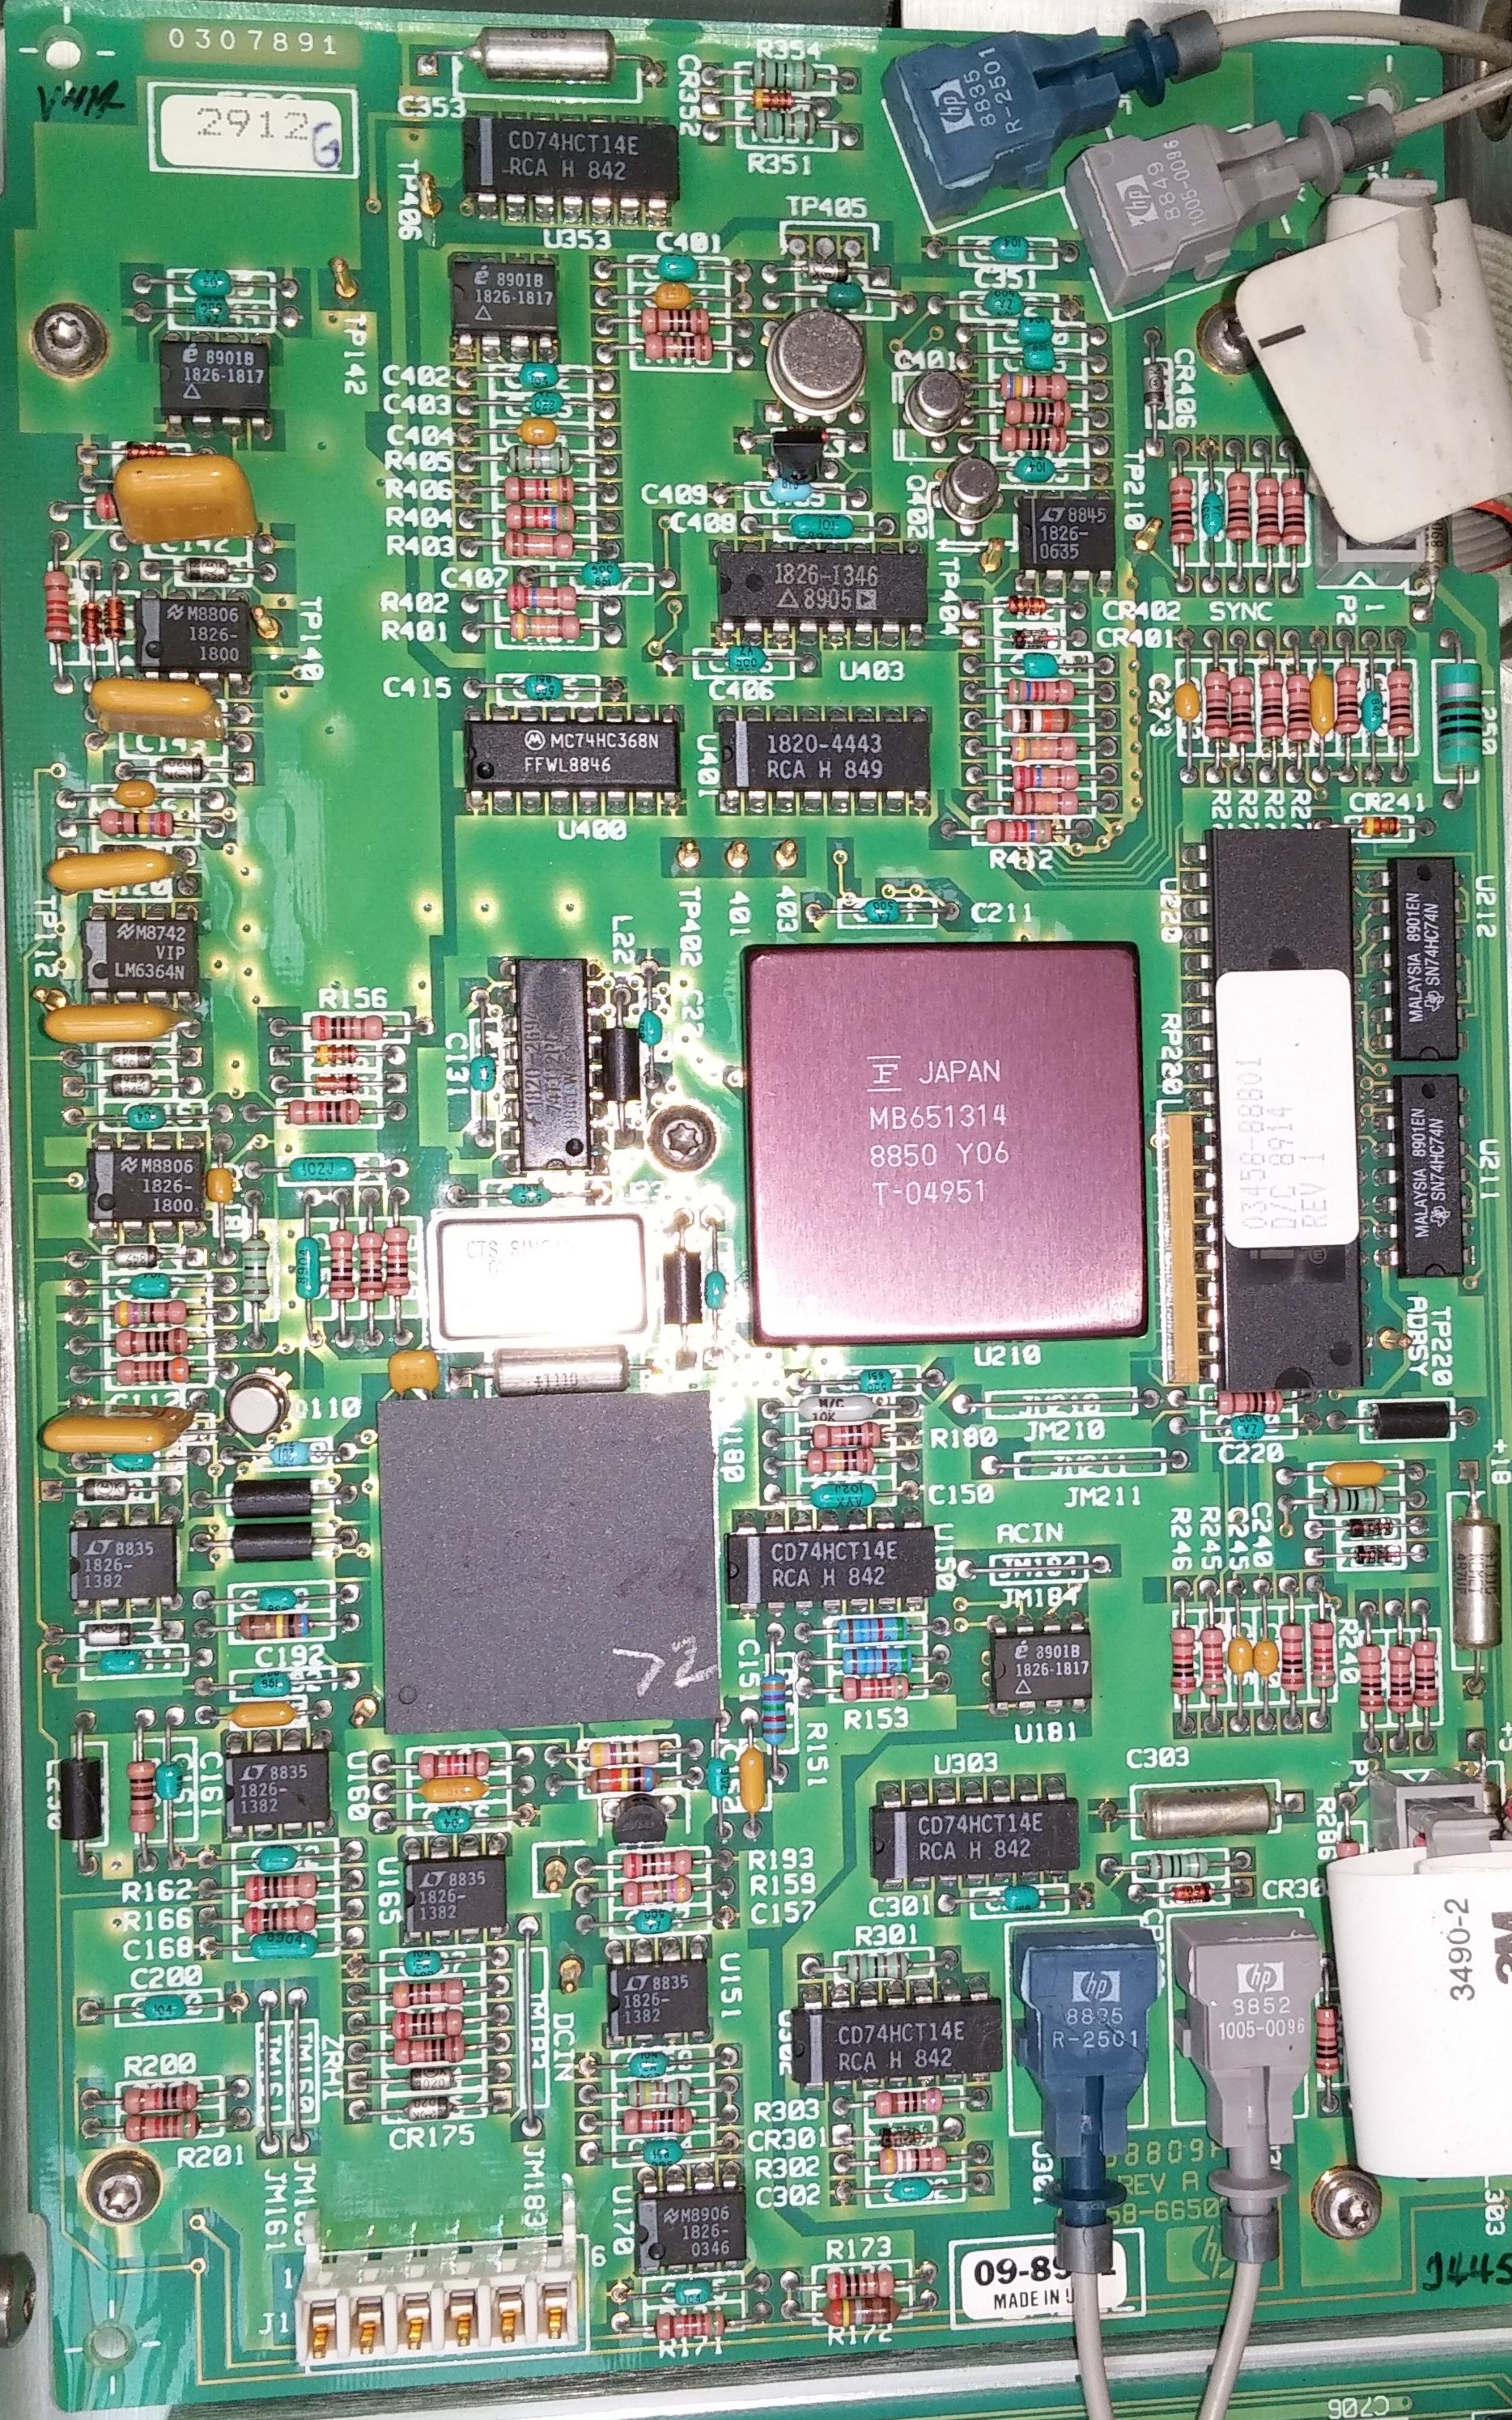 |
 |
 |
 |
 |
|
| First released | 1988 | 1989 | ~1995 | 2000 | 2015 | |
| U180 Hybrid | Same package and footprint | |||||
| Interface MCU 8051 | Mask 03458-85501 | Rev.2 Mask , ATMEL 8051 | ||||
| U210 Gate array ASIC | Fujutsu MB651314 PGA | HP 1820-5770 Orbit 6968A PGA | Patch PCB 03458-26550 with ALTERA CPLD | |||
| Optical interface | HP 1005-0097/HP-1005-0096 | Avago HFBR-2521Z/Avago HFBR-1521Z | ||||
| Integrating cap | MLCC 50V | 50V black plastic NP0 | yellow coated MLCC | |||
| U213 position | 74F112PC | HP 1820-2924 IC | Jumper pin 8 – pin 10 | |||
| ADC U142/U405 comparator | EL2018CN DIP8 (HP 1826-1817) | Patch PCB 03458-66530 with EL2251CM | ||||
| U404 ramp opamp | Hermetic LF400C | Plastic LT1122 | ||||
| C401,Q402 | Hermetic metal can | Plastic | ||||
| C146,C147 capacitors | None | Present | ||||
Table 4: A3 PCB versions


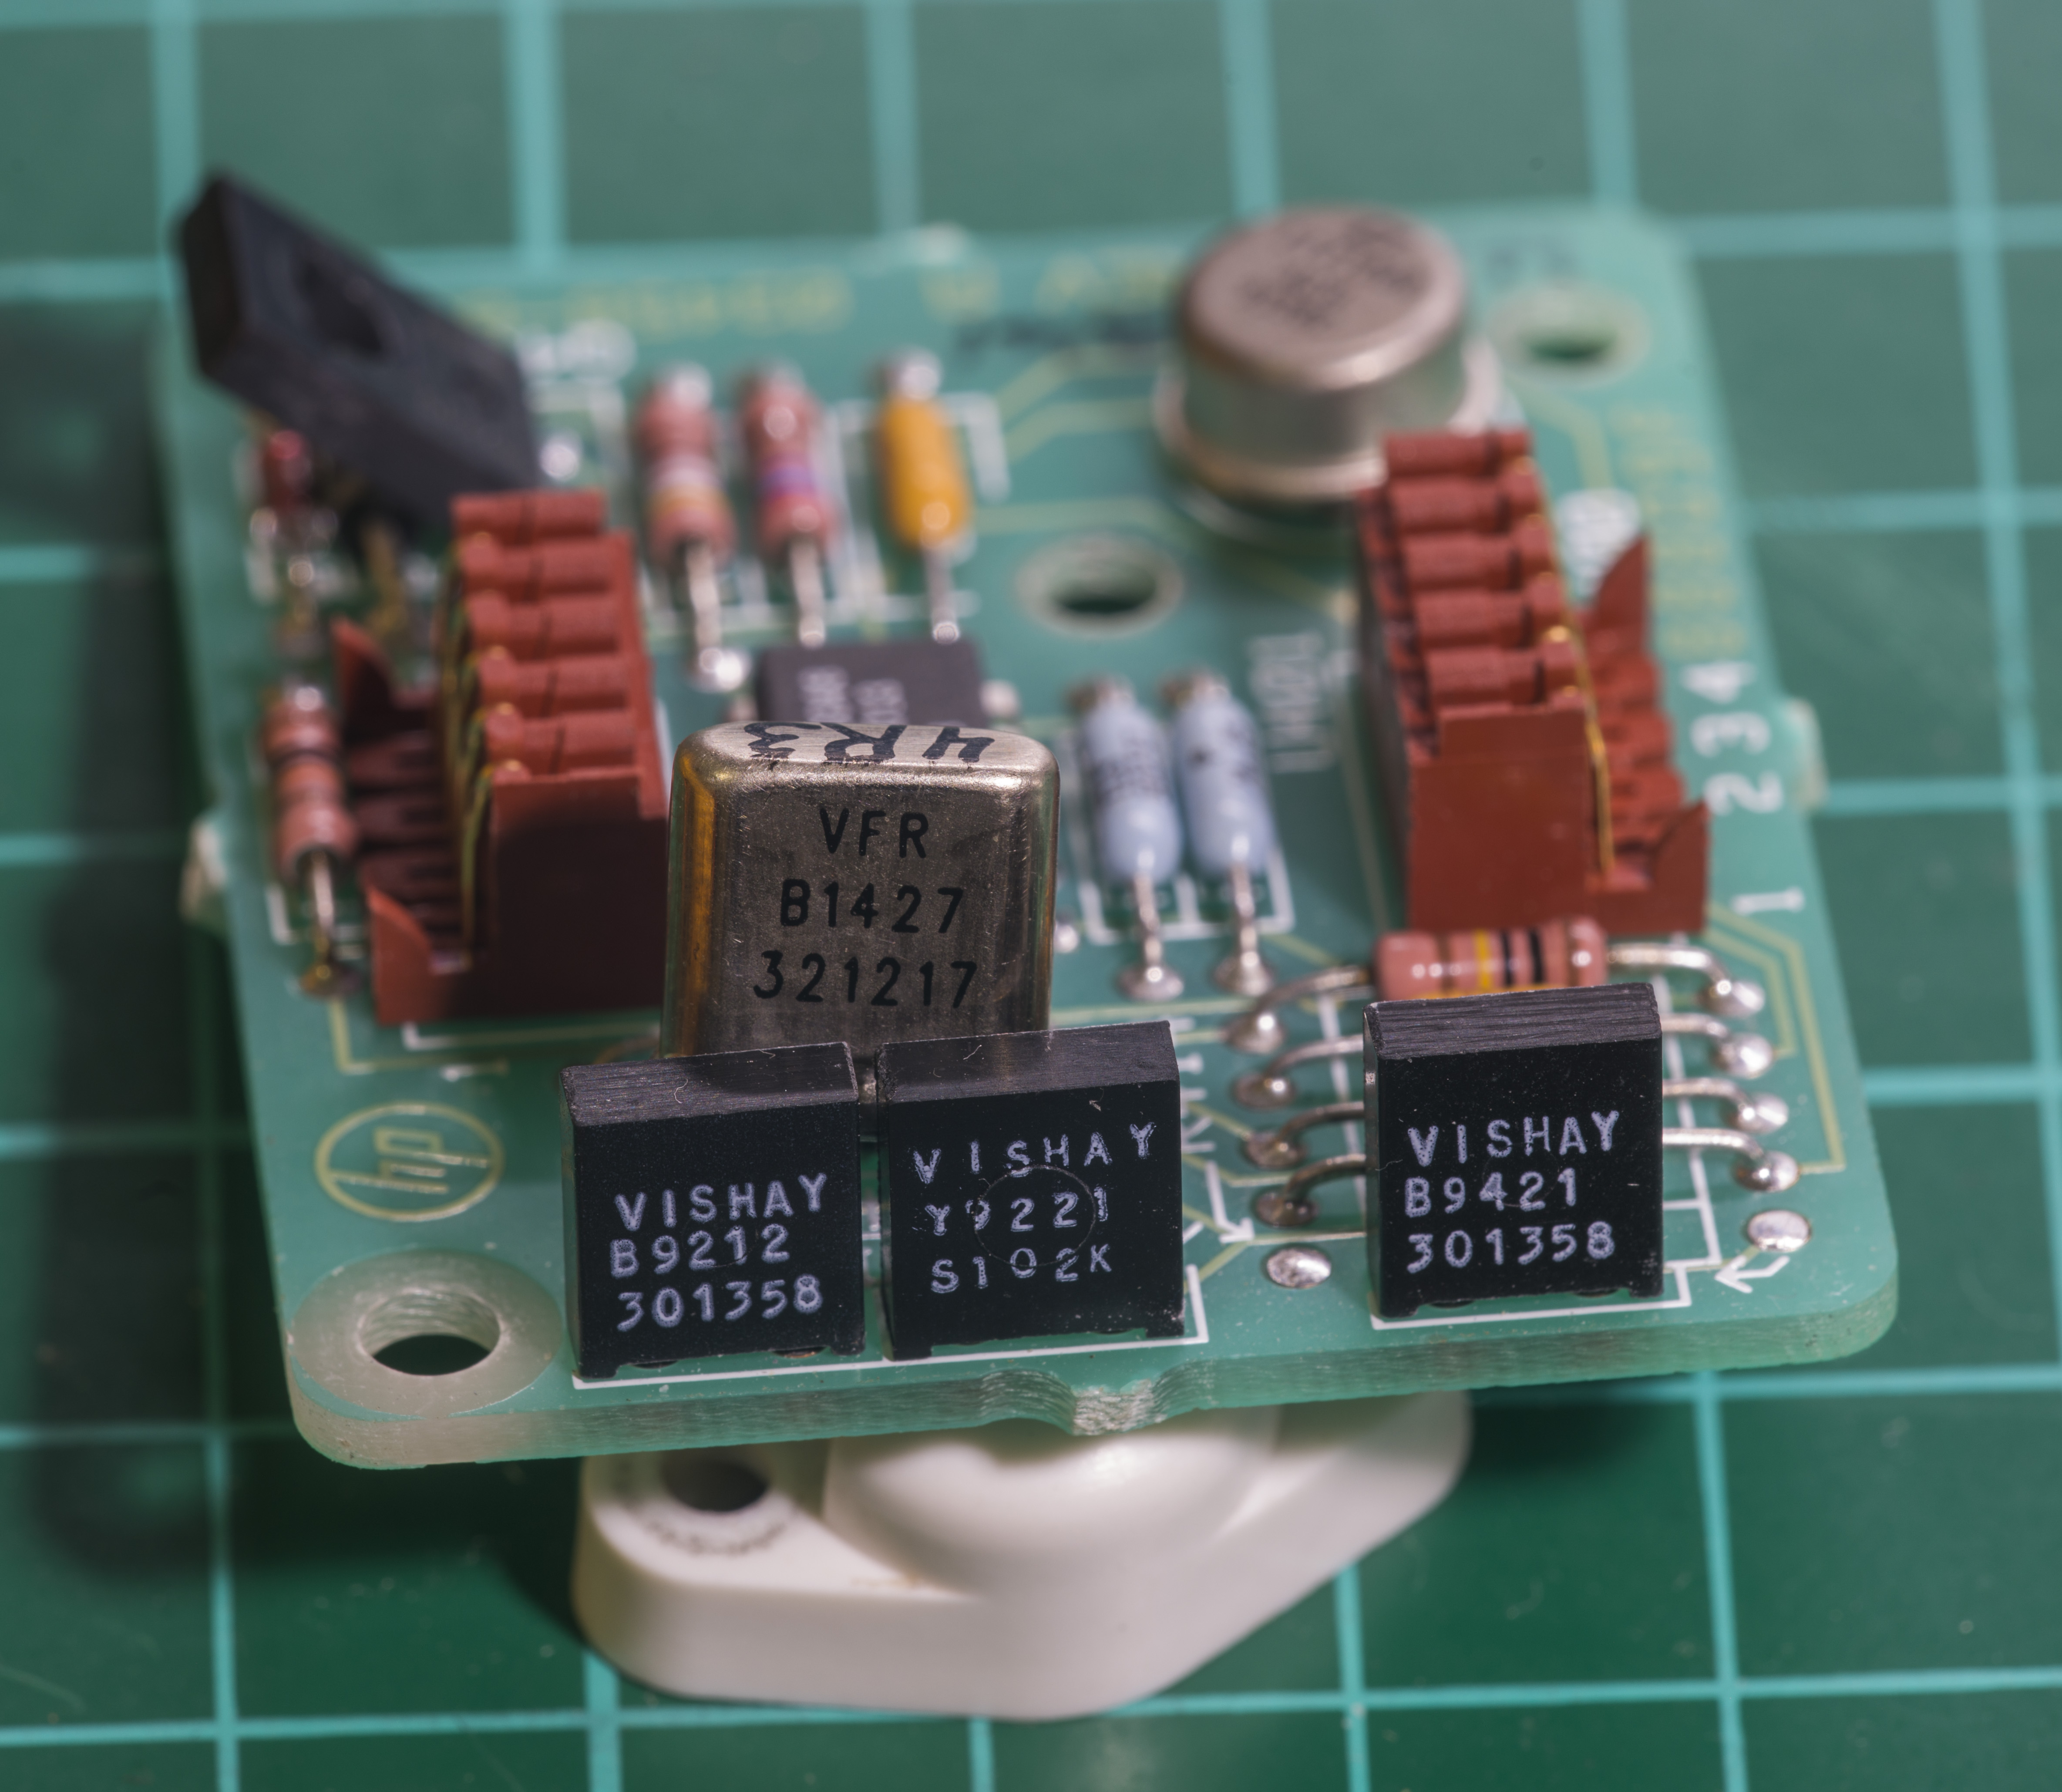
Image 49-50: Latest 3458A A3 ADC assembly, made in 2016
It’s very recent, according to date codes on ICs made in week 16 year 2016, with most of opamps and logic ICs made in 2015. As Keysight running into more and more difficulties to replace old obsolete parts, they were forced to design patch PCB with P/N 03458-26550 with ALTERA CPLD (RTL code 03458-85550) to replace gate array ASIC with digital logic of A/D converter.
Soldering points around patch boards is still covered in flux and has solder bits, so it’s bit how-ya-doing job there. There is also visible flux around integrating capacitor, perhaps it was selected and replaced after board was originally assembled?

Image 51: ALTERA MAX V 1570Z CPLD A/D control logic
Since used MAX V CPLD is not a direct replacement, without support of 5V logic level, array of Texas Instruments SN74LVC8T245 8-Bit Dual-Supply Bus Transceivers used to interface main A3 PCB signals. There are also two LDOs in center, U11 and U12 with bunch of 0402 and 1210 caps around for decoupling. Three LEDs LD1/LD2/LD3 used for status reporting and unpopulated 6-pin 2.54mm spaced header is likely CPLD JTAG port for ISP.
Backup of gate array CPLD bitstream

Image 52: CPLD label revealed
Test pads on the corner edge are reserved for JTAG connector to handle ISP.
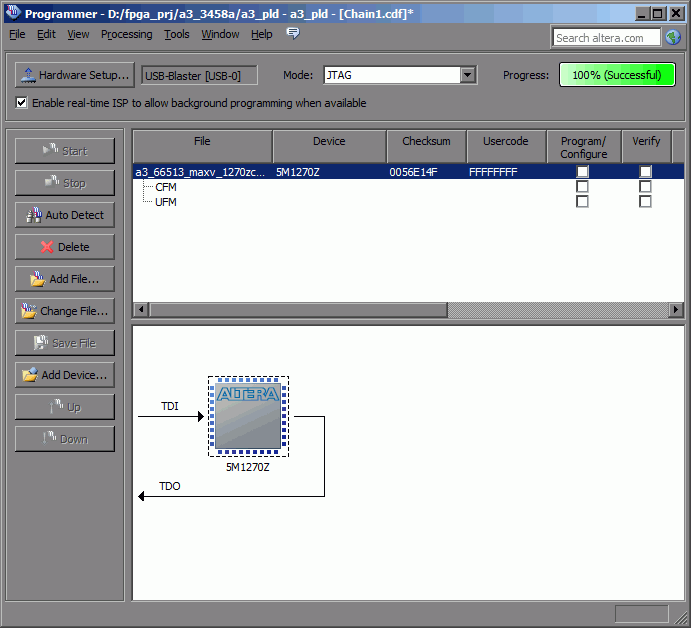
Image 53: CPLD detected with JTAG ISP tool
ALTERA USB Blaster was able to read CPLD configuration without any problems, with dump stored in backup file. Checksum 0056E14F matches one on sticker, so it’s indeed correct dump.
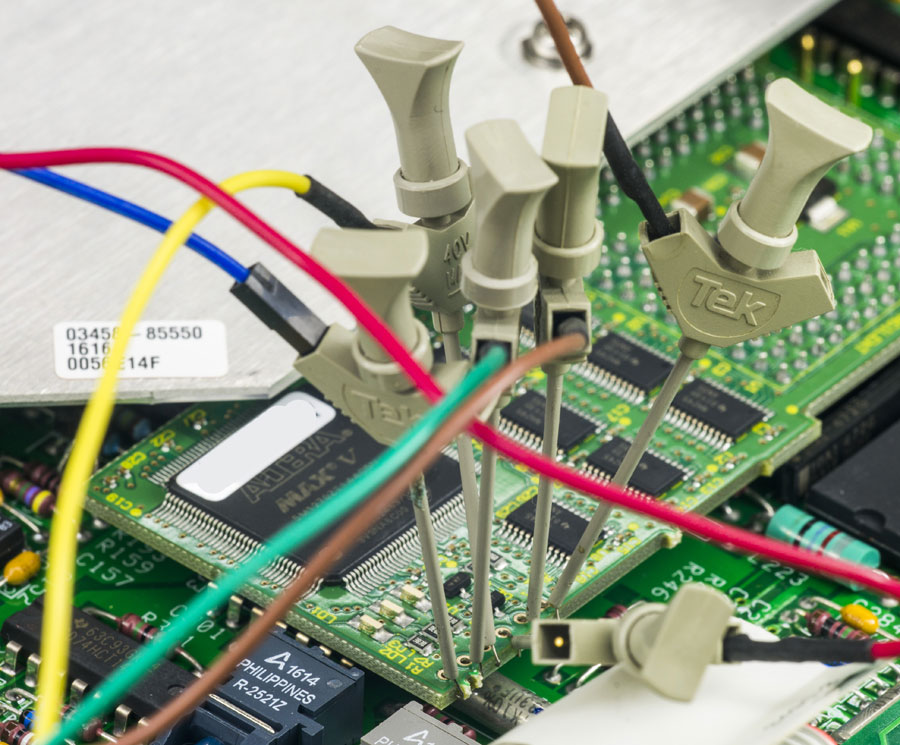
Image 54: Test pad connections using Tek grabbers
Another patch PCB 03458-66530 is installed to replace obsolete Elantec EL2018CN fast ±15V comparator.
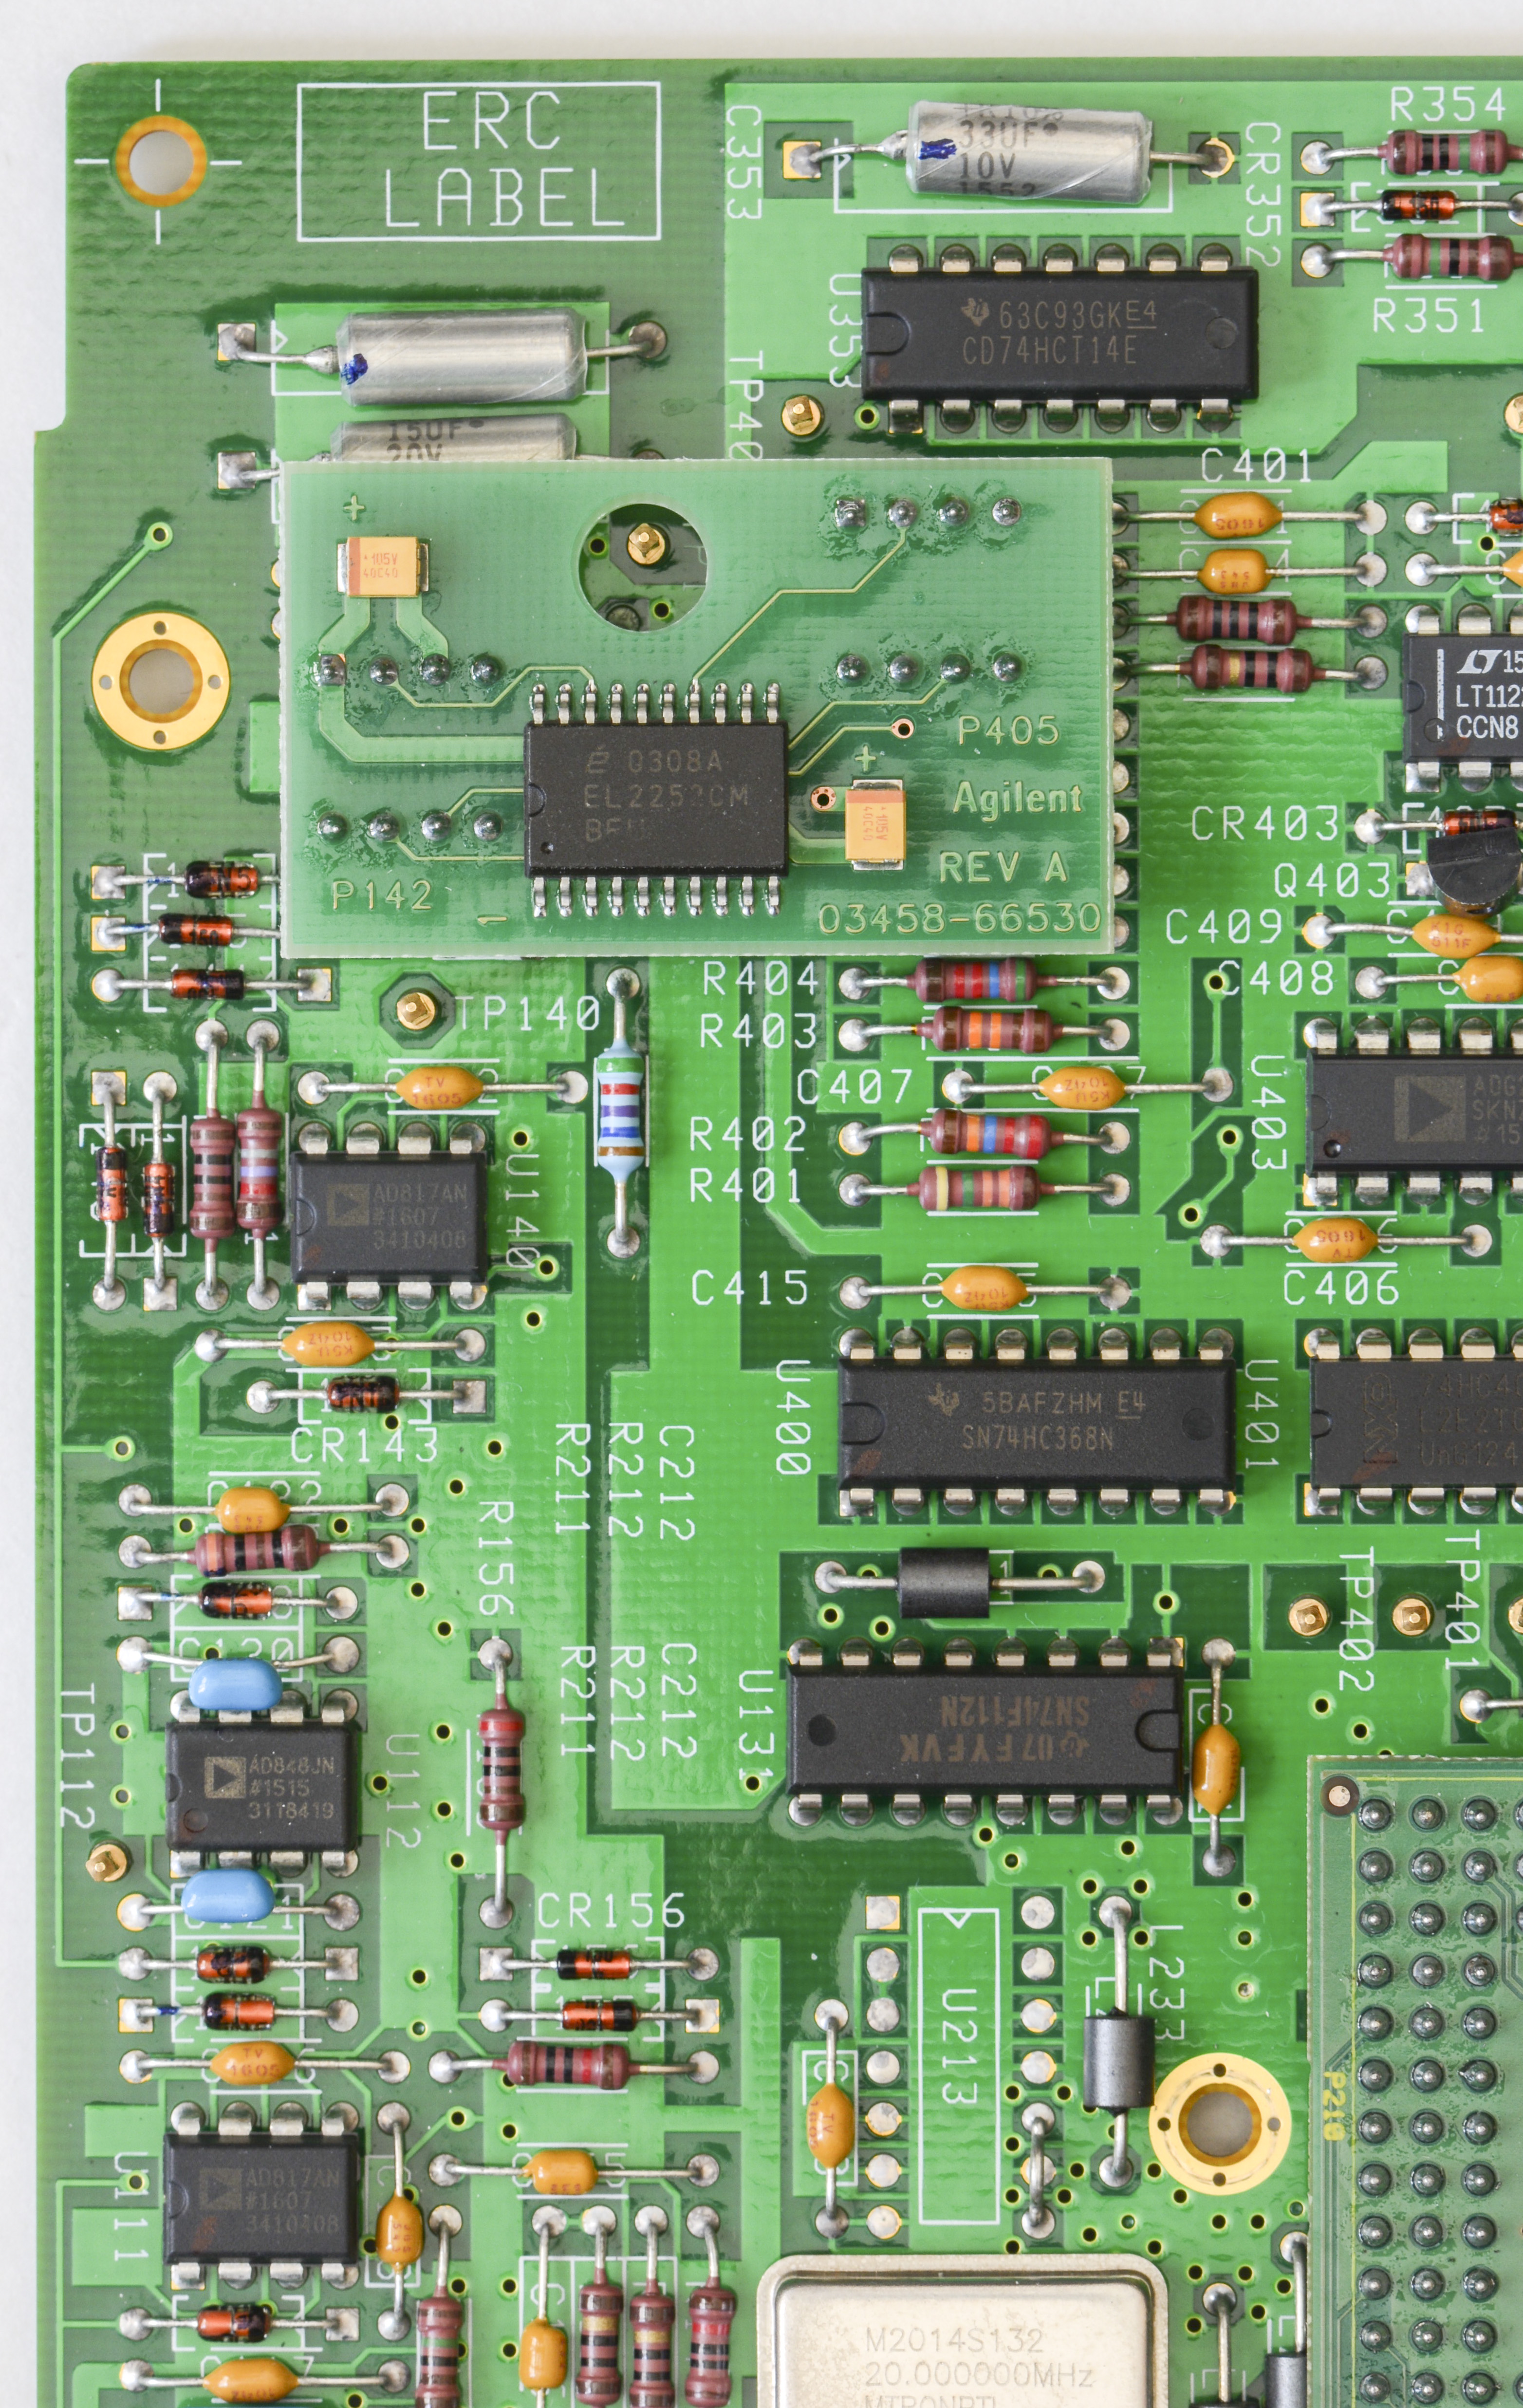
Image 55: Elantec comparator patch board
Let’s see if this ADC board is good, as it came untested without any warranty. To do this I’ll run test covered in Service Note SN18 which compares ADC A3 stability versus A9 LTZ1000 reference, assuming later one is good and stable. A week or so of data would be sufficient to tell the initial result.
SN18 ADC stability test
| Date/time | Meter temperature | CAL? 72 | CAL? 1,1 | CAL? 2,1 | Deviation, ppm |
|---|---|---|---|---|---|
| 18.DEC.2016 20:48 | 35.5 | 983.313029E-03 | 39.9991607E+03 | 7.07743961 | Reference, 0.00 |
| 18.DEC.2016 22:35 | 35.3 | 983.313077E-03 | +0.0488 (0.0488) | ||
| 19.DEC.2016 08:32 | 35.5 | 983.313098E-03 | +0.0214 (0.0702) | ||
| 19.DEC.2016 18:29 | 35.7 | 983.313055E-03 | -0.0437 (0.0264) | ||
| 20.DEC.2016 07:48 | 35.3 | 983.313080E-03 | +0.0254 (0.0519) | ||
| 20.DEC.2016 18:36 | 35.7 | 983.313100E-03 | +0.0203 (0.0722) | ||
| 20.DEC.2016 23:18 | 35.3 | 983.313055E-03 | -0.0458 (0.0264) | ||
| 21.DEC.2016 00:56 | 35.3 | 983.313155E-03 | +0.1070 (0.1281) |
Table 5: Initial SN18-stability check
So far initial test revealed no problem, let’s proceed with quick calibration to Fluke 732B 10V DC standard by executing CAL 10.000000 command and repeat same test, together with datalog of 10V. This will let us to see stability with DC signal applied on 10VDC range.
| Date/time | Meter temperature | CAL? 72 | CAL? 1,1 | CAL? 2,1 | Deviation, ppm |
|---|---|---|---|---|---|
| 21.DEC.2016 09:06 | 35.5 | 983.331695E-03 A | 39.9991607E+03 | 7.07037491 | Reference, 0.00 |
| 21.DEC.2016 20:48 | 36.2 | 983.331710E-03 | +0.0153 (+0.0153) | ||
| 22.DEC.2016 08:26 | 36.2 | 983.331676E-03 | -0.0346 (-0.0193) | ||
| 23.DEC.2016 00:52 | 35.6 | 983.331701E-03 | +0.0254 (+0.0061) | ||
| 23.DEC.2016 08:30 | 36.0 | 983.331641E-03 | -0.0610 (-0.0549) | ||
| 24.DEC.2016 17:42 | 36.2 | 983.331664E-03 | +0.0234 (-0.0315) | ||
| 24.DEC.2016 18:16 | 36.1 | 983.331626E-03 | -0.0386 (-0.0702) | ||
| 24.DEC.2016 23:21 | 35.5 | 983.331697E-03 | +0.0722 (+0.0020) | ||
| 25.DEC.2016 16:45 | 36.6 | 983.331594E-03 | -0.1047 (-0.1027) | ||
| 26.DEC.2016 01:23 | 35.2 | 983.331753E-03 | +0.1617 (+0.0590) | ||
| 26.DEC.2016 08:35 | 35.4 | 983.331695E-03 | -0.0590 (+0.0000) | ||
| 27.DEC.2016 03:41 | 35.2 | 983.331765E-03 | +0.0712 (+0.0712) | ||
| 28.DEC.2016 11:20 | 35.9 | 983.331619E-03 B | -0.1485 (-0.0773) | ||
| 28.DEC.2016 23:32 | 35.5 | 983.331704E-03 | |||
| 29.DEC.2016 08:33 | 35.8 | 983.331724E-03 | |||
| 20.NOV.2018 11:16 | 38.7 | 983.329336E-03 | 39.9992704E+03 | 7.07033766 | |
| 21.NOV.2018 00:03 | 38.6 | 983.329374E-03 | |||
| 21.NOV.2018 08:12 | 38.7 | 983.329421E-03 | |||
| 22.NOV.2018 22:10 | 38.5 | 983.329296E-03 | |||
| 23.NOV.2018 12:10 | 38.6 | 983.329481E-03 | |||
| 25.NOV.2018 16:13 | 40.2 | 983.329211E-03 | |||
| 30.NOV.2018 18:45 | 39.0 | 983.329291E-03 | |||
| 10.DEC.2018 18:45 | 37.7 | 983.329242E-03 | |||
| 11.DEC.2018 18:45 | 38.0 | 983.329346E-03 | |||
| DEC.18.2018 | 34.3 | 982.329678E-03 | |||
| DEC.19.2018 | 36.8 | 982.329412E-03 | |||
| DEC.21.2018 | 41.7 | 982.329147E-03 | |||
| DEC.22.2018 | 39.1 | 982.329335E-03 | |||
| DEC.23.2018 | 36.2 | 982.329446E-03 | |||
| DEC.27.2018 | 36.9 | 982.329450E-03 | |||
| DEC.28.2018 | 34.3 | 982.329596E-03 | |||
| DEC.29.2018 | 34.6 | 982.329521E-03 | |||
| DEC.30.2018 | 34.1 | 982.329473E-03 | |||
| DEC.31.2018 | 34.3 | 982.329437E-03 | |||
| JAN.02.2019 | 35.6 | 982.329464E-03 | |||
| JAN.08.2019 | 37.7 | 982.329270E-03 | |||
| JAN.12.2019 | 37.3 | 982.329283E-03 | |||
| JAN.14.2019 | 36.9 | 982.329294E-03 | |||
| JAN.15.2019 | 36.8 | 982.329235E-03 | |||
| JAN.16.2019 | 35.3 | 982.329377E-03 | |||
| JAN.18.2019 | 35.2 | 982.329415E-03 | |||
| JAN.21.2019 | 35.9 | 982.329441E-03 | |||
| JAN.22.2019 | 34.0 | 982.329586E-03 | |||
| JAN.23.2019 | 34.7 | 982.329553E-03 | |||
| JAN.24.2019 | 35.0 | 982.329599E-03 | |||
| JAN.25.2019 | 35.9 | 982.329564E-03 | |||
| JAN.26.2019 | 34.6 | 982.329648E-03 | |||
| JAN.28.2019 | 35.7 | 982.329761E-03 | |||
| JAN.31.2019 | 38.4 | 982.329628E-03 | |||
| FEB.02.2019 | 36.7 | 982.329679E-03 | |||
| FEB.19.2019 | 35.4 | 982.329715E-03 | |||
| FEB.21.2019 | 34.8 | 982.329813E-03 | |||
| FEB.24.2019 | 34.9 | 982.329500E-03 | |||
| FEB.25.2019 | 35.1 | 982.329474E-03 | |||
| FEB.26.2019 | 34.6 | 982.329662E-03 | |||
| FEB.28.2019 | 40.8 | 982.329152E-03 | |||
| FEB.28.2019 | 35.3 | 982.329745E-03 | |||
| MAR.01.2019 | 35.1 | 982.329731E-03 | |||
| MAR.05.2019 | 34.4 | 982.329583E-03 | |||
| MAR.09.2019 | 33.0 | 982.329683E-03 | |||
| MAR.16.2019 | 35.4 | 982.329493E-03 | |||
| MAR.17.2019 | 35.7 | 982.329380E-03 | |||
| MAR.18.2019 | 36.5 | 982.329551E-03 | |||
| MAR.20.2019 | 35.6 | 982.329463E-03 | |||
| MAR.21.2019 | 36.5 | 982.329447E-03 | |||
| MAR.22.2019 | 35.6 | 982.329472E-03 | |||
| MAR.24.2019 | 37.8 | 982.329423E-03 | |||
| MAR.25.2019 | 34.6 | 982.329468E-03 | |||
| MAR.26.2019 | 35.3 | 982.329424E-03 | |||
| MAR.31.2019 | 34.1 | 982.329931E-03 |
Table 6: Post-calibration SN18-stability check
Overall A/D drift rate result per Service Note 18 is C = [(A – B) * 1000000] / [A * 7 days] formula = -0.0110 ppm, which is well within 0.43 ppm requirement. If this rate is greater than 0.43 ppm/day, then the A3 assembly needs to be replaced.
There is no much repair possible on drifty A3 boards. This is also confirmed by many 3458A owner reports, since usually root cause of excessive drift/integration errors is faulty U180 custom hybrid chip, which is not repairable. Last year I’ve spend more than 200 hours, trying different things to get A3 working in my first 3458A with no avail. Final solution was replacement of A3 PCBA altogether.
Day 10-22: Modification for lower LTZ1000ACH oven temperature
As we will be doing own calibration for this meter, and its main use targeted for aircon environment, so very high nominal ~90°C oven temperature of main LTZ1000A-based reference (PCBA A9) is undesired. Higher temperature causes very large long-term drift, which is specified by HP/Agilent/Keysight at 8 ppm/year for standard reference modules and 4 ppm/year for special pre-selected option 002 “high-stability” references. This design decision was made by HP engineers to satisfy +50°C operation temperature range for tight rack-mount usage, such as military applications.
So for metrology and lab purposes this is not good, but solution is rather simple. We can reduce on-die oven temperature of LTZ1000A reference chip by just adding one resistor in parallel with original temperature set point one. There is even empty footprint on A9 PCBA, perfectly suitable for this task.
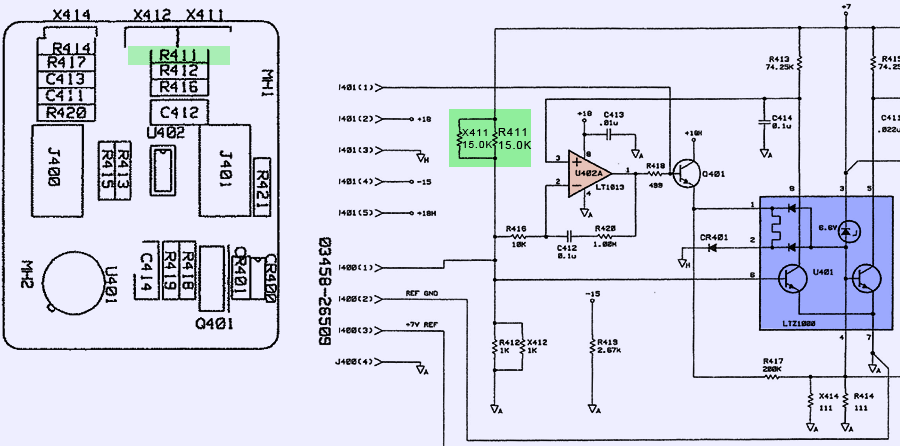
Image 56: Schematics of lower oven temperature tweak
Added resistor need to be high enough value to reduce original X411 15 KΩ resistor down to ~13KΩ which will reduce temperature to ~55°C, improving long term-stability to <2 ppm/°C. Such modification was already successfully performed on my first 3458A and meter indeed is good and stable after the recalibration.
If you change the oven temperature, you will lose the calibration, as the LTZ1000A will change its reference voltage, invalidating previous calibration constants.
Additional resistor has to be high-stability and low tempco type, to ensure that temperature set-point does not drift over time. Vishay Precision Group VAR Z-foil 100 KΩ with specified maximum TCR ±2 ppm/°C resistor satisfy requirements well. Resistor temperature coefficient must be no more than 3ppm/°C. Still most of error comes from original 15 KΩ metal foil resistor, so there is no need for ultra-stable 0.2 ppm/°C resistors unless original one is replaced too. Retail price for VAR BMF resistor range in $USD 15-30 mark, depends on tolerance, value and order quantity required.
Here are few photos of modified LTZ1000 reference, A9 PCBA with 95 KΩ in our first 3458A:
 “!
“!
Image 57-58: A9 PCBA modified with Vishay 95KΩ VHP101 resistor for lower oven temperature
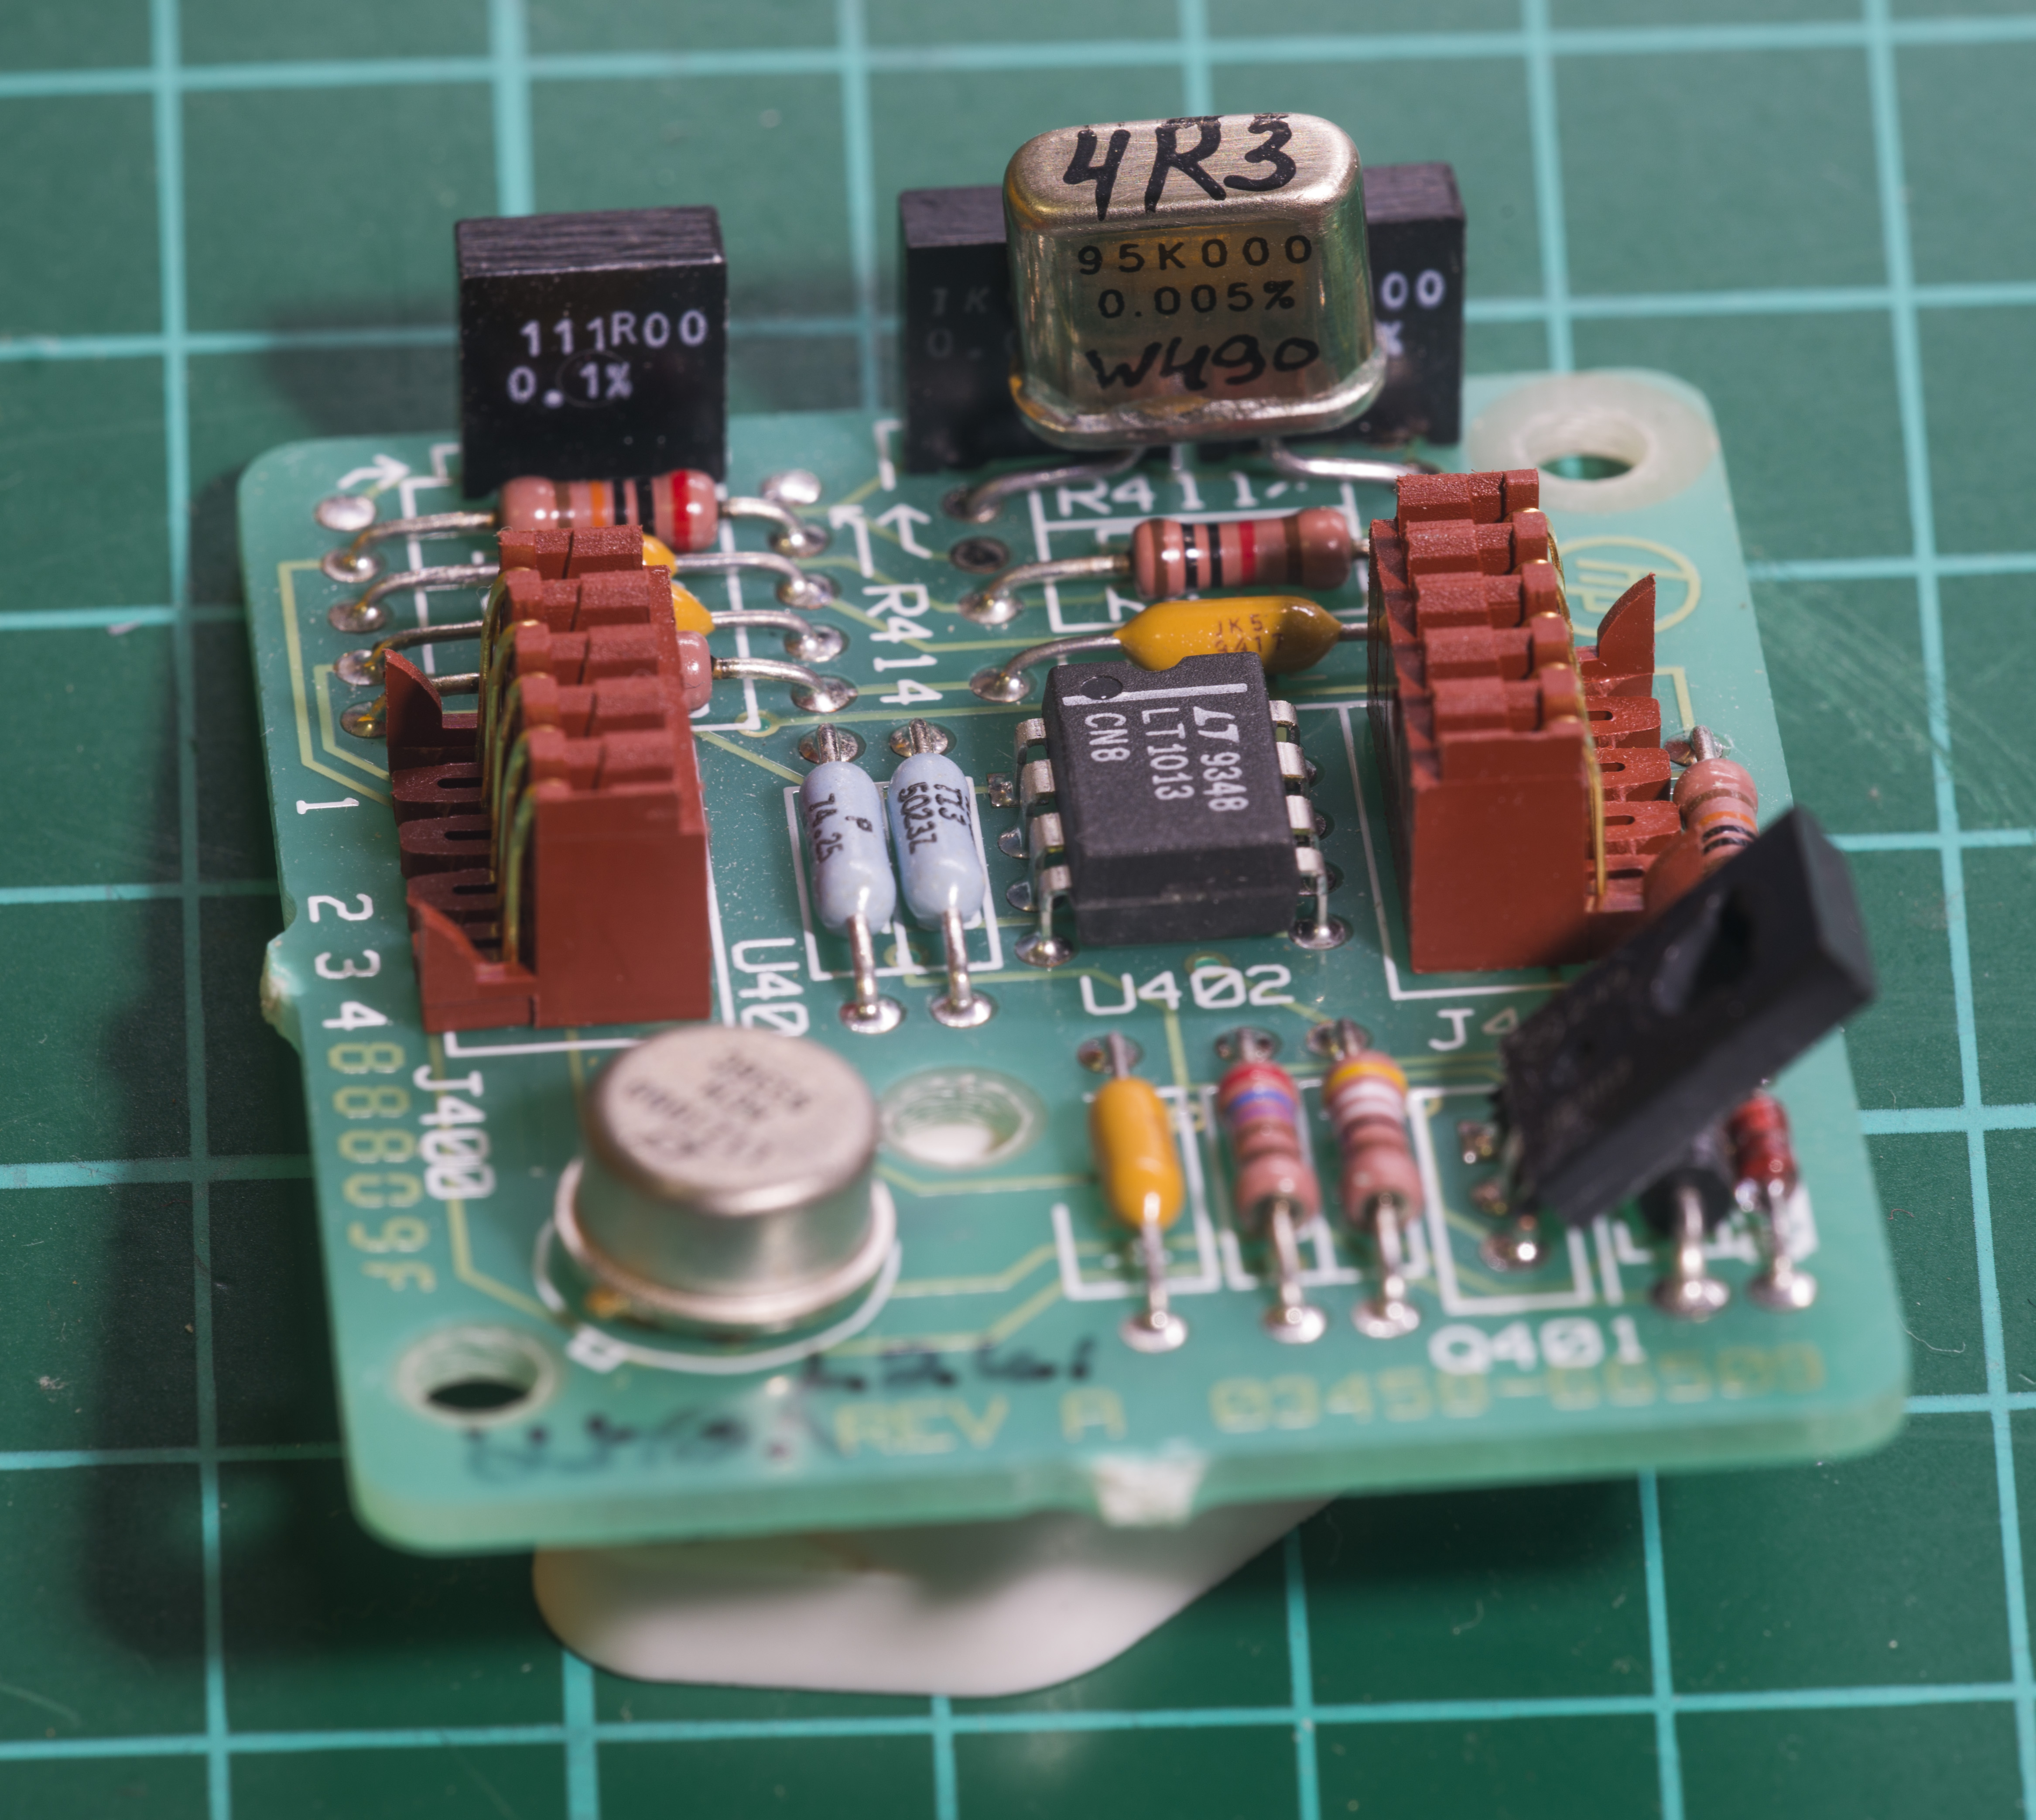
And this second unit A9 module, modified same way but with VAR 100KΩ resistor instead:
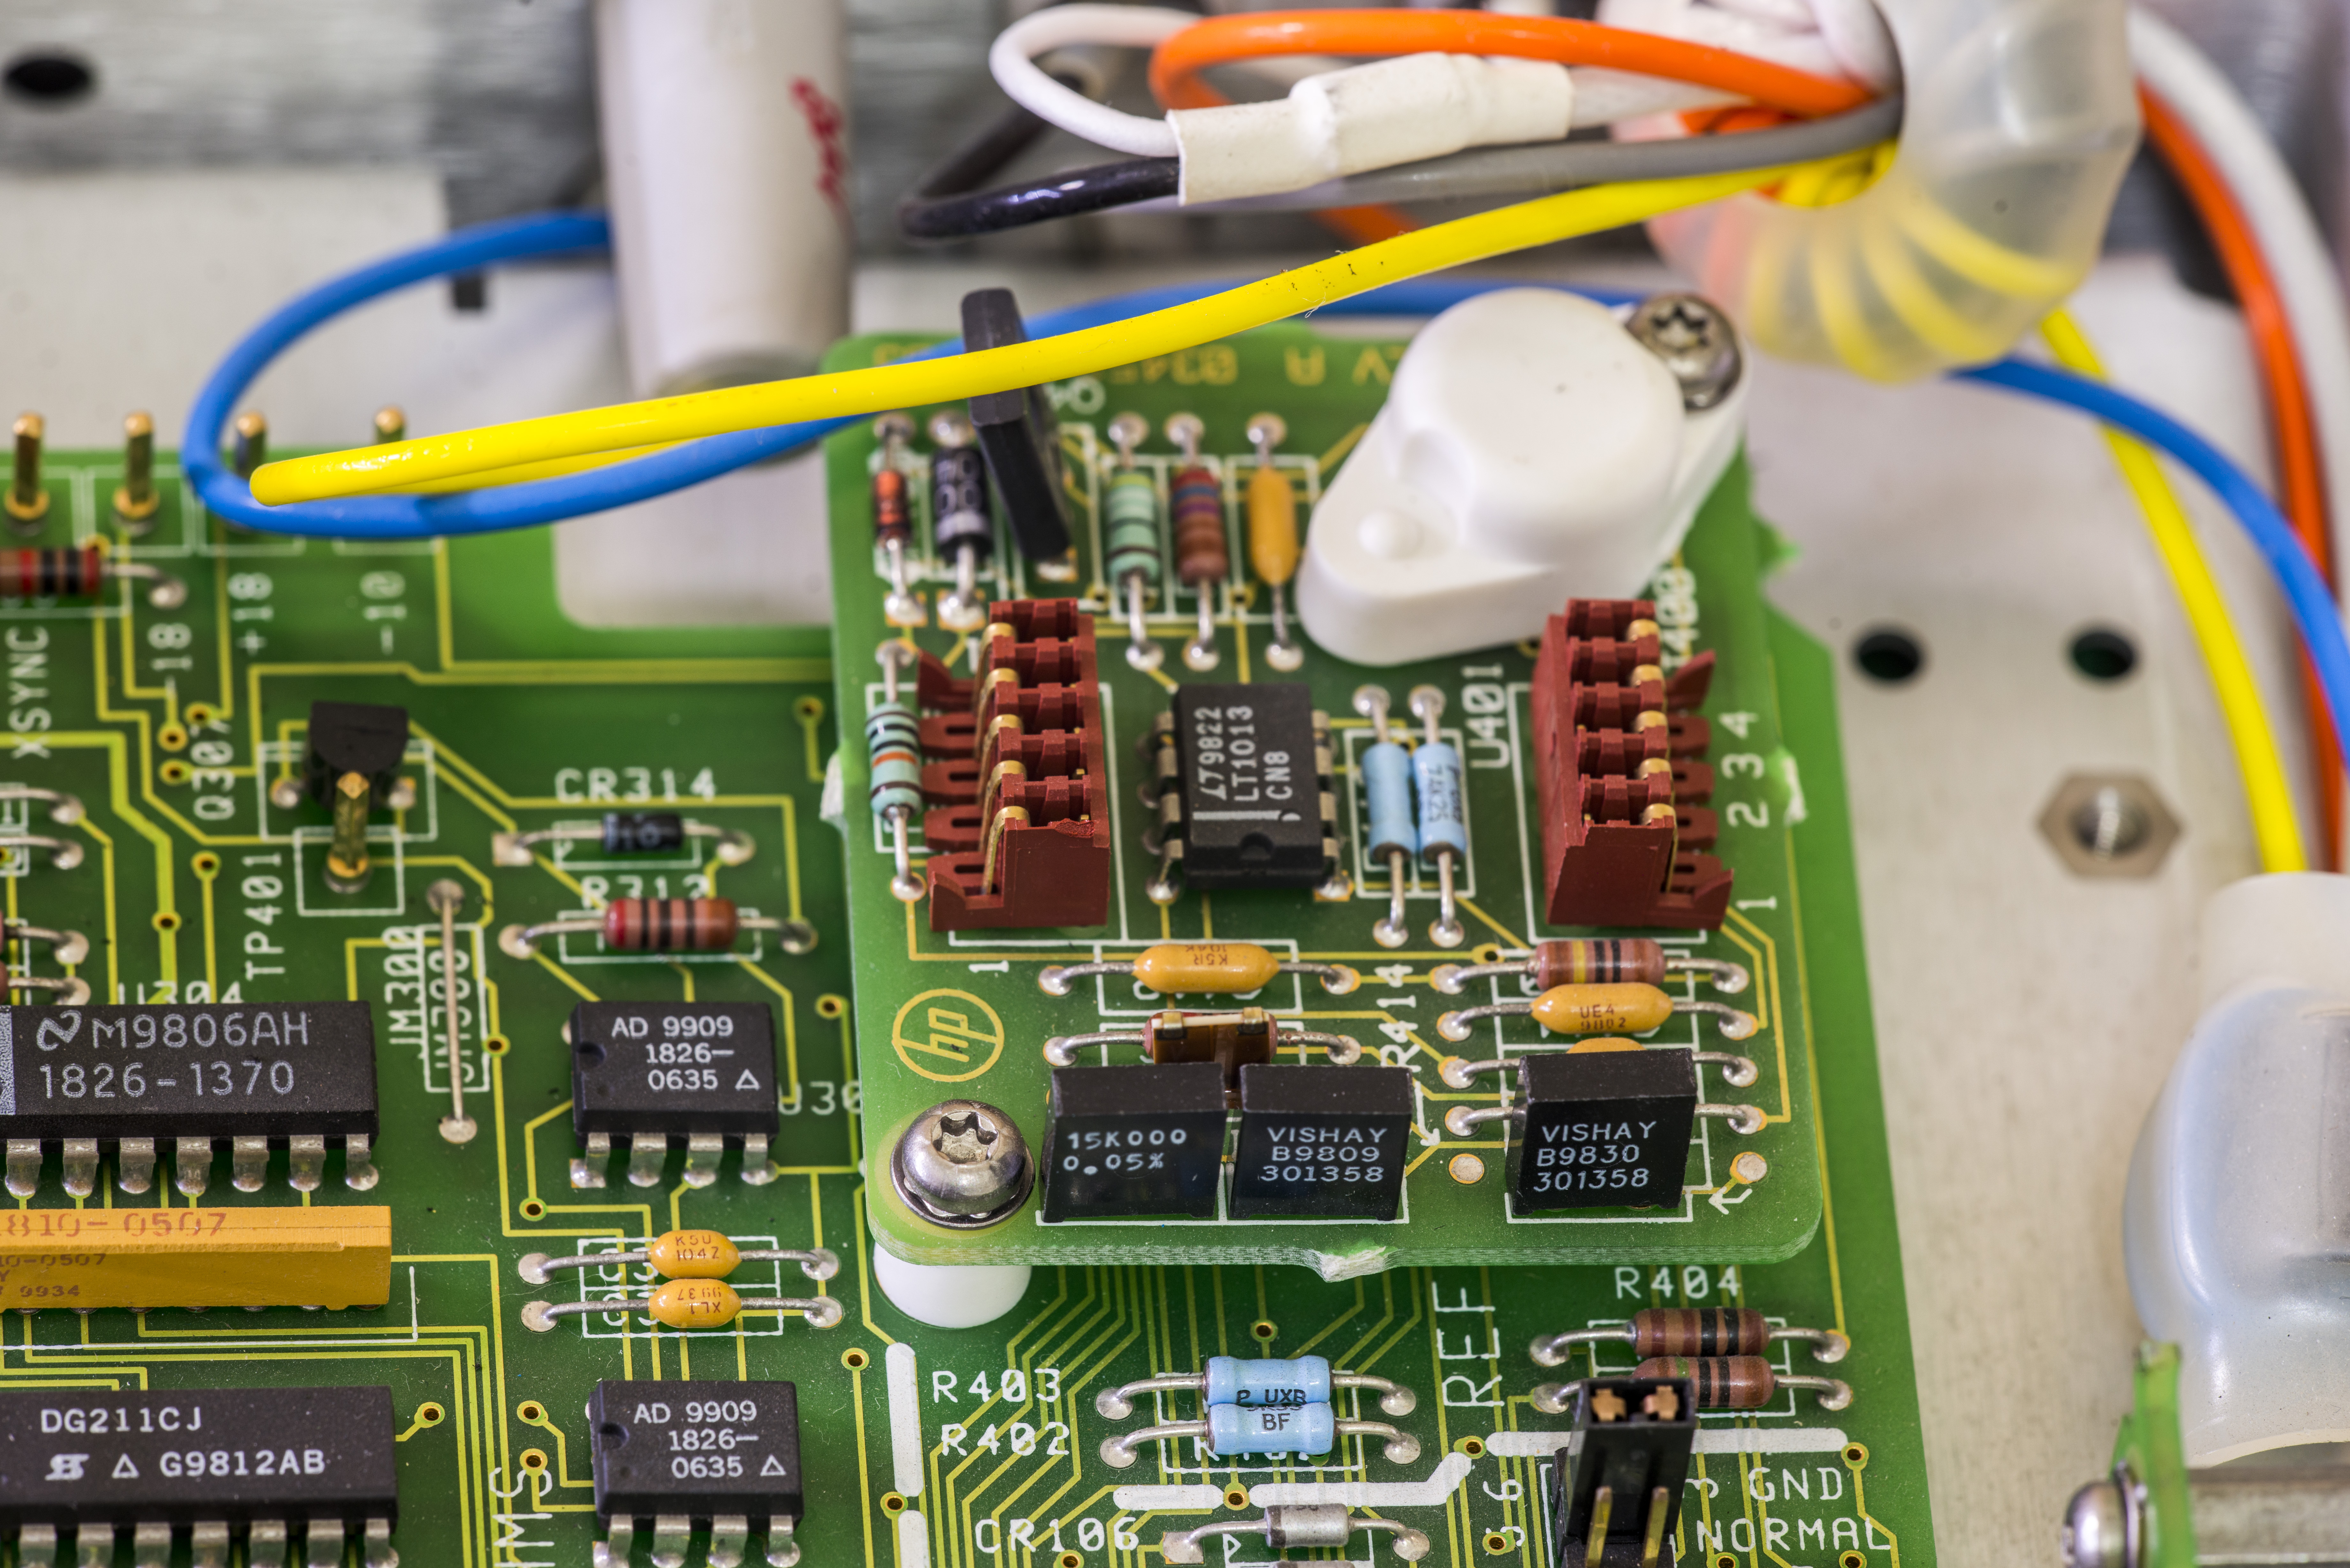
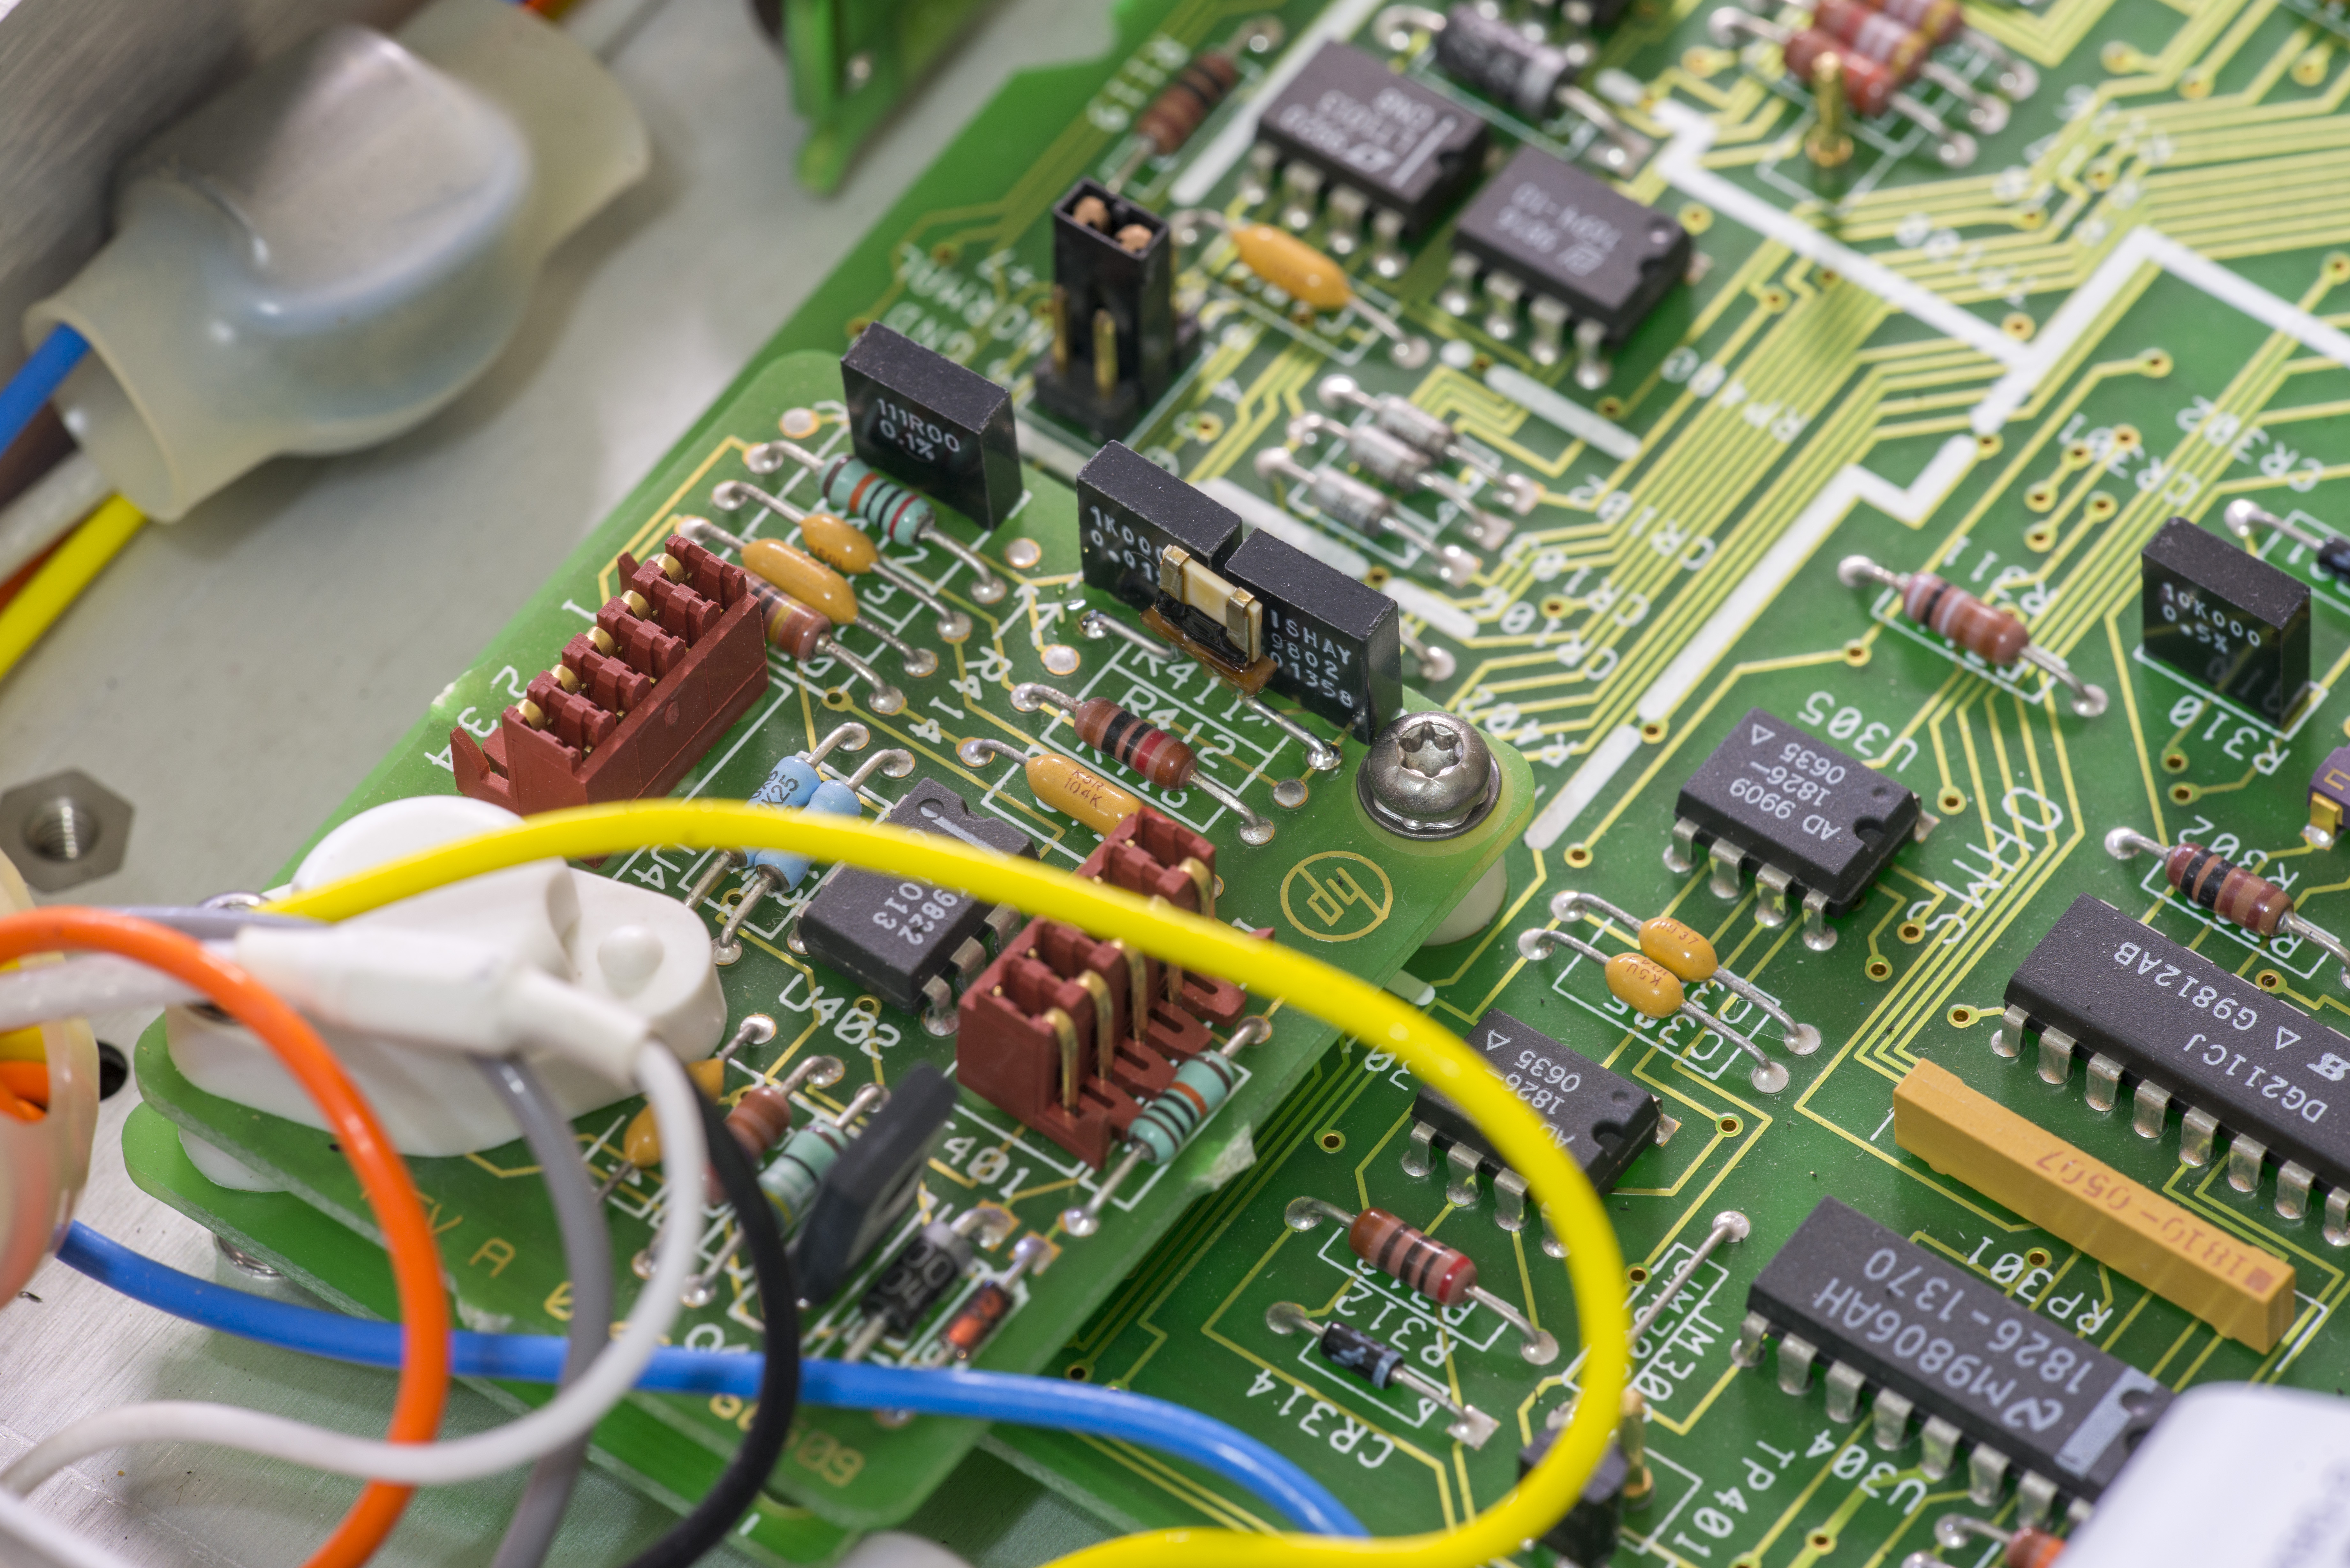
Image 59-60: A9 PCBA modified with Vishay 100KΩ VAR resistor for lower oven temperature
Now after modification unit was assembled and warmed up few hours to perform stability test once again. No problems revealed at this stage.
Day 23: DC 10VDC test with reference input
Now as we have unit functioning, it’s vital to determine if there is hidden drift over long-term period. And there is no workaround but to actually connect very stable source, such as +10 VDC ovenized DC reference, in this case mighty Fluke 732B and log data over extended period of time, such as week or two. By monitoring deviation and temperature, one can reveal drift component of measured voltage. It’s also important to keep stable environment conditions, such as air temperature/humidity to reduce error from these condition variations.
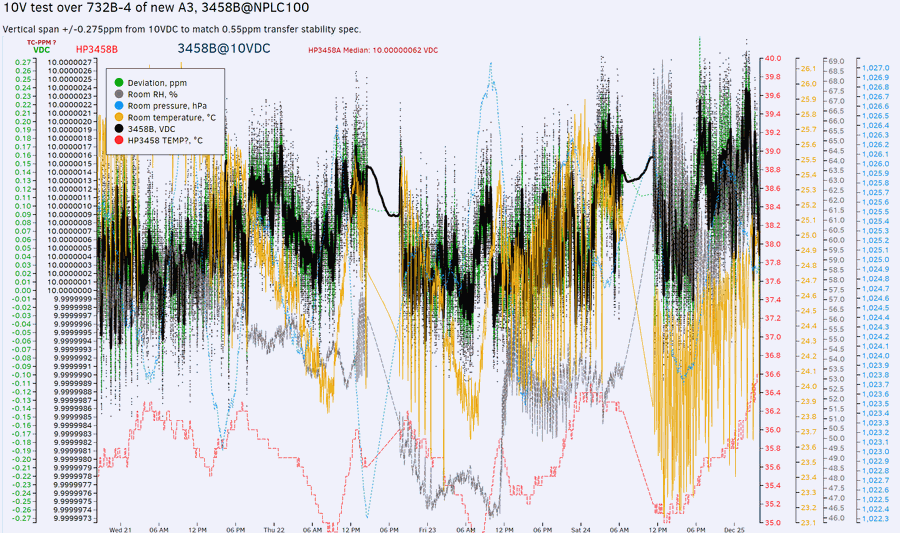
Image 61: Testing against Fluke 732B standard
To draw a conclusion regarding new A3/meter stability next set of targets should be achieved:
- Voltage need to be stable within ±0.1 ppm window over 10 minutes of constant TEMP? PASS
- Stable within ±0.275 ppm window over 24 hour of constant TEMP? %{color:#008800}PASS, 0.2 ppm
- Stable within ±0.7 ppm window over 7 days of constant TEMP? %{color:#008800}PASS, 0.43 ppm
- Change less than ±0.5 ppm with TEMP? change 5°C PASS
- Stable within ±1.0 ppm window over 14 days of constant TEMP? PASS
Day 30: Calibration adjustment prior to final test
After stability check next step in repair is calibration adjustment and accuracy testing against know external references. Due to very tight specification for HP 3458A finding “good enough” is often a mighty challenge. However, this time opportunity to access stable and well aged Fluke 5700A and calibrated Fluke 732B & ESI SR104 standards was exploited. “Exploit” is correct word here, because meter was located in remote lab for few weeks, with wiring connected between 5700A and our DUT 3458A for days without interferences. Both instruments controlled by Raspberry Pi 3B via GPIB with linux-gpib and NI GPIB-USB-HS pod. Environment conditions were logged from Bosch BME280 THP sensor.
All equipment was left to warm up and stabilize few days before actual tests ran. Calibration was performed following guidelines in “HP 3458A Calibration manual”. Recently calibrated and well cared DC Standard Fluke 732B was used to execute DC gain calibration, ESI SR104 used for 10 KΩ adjustment, and setup with HP 3325A, Ballatine 1384 3V and 1V thermal converters with nanovoltmeter HP/Agilent/Keysight 34420A.
Day 33: Final calibration tests and report
Main DCV function performance test
Automated procedure on python linux-gpib application was used to perform verification of key multimeter functions.
Freshly calibrated and adjusted Fluke 5700A multifunction calibrator was used to perform a test. Both source and DUT 3458A multimeter were adjusted using manufacturer recommended procedures from service manuals.
Used standards in both adjustment and tests:
- Resistance standard IET SRL-1, Nominal 1 Ω, calibrated value 0.99997505 Ω, ± 0.17 ppm, Date 08/18/2016, due 08/18/2017
- Resistance standard ESI SR104, Nominal 10000 Ω, calibrated value 10000.0505 Ω, ± 0.17 ppm, Date 08/18/2016, due 08/18/2017
- Resistance standard xDevs.com, Nominal 1 GΩ, calibrated value 1.0015552 GΩ, ± 3800 ppm, Date 08/23/2016, due 08/23/2017
- Voltage standard Fluke 732B (#3), Nominal 10 VDC;, calibrated value 9.9999323 VDC, ± 0.56 ppm, age rate -0.000788 ppm/day, Date 08/23/2016, due 08/23/2017
- Signal Generator HP 3325B
This test however is NOT traceable calibration report and cannot be used as such for any legal purposes, it is mere indicator of equipment agreement, using these particular samples. Do not assume that measurement is correct just because meter and source are in agreement, account for uncertainty and all possible error sources. Refer to A Beginner’s Guide to Uncertainty of Measurement from NPL for better introduction on these aspects.
DMM settings used for DCV test are:
PRESET NORM
TARM HOLD
TRIG SGL
OFORMAT ASCII
AZERO ON
NRDGS 1,AUTO
MEM OFF
END ALWAYS
NDIG 9
NPLC 100
DELAY 0
DCV 1
Front terminals
For each test equipment was interconnected using Fluke recommended low-thermal cables, as per HP 3458A calibration manual. Calibrator was artifact-calibrated to SRL-1, SR104 and 732B, while 3458A was calibrated with SR104 and 732B.
| DCV -FS/FS | Reference | 3458B | Source unc. | Low Limit | Hi limit | Measured | 24hr | Result |
|---|---|---|---|---|---|---|---|---|
| 0.1 VDC | 0.100000 | 0.09999962 | 3.81 ppm | 0.099999069 | 0.100000931 | -3.75 ppm | 5.5 ppm | PASS 40.31 % |
| -0.1 VDC | -0.100000 | -0.09999991 | 3.81 ppm | -0.100000931 | -0.099999069 | -0.92 ppm | 5.5 ppm | PASS 9.94 % |
| 1.0 VDC | 1.000000 | 1.00000007 | 2.45 ppm | 0.99999575 | 1.00000425 | 0.06 ppm | 1.8 ppm | PASS 1.62 % |
| -1.0 VDC | -1.000000 | -1.00000003 | 2.45 ppm | -1.00000425 | -0.99999575 | 0.03 ppm | 1.8 ppm | PASS 0.71 % |
| 10 VDC | 10.000000 | 9.99999840 | 1.47 ppm | 9.9999798 | 10.0000202 | -0.16 ppm | 0.55 ppm | PASS 7.91 % |
| -10 VDC | -10.000000 | -9.99999754 | 1.47 ppm | -10.0000202 | -9.9999798 | -0.24 ppm | 0.55 ppm | PASS 12.19 % |
| 100 VDC | 100.000000 | 99.99996600 | 2.36 ppm | 99.999484 | 100.000516 | -0.34 ppm | 2.8 ppm | PASS 6.59 % |
| -100 VDC | -100.000000 | -99.99994760 | 2.36 ppm | -100.000516 | -99.999484 | -0.52 ppm | 2.8 ppm | PASS 10.16 % |
| 1000 VDC | 1000.000000 | 999.99982480 | 2.85 ppm | 999.98255 | 1000.01745 | -0.17 ppm | 2.6 ppm | PASS 1.00 % |
| -1000 VDC | -1000.000000 | -1000.00069300 | 2.85 ppm | -999.99345 | -1000.00655 | 0.69 ppm | 2.6 ppm | PASS 10.58 % |
Additional test of DCV linearity cross check between used source calibrator and 3458A, both on fixed 11V range.
| DCV Linearity | 10V Range | 3458B | Source unc. | Low Limit | Hi limit | Measured | 24hr | Result |
|---|---|---|---|---|---|---|---|---|
| 10.9999999 | 10.99999990 | 10.99999866 | 1.47 ppm | 10.999977680 | 11.000022120 | -0.113 ppm | 0.55 ppm | PASS 5.58 % |
| 9.999999 | 9.99999900 | 9.99999782 | 1.47 ppm | 9.999978800 | 10.000019200 | -0.118 ppm | 0.55 ppm | PASS 5.82 % |
| 8.888888 | 8.88888800 | 8.88888750 | 1.47 ppm | 8.888870044 | 8.888905956 | -0.057 ppm | 0.55 ppm | PASS 2.81 % |
| 7.777777 | 7.77777700 | 7.77777699 | 1.47 ppm | 7.777761289 | 7.777792711 | -0.001 ppm | 0.55 ppm | PASS 0.04 % |
| 6.666666 | 6.66666600 | 6.66666582 | 1.47 ppm | 6.666652533 | 6.666679467 | -0.026 ppm | 0.55 ppm | PASS 1.31 % |
| 5.555555 | 5.55555500 | 5.55555506 | 1.47 ppm | 5.555543778 | 5.555566222 | 0.010 ppm | 0.55 ppm | PASS 0.52 % |
| 4.444444 | 4.44444400 | 4.44444457 | 1.47 ppm | 4.444435022 | 4.444452978 | 0.129 ppm | 0.55 ppm | PASS 6.37 % |
| 3.333333 | 3.33333300 | 3.33333365 | 1.47 ppm | 3.333326267 | 3.333339733 | 0.195 ppm | 0.55 ppm | PASS 9.64 % |
| 2.222222 | 2.22222200 | 2.22222253 | 1.47 ppm | 2.222217511 | 2.222226489 | 0.240 ppm | 0.55 ppm | PASS 11.87 % |
| 1.111111 | 1.11111100 | 1.11111116 | 2.45 ppm | 1.111107667 | 1.111114333 | 0.141 ppm | 0.55 ppm | PASS 4.71 % |
| 0.123456789 | 0.12345679 | 0.12345642 | 9.91 ppm | 0.123455498 | 0.123458080 | -3.027 ppm | 0.55 ppm | PASS 28.94 % |
| -0.123456789 | -0.12345679 | -0.12345664 | 9.91 ppm | -0.123458080 | -0.123455498 | -1.243 ppm | 0.55 ppm | PASS 11.88 % |
| -1.111111 | -1.11111100 | -1.11111106 | 2.45 ppm | -1.111114333 | -1.111107667 | 0.058 ppm | 0.55 ppm | PASS 1.92 % |
| -2.222222 | -2.22222200 | -2.22222184 | 1.47 ppm | -2.222226489 | -2.222217511 | -0.070 ppm | 0.55 ppm | PASS 3.48 % |
| -3.333333 | -3.33333300 | -3.33333249 | 1.47 ppm | -3.333339733 | -3.333326267 | -0.154 ppm | 0.55 ppm | PASS 7.60 % |
| -4.444444 | -4.44444400 | -4.44444327 | 1.47 ppm | -4.444452978 | -4.444435022 | -0.164 ppm | 0.55 ppm | PASS 8.12 % |
| -5.555555 | -5.55555500 | -5.55555353 | 1.47 ppm | -5.555566222 | -5.555543778 | -0.265 ppm | 0.55 ppm | PASS 13.11 % |
| -6.666666 | -6.66666600 | -6.66666407 | 1.47 ppm | -6.666679467 | -6.666652533 | -0.290 ppm | 0.55 ppm | PASS 14.35 % |
| -7.777777 | -7.77777700 | -7.77777497 | 1.47 ppm | -7.777792711 | -7.777761289 | -0.261 ppm | 0.55 ppm | PASS 12.90 % |
| -8.888888 | -8.88888800 | -8.88888562 | 1.47 ppm | -8.888905956 | -8.888870044 | -0.268 ppm | 0.55 ppm | PASS 13.27 % |
| -9.999999 | -9.99999900 | -9.99999605 | 1.47 ppm | -10.000019200 | -9.999978800 | -0.295 ppm | 0.55 ppm | PASS 14.60 % |
| -10.9999999 | -10.99999990 | -10.99999784 | 1.47 ppm | -11.000022120 | -10.999977680 | -0.187 ppm | 0.55 ppm | PASS 9.27 % |
Resistance 4-wire function performance test
DMM settings used for OHMF test are:
PRESET NORM
TARM HOLD
TRIG SGL
OFORMAT ASCII
AZERO ON
NRDGS 1,AUTO
MEM OFF
END ALWAYS
NDIG 9
OCOMP 1
DELAY 5
NPLC 100
OHMF <resistance_value>
Front terminals, 4-wire connection to 5700A calibrator for ranges 10 Ω to 100 MΩ. 1 GΩ test was performed using separate standard in 2-wire OHM measurement mode, as calibrator cannot source this range.
| OHMF FS | Source value | 3458B | Source unc. | Low Limit | Hi limit | Measured | 24hr | Result |
|---|---|---|---|---|---|---|---|---|
| 1 Ω | 0.99979810 | 0.99979858 | 40.20 ppm | 0.99974990 | 0.99984629 | 0.48 ppm | 8 ppm | PASS 1.00 % |
| 10 Ω | 9.9999070 | 9.9998924 | 8.30 ppm | 9.99974400 | 10.0000699 | -1.46 ppm | 8 ppm | PASS 8.98 % |
| 100 Ω | 100.00163 | 100.00171 | 4.30 ppm | 100.000599 | 100.002660 | 0.84 ppm | 6 ppm | PASS 8.19 % |
| 1.0 kΩ | 0.99999100 k | 999.99132 | 3.30 ppm | 999.985500 | 999.996499 | 0.32 ppm | 2.2 ppm | PASS 5.87 % |
| 10 kΩ | 10.000081 k | 10000.075 | 3.30 ppm | 10000.0259 | 10000.1360 | -0.62 ppm | 2.2 ppm | PASS 11.25 % |
| 100 kΩ | 100.00138 k | 100001.08 | 3.30 ppm | 100000.829 | 100001.930 | -3.01 ppm | 2.2 ppm | PASS 54.80 % |
| 1.0 MΩ | 1.0000025 M | 999996.33 | 5.30 ppm | 999986.199 | 1000018.80 | -6.17 ppm | 11 ppm | PASS 37.86 % |
| 10 MΩ | 9.9994040 M | 9998988.1 | 14.30 ppm | 9998711.04 | 10000096.9 | -41.59 ppm | 55 ppm | PASS 60.02 % |
| 100 MΩ | 100.00913 M | 1.0001333E+08 | 60.30 ppm | 99952094.7 | 100066165 | 42.01 ppm | 510 ppm | PASS 7.37 % |
| 1 GΩ STD | 0.99551672 G | 9.9705412E+08 | 30000.0 ppm | 960663679 | 1030369760 | 1544.33 ppm | 5010 ppm | PASS 4.41 % |
DC Current function performance test
DMM settings used for DCI test are:
PRESET NORM
TARM HOLD
TRIG SGL
OFORMAT ASCII
AZERO ON
NRDGS 1,AUTO
MEM OFF
END ALWAYS
NDIG 9
NPLC 100
DELAY 0
DCI <value>
Front terminals used, AUX output on calibrator.
| DCI Test | 10 µA-1A | 3458B | Source unc. | Low Limit | Hi limit | Measured | 24h spec | Result |
|---|---|---|---|---|---|---|---|---|
| 10 µADC | 1E-05 | 1.0000317E-05 | 71.36 ppm | 9.9991164e-06 | 1.00008836e-05 | 31.6 ppm | 17 ppm | PASS 35.83 % |
| -10 µADC | -1E-05 | -9.9996183E-06 | 71.36 ppm | -1.00008836e-05 | -9.9991164e-06 | -38.1 ppm | 17 ppm | PASS 43.20 % |
| 100 µADC | 0.0001 | 9.9999772E-05 | 71.36 ppm | 9.9991264e-05 | 0.000100008736 | -2.2 ppm | 16 ppm | PASS 2.61 % |
| -100 µADC | -0.0001 | -9.9999499E-05 | 71.36 ppm | -0.000100008736 | -9.9991264e-05 | -5.0 ppm | 16 ppm | PASS 5.73 % |
| 1.0 mADC | 0.001 | 0.00099998491 | 38.63 ppm | 0.00099994737 | 0.00100005263 | -15.1 ppm | 14 ppm | PASS 28.68 % |
| -1.0 mADC | -0.001 | -0.0010000138 | 38.63 ppm | -0.00100005263 | -0.00099994737 | 13.8 ppm | 14 ppm | PASS 26.20 % |
| 10 mADC | 0.01 | 0.0099999641 | 38.63 ppm | 0.0099994737 | 0.0100005263 | -3.6 ppm | 14 ppm | PASS 6.82 % |
| -10 mADC | -0.01 | -0.010000012 | 38.63 ppm | -0.0100005263 | -0.0099994737 | 1.2 ppm | 14 ppm | PASS 2.32 % |
| 100 mADC | 0.1 | 0.099999436 | 48.63 ppm | 0.099992237 | 0.100007763 | -5.6 ppm | 29 ppm | PASS 7.26 % |
| -100 mADC | -0.1 | -0.10000019 | 48.63 ppm | -0.100007763 | -0.099992237 | 1.8 ppm | 29 ppm | PASS 2.39 % |
| 1.0 ADC | 1 | 1.0000164 | 71.36 ppm | 0.99981864 | 1.00018136 | 16.4 ppm | 110 ppm | PASS 9.03 % |
| -1.0 ADC | -1 | -1.0000227 | 71.36 ppm | -1.00018136 | -0.99981864 | 22.7 ppm | 110 ppm | PASS 12.50 % |
Because same artifact standards were used for both 3458A DUT and source calibrator, only relative accuracy specifications can be used for performance test. Properly operating equipment expected to be stable and meet all 24-hour specifications, as whole test suite takes less time. This enabled to perform more difficult performance verification against 24-hour relative specification of the 3458A. All major points passed well under 60% of the specified error, which help to build confidence of proper multimeter operation and accuracy of its artifact calibration.
Day 40-50: Comparisons to other xDevs.com lab gear
| Standard under test | HP 3458A #1 | This HP 3458A #2 | K2002 #1 | K2002 #2 |
|---|---|---|---|---|
| HI/LO Bias current, 10 DCV, AZERO OFF, ARM HALT | pA | pA | pA | pA |
| +7.1846680 VDC, LTZ1000A, HP A9 STD | +7.1846284 [-5.51 ppm] | +7.1846288 [-5.45 ppm] | +7.1846272 [-5.67 ppm] | +7.1846243 [-6.08 ppm] |
| +7.1298358 VDC, LTZ1000A, KX module | +7.1298212 [-2.04 ppm] | +7.1298214 [-2.02 ppm] | +7.1298195 [-2.29 ppm] | +7.1298161 [-2.76 ppm] |
| +7.1366740 VDC, LTZ1000A, KX module | +7.1366613 [-1.78 ppm] | +7.1366595 [-2.03 ppm] | +7.1366599 [-1.97 ppm] | +7.1366570 [-2.38 ppm] |
| +7.1366450 VDC, LTZ1000A, KX module | +7.1366414 [-0.50 ppm] | +7.1366398 [-0.73 ppm] | +7.1366397 [-0.74 ppm] | +7.1366368 [-1.15 ppm] |
| 10V DCV, LTZ1000A, HP 3245A | +9.9999596 [-4.04 ppm] | +9.9999567 [-4.33 ppm] | +9.9999643 [-3.57 ppm] | +9.9999512 [-4.88 ppm] |
| 10.00001 KΩ, VPG VHD200 #1 | 10000.024 Ω [1.4 ppm] | |||
| 9.999894 KΩ in G9330 body, VPG VHP202 | NT | 9999.892 Ω [-0.3 ppm] | ||
| 0.997091 GΩ, DIY STD with Ohmite MOX1125-23 |
Table 7: Comparisons with our previous 8½-digit DMMs
Day 52: Minor fixes and touch-up
As all functions and operation is confirmed good, I also performed some last minor fixes, such as replacement of all electrolytic capacitors on A6 and A4 power supply boards, replacement of Schaffner mains filter, fan replacement and new front panel installation.
These still intrusive tasks were done after all calibration transfers and main standards measured, to ensure minimal errors on calibration accuracy. Usually any disassembly or repairs, even minor as fan replacement are big no-no after final calibration is done. And exception to this very good rule can be made only if you really know what are the results and ready to loose calibration accuracy. These are not an issue for 1% accurate tool, but remember, no detail is minor once we talking about 1ppm (0.0001%) accuracy!
Day 394: Comparison of ACV performance versus 5790A
SYNC ACV functionality was tested versus previously calibrated Wavetek 4920M together with fixed Fluke 5790A.
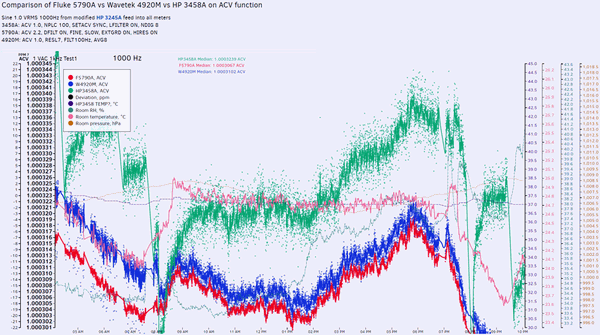
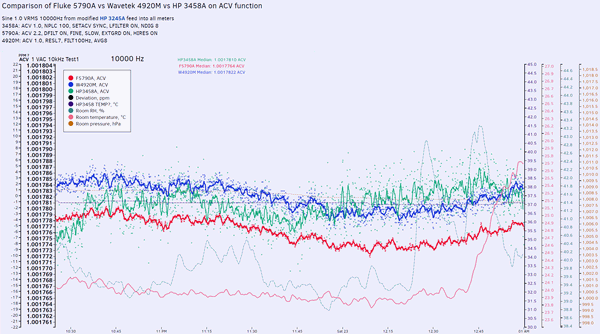
Image 62: Testing AC voltage vs /fix/f5790a/ 5790A and /fix/w4920m/ 4920M.
At 1 VAC 1 kHz signal Wavetek 4920M and 5790A are very close in terms of stability and noise. HP 3458A DMM provides about 3 times larger noise.
With 10 kHz signal frequency difference between the meters is even smaller. Note delta between Wavetek and 5790A is just 6 ppms!
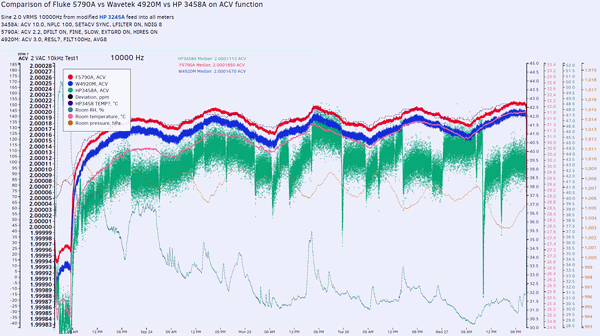
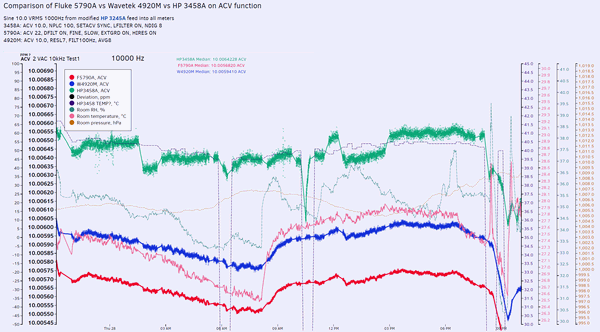
Image 63: Testing AC voltage vs /fix/f5790a/ 5790A and /fix/w4920m/ 4920M.
Long 2 VAC 10 kHz signal follow similar pattern, with little noisier Wavetek 4920M and much larger noise of 3458A. Jumps visible at HP meter data are result of frequent ACAL ALL routine. 10 VAC looks good too.
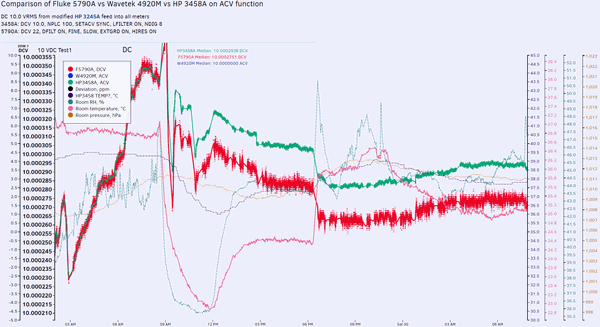
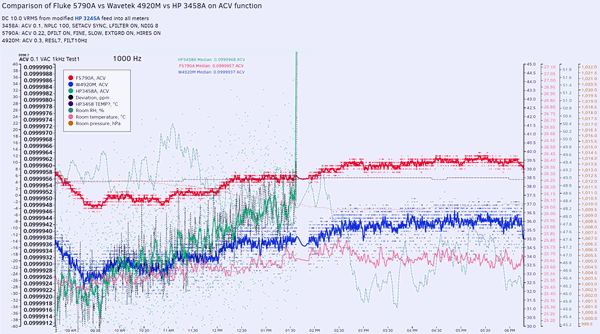
Image 64: Testing AC voltage vs /fix/f5790a/ 5790A and /fix/w4920m/ 4920M.
10 VDC measured by HP 3458A and Fluke 5790A reveals stronghold of 8½ HP performance. Small level signal 100 mVAC 1 kHz show good performance of Fluke AVMS, multiple times less noise than the competition meters.
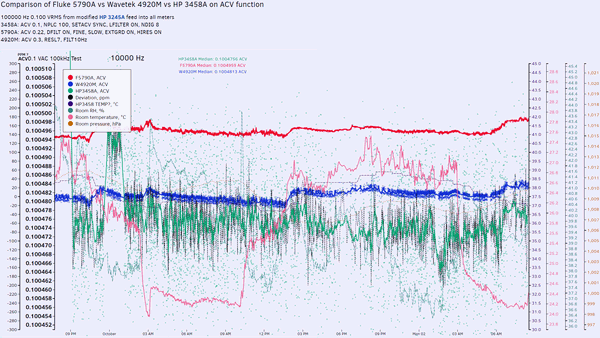
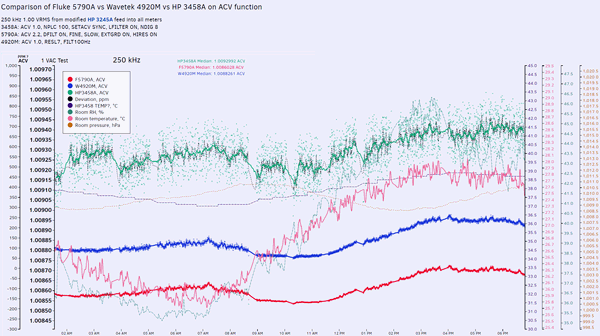
Image 65: Testing AC voltage vs /fix/f5790a/ 5790A and /fix/w4920m/ 4920M.
At 100 kHz frequency difference is large too. 1 VAC 250 kHz looks relatively clean on all meters.
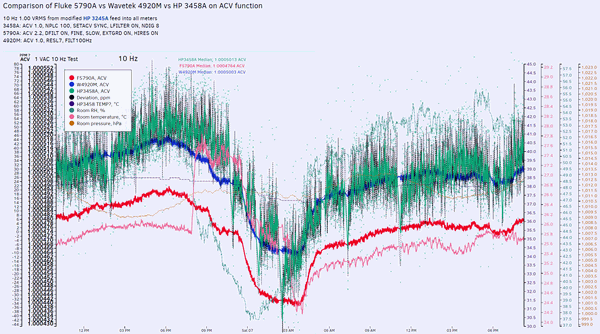
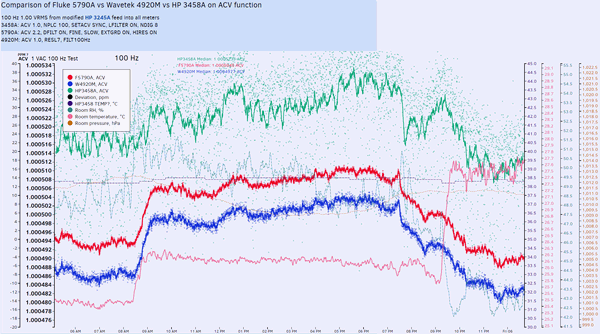
Image 66: Testing AC voltage vs /fix/f5790a/ 5790A and /fix/w4920m/ 4920M.
Low 10 and 100 Hz frequencies begin to be a challenge for HP 3458A, but no problems for Wavetek 4920M and Fluke 5790A.
Day 550: Front-panel connector replacement and cleaning
Time fly fast, and it is time to some minor service, one and half year since this meter was restored for use. In July 2018 we got just calibrated primary standards back to lab, in form of Fluke SL935 1 Ω and 10 KΩ resistance reference and Wavetek 7000 1V/10V DC voltage reference. This allow to do check of this 3458A performance test, perform long overdue damaged front terminal block replacement to brand new Keysight 03458-44115 and resulting recalibration tests.
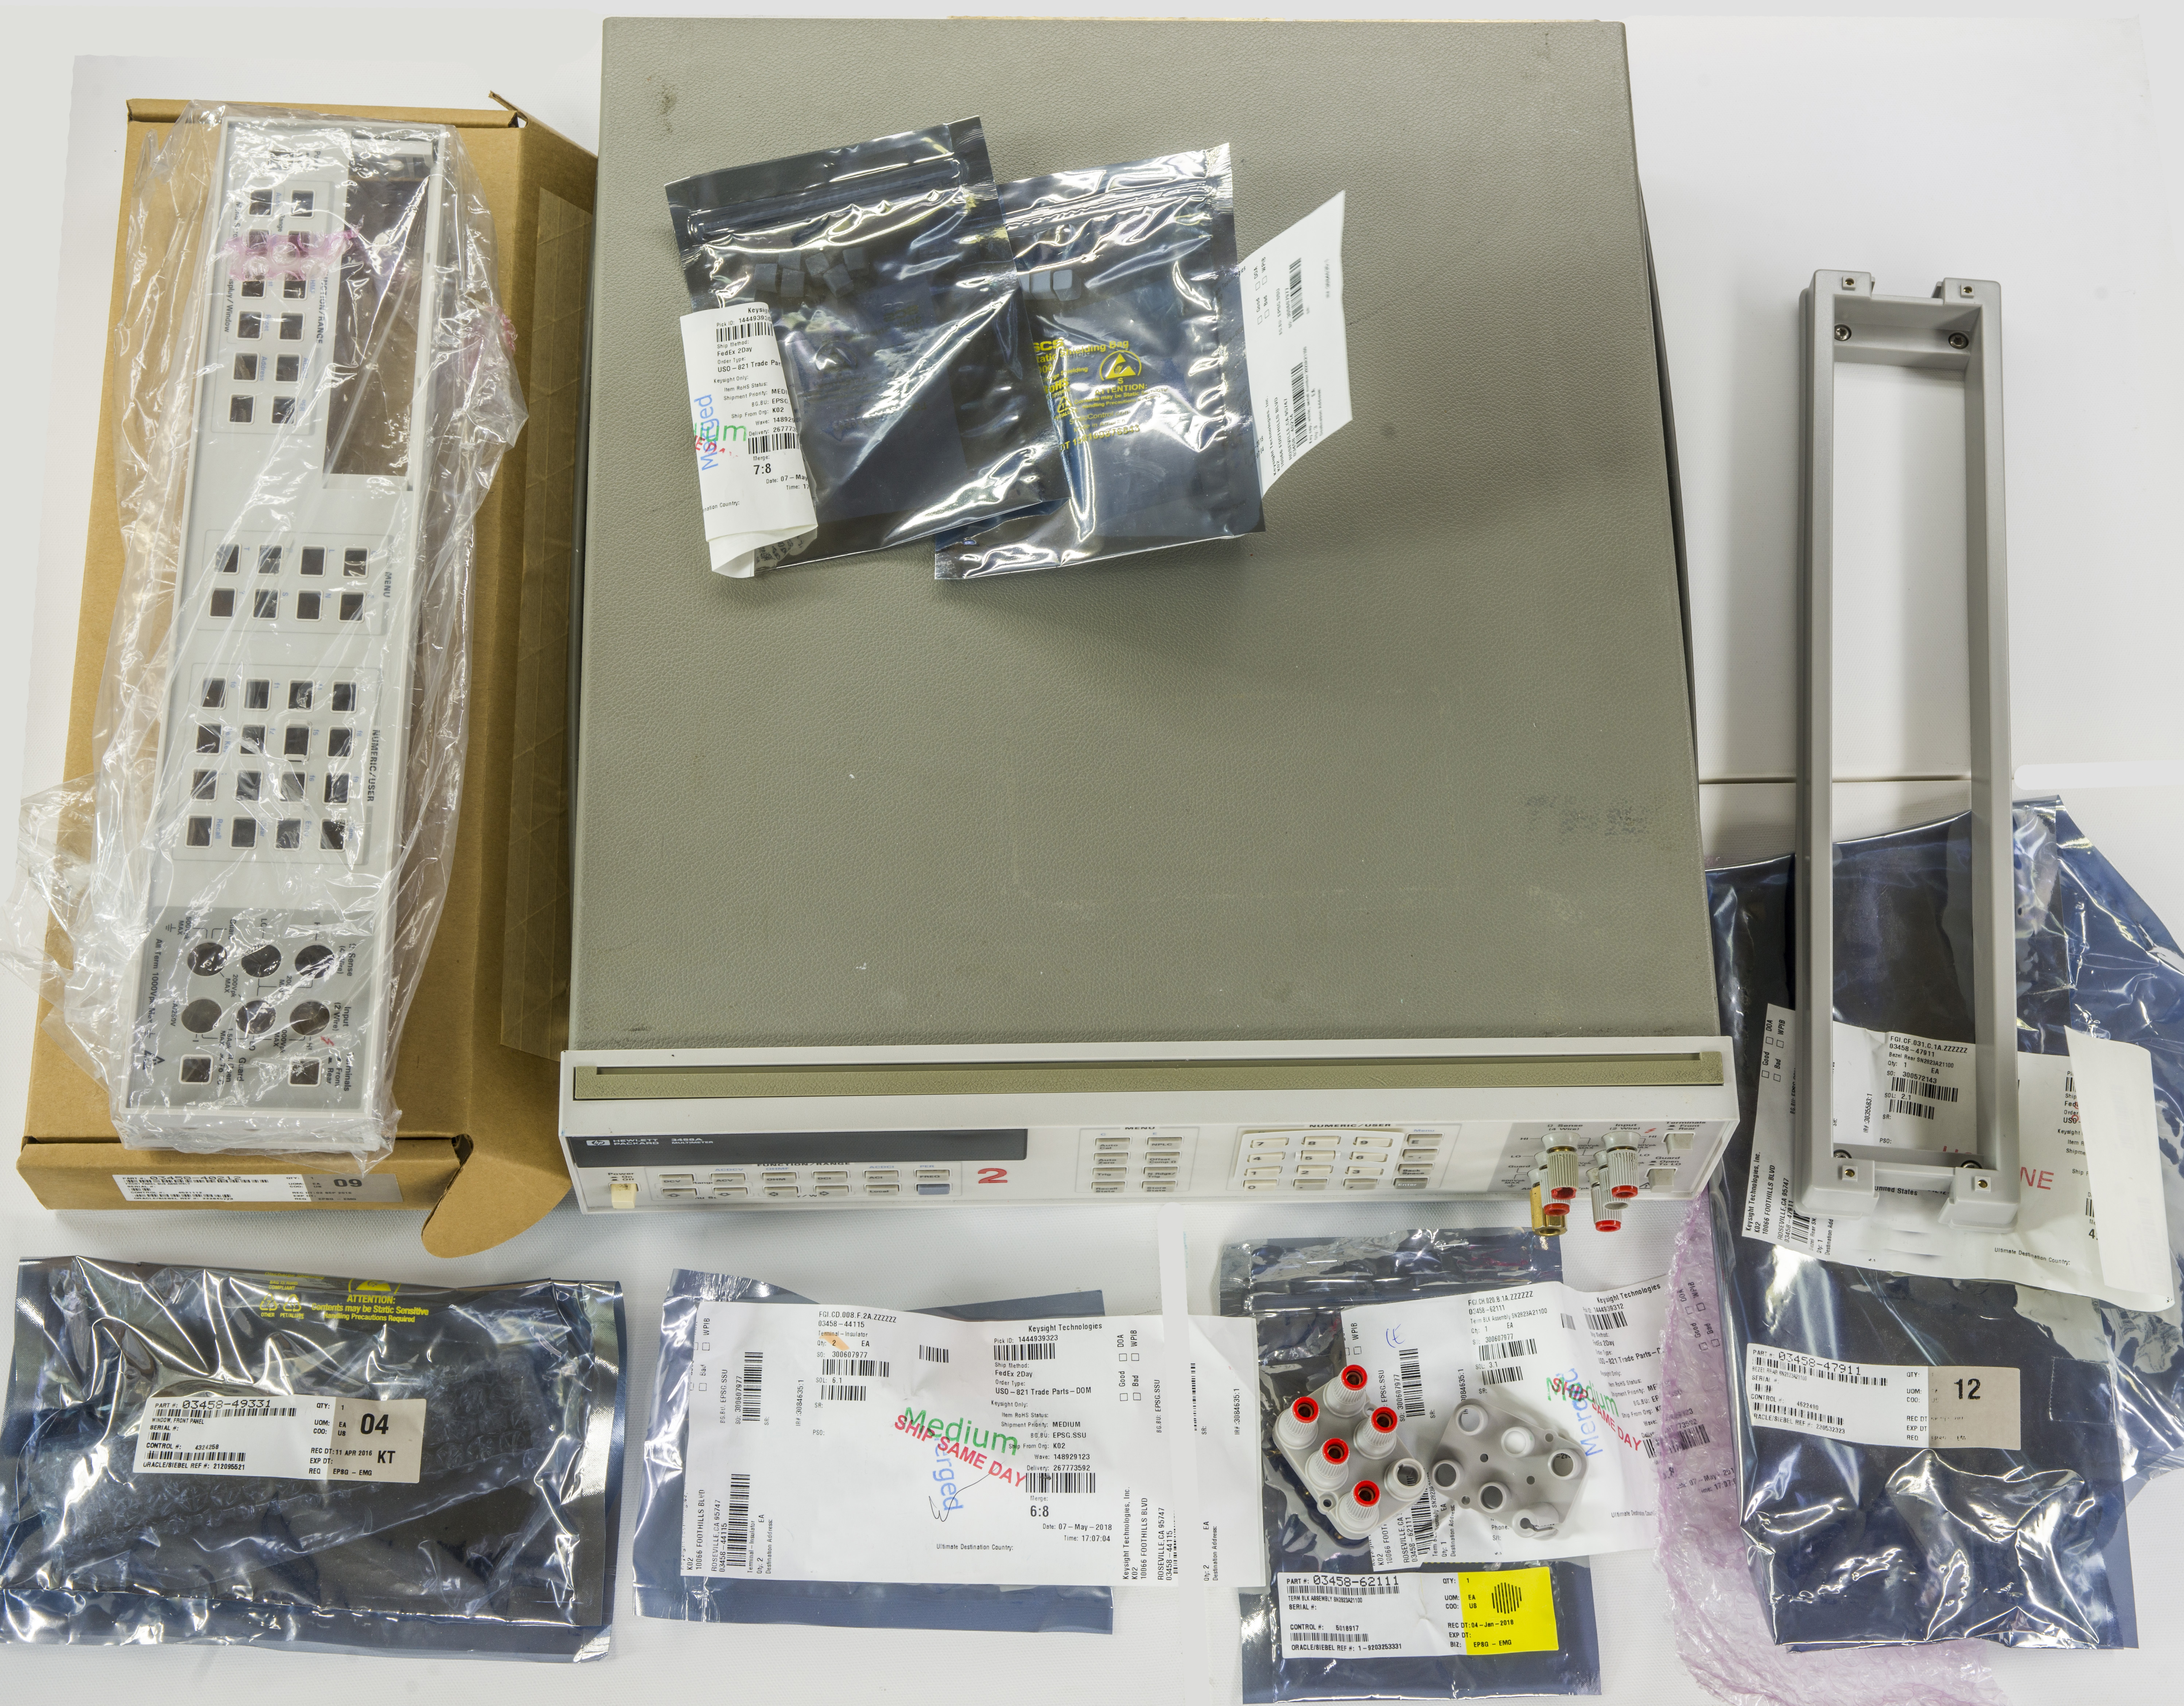
Image 67: DMM with spare parts for refresh.
Thermal infrared images
Thermal analysis and understanding of hot spots and thermal gradients present in metrology-level instrument like HP/Agilent/Keysight 3458A is vital to achieve stable and repeatable ppm-level performance.
HP engineers spend significant amount of resources for overall system design with thermal zoning in play. It is not easy to see this at first glance, but thanks to thermal imagery there are ways to grasp overall key areas of focus. Procedure of capturing images below was next:
- Meter warmed up for over 24 hours in +25°C ±2°C environment.
- Outer covers were inplace to ensure thermal distribution as by design.
- Top cover was removed and thermal photos of A1,A9,A5,A4 boards taken within first 3 minutes by Fluke Ti32 camera.
- Cover installed back, meter rotated upside and left for 20 minutes to stabilize.
- Bottom cover removed, photos of A6,A3,A2,A4 taken within 3 minutes.
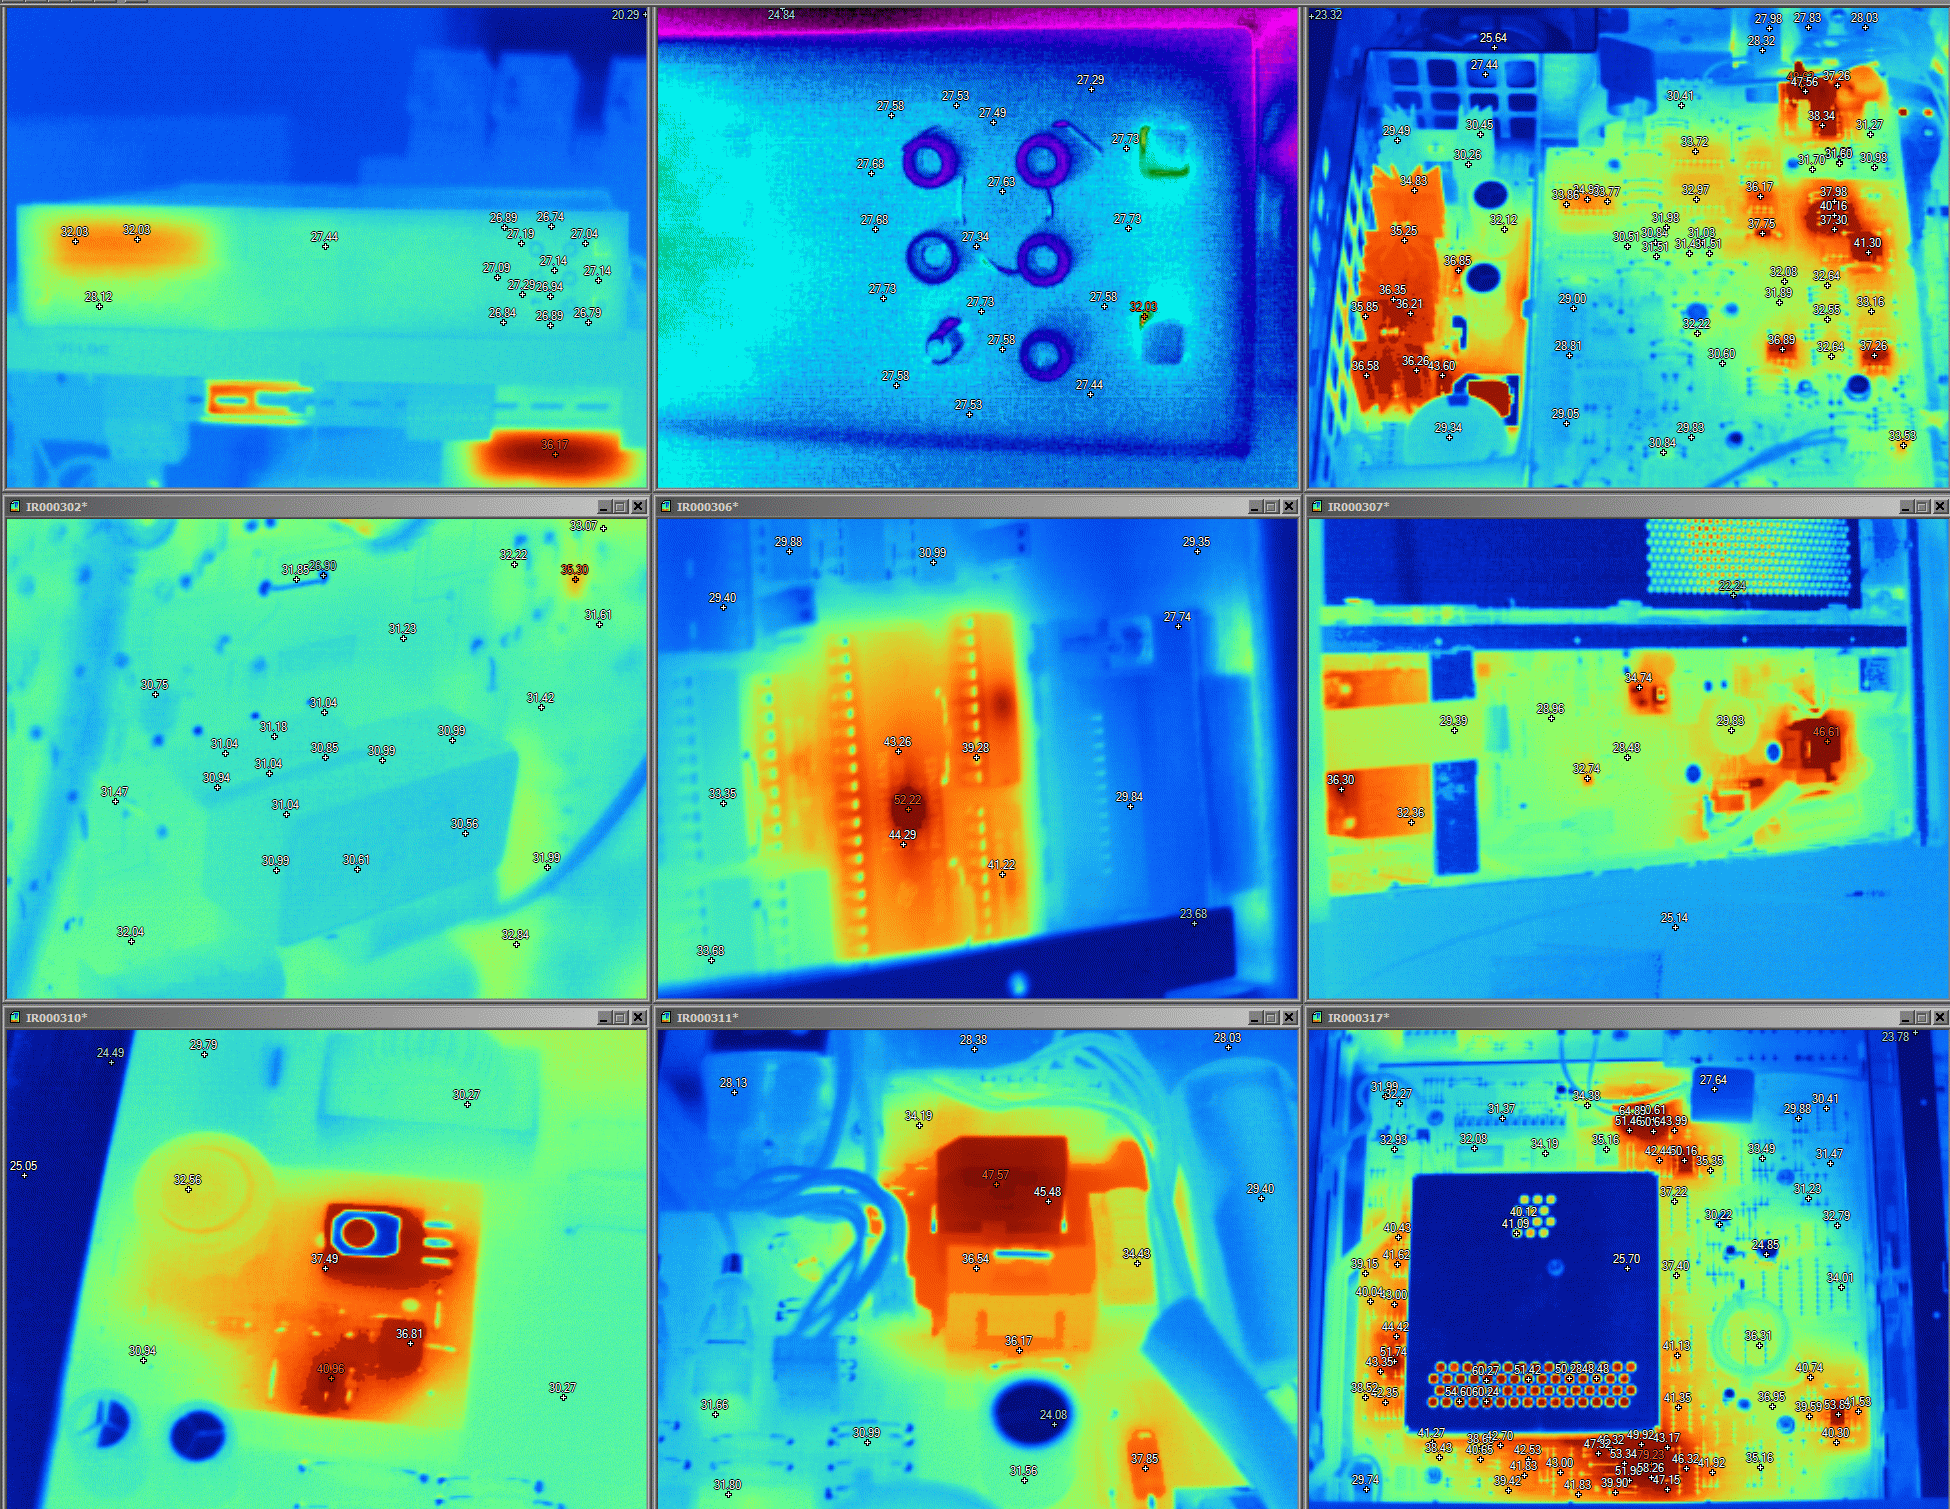
Image 68: Infrared photo captures
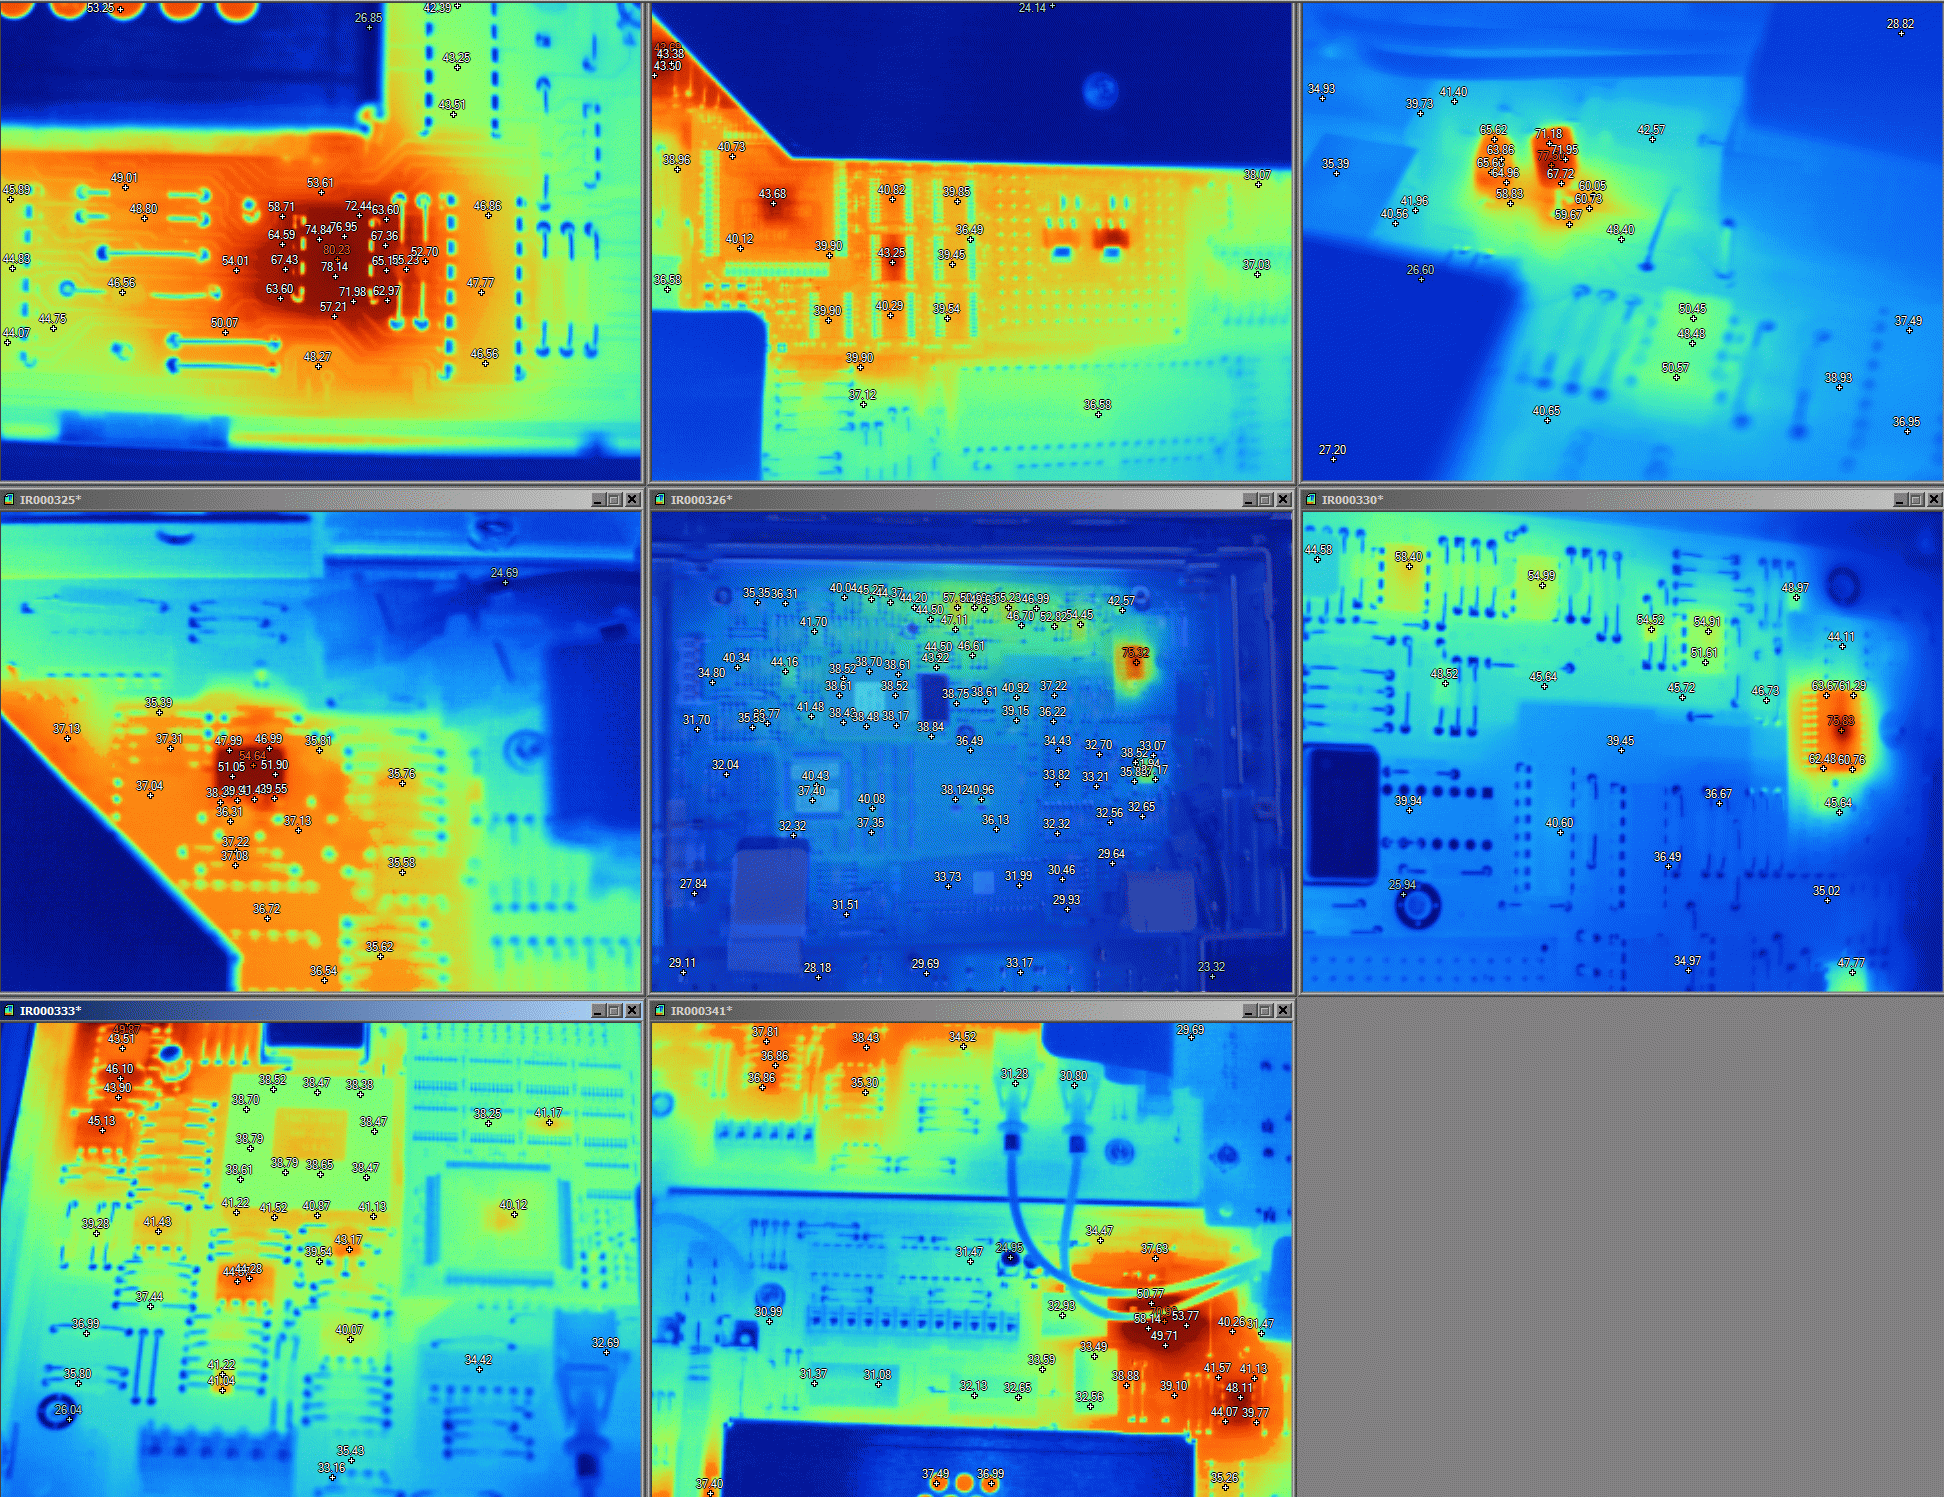
Image 69: More infrared photos
Summary
Goal of getting second 3458A in order was achieved, even though actual final effort and cost was way over initial estimated numbers. This is a good lesson to possible volt-nuts, as buying such instrument for low $500 looked like a bargain at first glance, but quickly turned into significant repair expense. It was not unexpected on my part, but there were hopes to avoid expensive A3 board swap.
And this is not considering calibration cost or getting 3458A on Keysight warranty program (which is pricey, but well worth for such expensive instrument). I was lucky to have temporary access to standards and stable calibrator, such as Fluke 5700A to perform own adjustments and calibrations. This also helped to obtain yet another international transfer for DC voltage, resistance and DC current as well as AC calibration for my home lab.
Performing such transfers is key importance to any calibration facility, be it official accredited laboratory or little hobbyist dungeon like mine. Metrology bodies like NIST, NIM, PTB doing same equipment swaps for their “travel” standards and even intrinsic Josephson Voltage standards to build up and maintain confidence in their equipment accuracy and stability. And using 3458A is second-best option (transfer of primary standards would be more accurate, but yet much more risky to ship over half-world) to do simpler transfers thanks to full calibration from just 10 VDC and 10 KΩ reference levels + AC/TVC correction for &mt;1MHz AC.
Project cost:
| Item | Cost | Shipping | Supplier |
|---|---|---|---|
| Dead HP 3458A with chewed FP and no A5 PCBA | 520$ | 190$ | eBay |
| HP 3458A Outguard controller PCBA, Rev.B | 400$ | N/A | eBay |
| Dallas/MAXIM NVRAMs 1 x DS1220, 2 x DS1230 | 80$ | N/A | Maxim |
| Keysight P/N | Cost | Qty | |
| 03458-40212 Front Panel Sub Assembly | $97.50 | 1 | |
| 03458-47911 Rear plastic bezel | $76.23 | 1 | |
| 03458-49331 Window, Front Panel | $26.00 | 1 | |
| 03458-44115 Front terminal block | $229.00 | 1 | |
| 03458-40214 Key cap, white, serial number 2823A21100 and above | $19.80 | 1 | |
| 03458-66513 TBR Analog to Digital In-guard PCA | $1306 | 1 | |
Table 9: Replacement parts orders
Total restoration cost for this meter: $2944.53 USD. Not cheap by any measure, yet still in range of secondary-market value.
| Date | Activity | Time spent |
|---|---|---|
| 10/28/2016 | Received unit, initial teardown and checks | 3 hour |
| 10/29/2016 | Disassembly and diagnostic checks | 2 hour |
| 11/6/2016 | Troubleshooting A2/A3 | 8 hour |
| 11/11/2016 | Test A1 with good A2/A3 | 3 hour |
| 18/12/2016 | Testing SN18 start with replaced A3 | 8 hour |
| 18/12/2016 | Testing SN18 start with replaced A3 | 8 hour |
| 20/12/2016 | Modified A9 to lower reference oven temperature with 15KΩ VAR | 3 hour |
| 31/12/2016 | Meter confirmed good and stable, ready for calibrations | 30 hours |
| 04/01/2017 | Calibration complete with F732B,SR104 and HP3325A+TVC+F8920A | 20 hours |
| 05/01/2017 | Calibration report generated using 24h calibrated Fluke 5700A | 8 hours |
| 06/30/2018 | Replacement of front binding posts and minor cleanup | 8 hours |
| 2016-2018 | Documentation, photos, calibrations, article write-up | 75 hours |
Table 10: Timelog summary
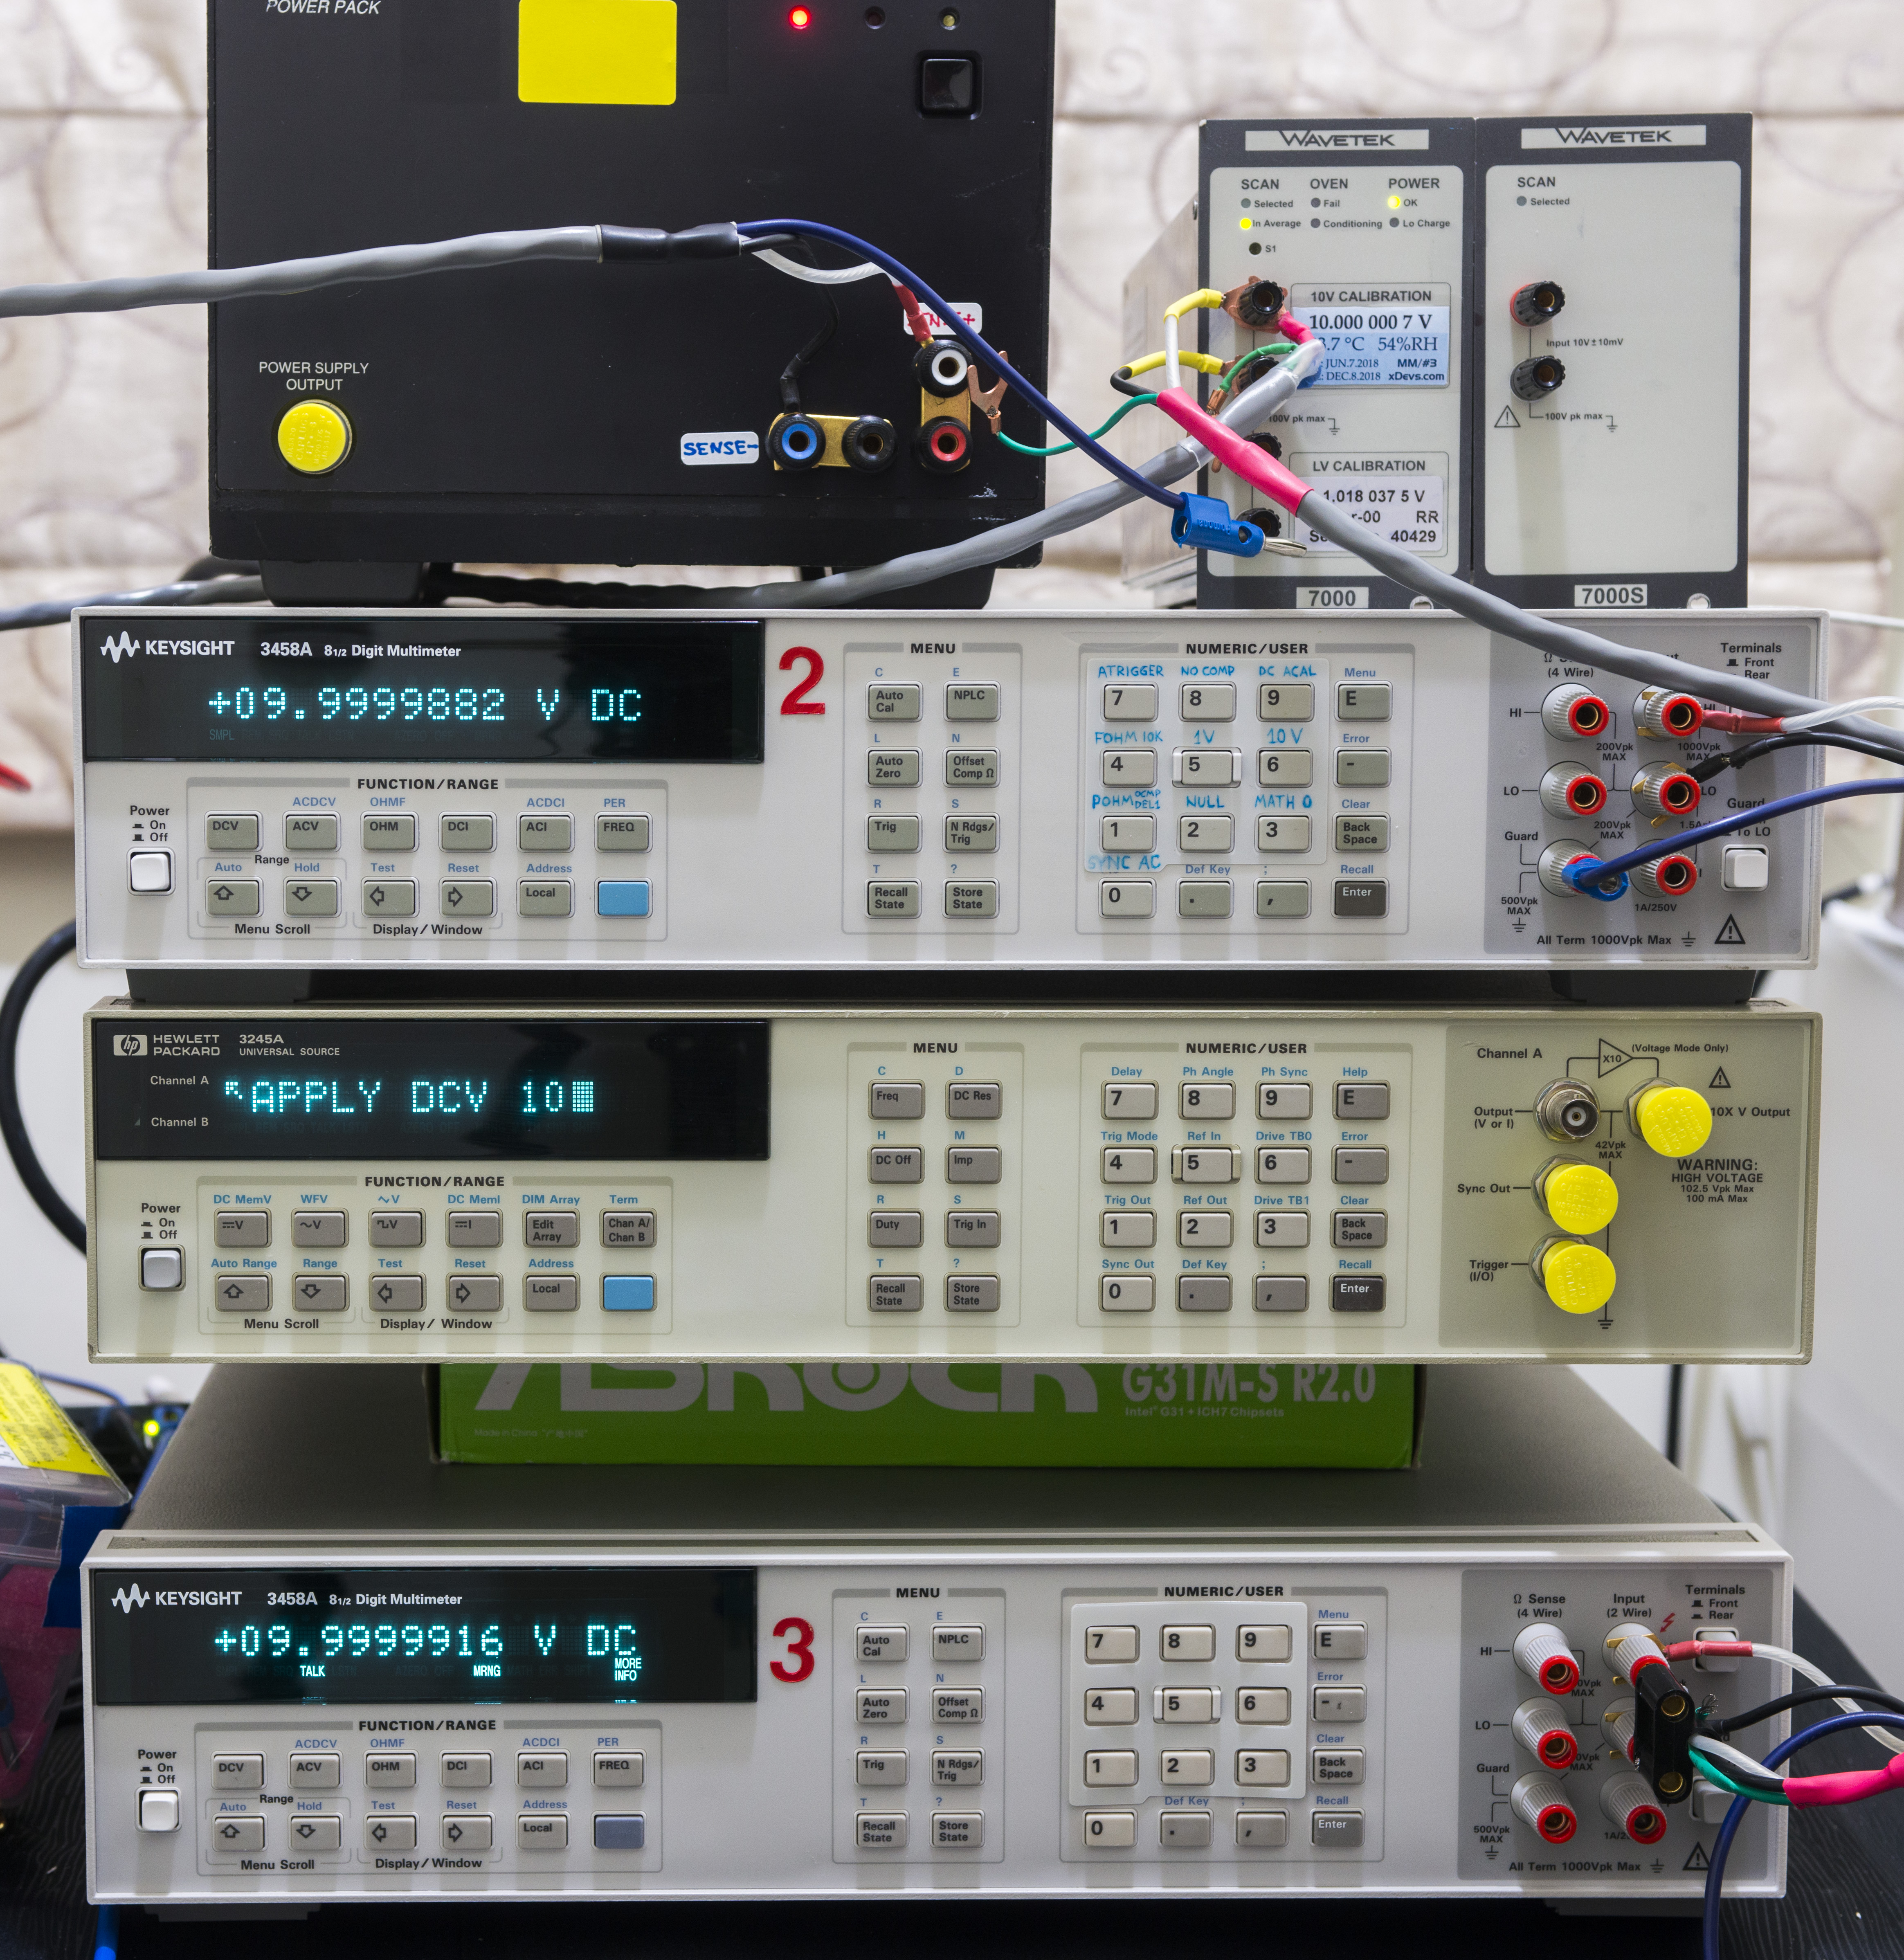
Image 70: Happy stack, measuring Wavetek 7000 output.
I would like to express my gratitude and appreciation to supporters of this project: Todd Micaleff, Dr.Frank, pipelie, Kleinstein, plesa and of course all our readers. Stay tuned, many more interesting ideas will be in testing, using fresh duo of Keysight 3458A and Keithley 2002’s.
Discussion about this article and related stuff is welcome in comment section or at our own IRC chat server: irc.xdevs.com (standard port 6667, channel: #xDevs.com). Web-interface for access mirrored on this page.
Modified: March 30, 2020, 6:15 a.m.