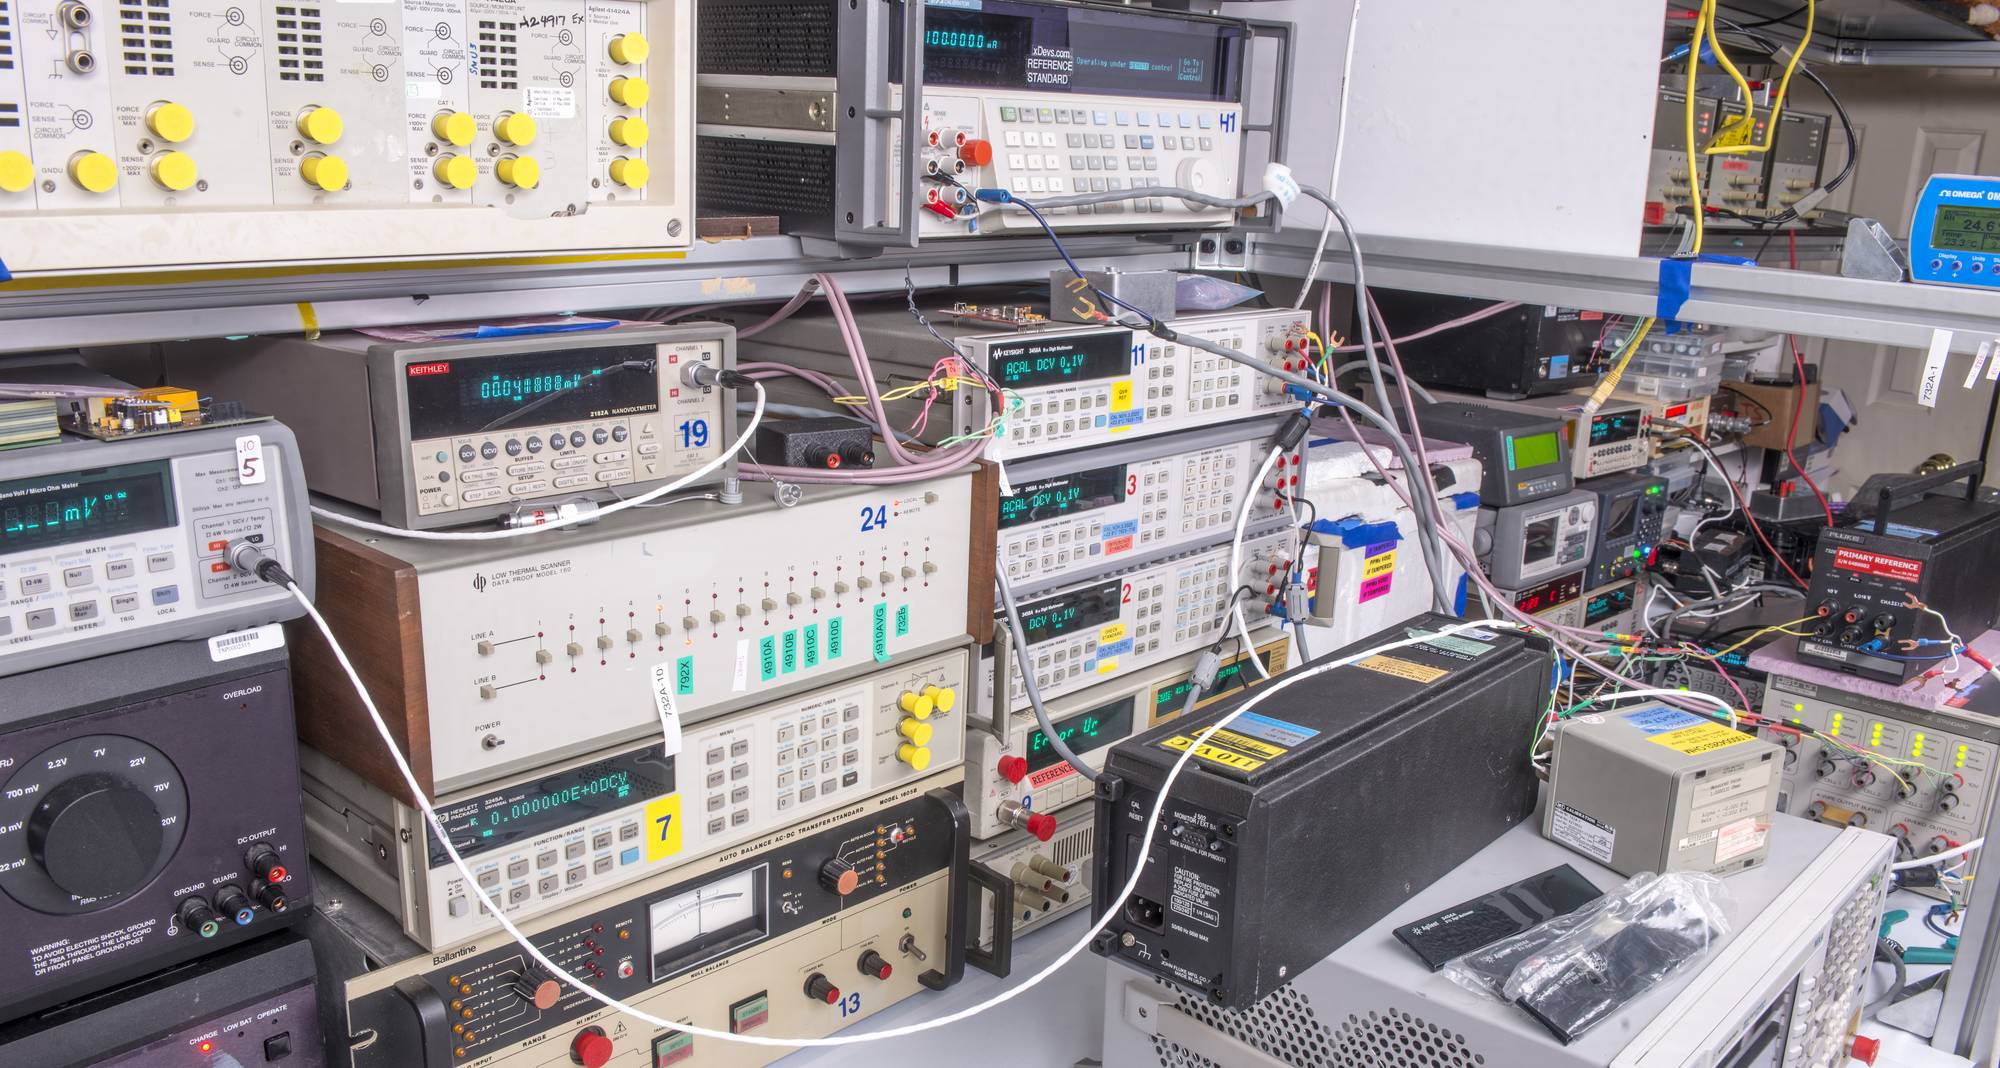
Datalog run GPIB code running on Pi3 + E5810A with DP160 scanner + 2182A and five 3458As
Photo of measurement setup:
Result CSV-data
Workflow:
* RPI accesses DMMs via GPIB and reads data.* Data is formatted by python script into DSV string and written/append to file on FTP
* DSV-file is visible publicly on https://xdevs.com/datashort/
* Page http://xdevs.com/datalog_mm/ runs D3.js javascript library to read DSV file test.log to input data
* D3.js plots SVG graph online :)