![]()
![]()
![]()
![]()
![]()
![]()
![]()
![]()
![]()
![]()
![]()
- Intro
- Disclaimer
- Fluke SL935 idea
- Manuals
- Design and construction
- Restoration
- Calibration procedure
- Temperature coefficient performance
- Temperature coefficient results with oven
- Live temperature corrected standard resistance calculator
- Our own internal calibration measurement data results, 2018
- Calibration reports
- Long term drift, performance summary & conclusion
Intro
Following up with metrology-level test equipment collection, I got unique chance to acquire something rare, Fluke SL935 prototype module. This unit has serial number 001, and there are high chances it is only one in the world. There was no information or mention anywhere in Fluke documentation or Internet, so this is our exclusive chance to play with this special box.
Disclaimer
Redistribution and use of this article or any images or files referenced in it, in source and binary forms, with or without modification, are permitted provided that the following conditions are met:
- Redistributions of article must retain the above copyright notice, this list of conditions, link to this page (https://xdevs.com/article/fsl935/) and the following disclaimer.
- Redistributions of files in binary form must reproduce the above copyright notice, this list of conditions, link to this page (https://xdevs.com/article/fsl935/), and the following disclaimer in the documentation and/or other materials provided with the distribution, for example Readme file.
All information posted here is hosted just for education purposes and provided AS IS. In no event shall the author, xDevs.com site, or Fluke or any other 3rd party be liable for any special, direct, indirect, or consequential damages or any damages whatsoever resulting from loss of use, data or profits, whether in an action of contract, negligence or other tortuous action, arising out of or in connection with the use or performance of information published here.
If you willing to contribute or have interesting documentation to share regarding pressure measurements or metrology and electronics in general, you can do so by following these simple instructions.
Fluke SL935 idea
SL935 is 1 Ω and 10 KΩ Resistance Standard prototyped in Fluke 732B chassis by some Fluke calibration facility. Reason to think so is use of no less than 14 precision custom thin-film networks from Fluke 5700A calibrator. Most of them have same manufacturing date and week (beginning of 1993), so these came from calibrator service facility or Fluke’s spare parts inventory. It would be difficult for any hobby-level enthusiast to get this amount of precision custom components, due to cost of even broken and destroyed 57XX series calibrators. Not mentioning requirement to have expensive Fluke 732B available to use as donor for parts.
We can confirm it’s based on Fluke 732B chassis, as same oven and front panel are used. Prototype with S/N 001 has nameplate label sticked on top of 732B panel to cover original DC standard silkscreen.
Manuals and comparison to production standards
There are no manuals for Fluke SL935 prototype available, so here are other products relevant information which can be helpful.
Fluke 732B/734A DC voltage standard instruction manual
Fluke 742A series Resistance Standard instruction manual
ESI SR104 10KΩ Resistance Standard instruction manual
IET SRL-1 Resistance standard datasheet
Fluke 5700A MFC Service Manual with schematics, Rev.9,3/96, March 1996
Fluke 5700A Series II/5720A MFC Service Manual with schematics, Rev.1,3/02, June 1996
An evaluation of the 5700A Series II Artifact Calibration
Comparison for known specifications of production resistance standards:
| Specification | Fluke SL935 | Fluke 742A-1 | Fluke 742A-10K | ESI/IET SR104 | IET SRL-1 |
|---|---|---|---|---|---|
| Output resistance | 1 Ω and 10 KΩ | 1 Ω | 10 KΩ | 10 KΩ | 1 Ω |
| Accuracy (1y) | +60 ppm, -3 ppm | ±2 ppm | ±2 ppm | ±1 ppm | ±2 ppm |
| Temperature coefficient, ppm | <0.05 ppm/°C, <0.05 ppm/°C | ±3 ppm | ±1.5 ppm | <±0.1 ppm/°C | ±3 ppm max (18-28°C) |
| Long term 1 year stability, ppm | ? , ? | ±8 ppm | ±4 ppm | ±0.5 ppm | ±2 ppm |
| Max load current | 100mA, 500µA | 200 mA | 600 µA | 10 mA | 418 mA |
| Construction type | Hermetic Fluke film networks | Precision wire-wound | Wirewound resistor in oil tank | Precision wire-wound | |
| Active thermal compensation | Yes, +35 °C oven assembly | None | Thermistor in oil tank | None | |
| Temperature sensor | Yes, 100 KΩ thermistor | No | No | Yes, 10 KΩ thermistor | No |
| Power requirements | AC mains or +12VDC 300mA | Not required, passive device | |||
| Backup/offline power supply | Internal 7.0 Ah +12V VRLA | Not required, passive device | |||
| Dimensions, weight | 86 × 105 × 127 mm, 910g | 254 × 206 × 311 mm, 4.8kg | 86 × 105 × 127 mm, 730g | ||
| MSRP | N/A, Prototype | $3600 USD | $3600 USD | $7147 USD | $1974 USD |
Table 1. Hi-end resistance standards, brief specification list
Design and construction
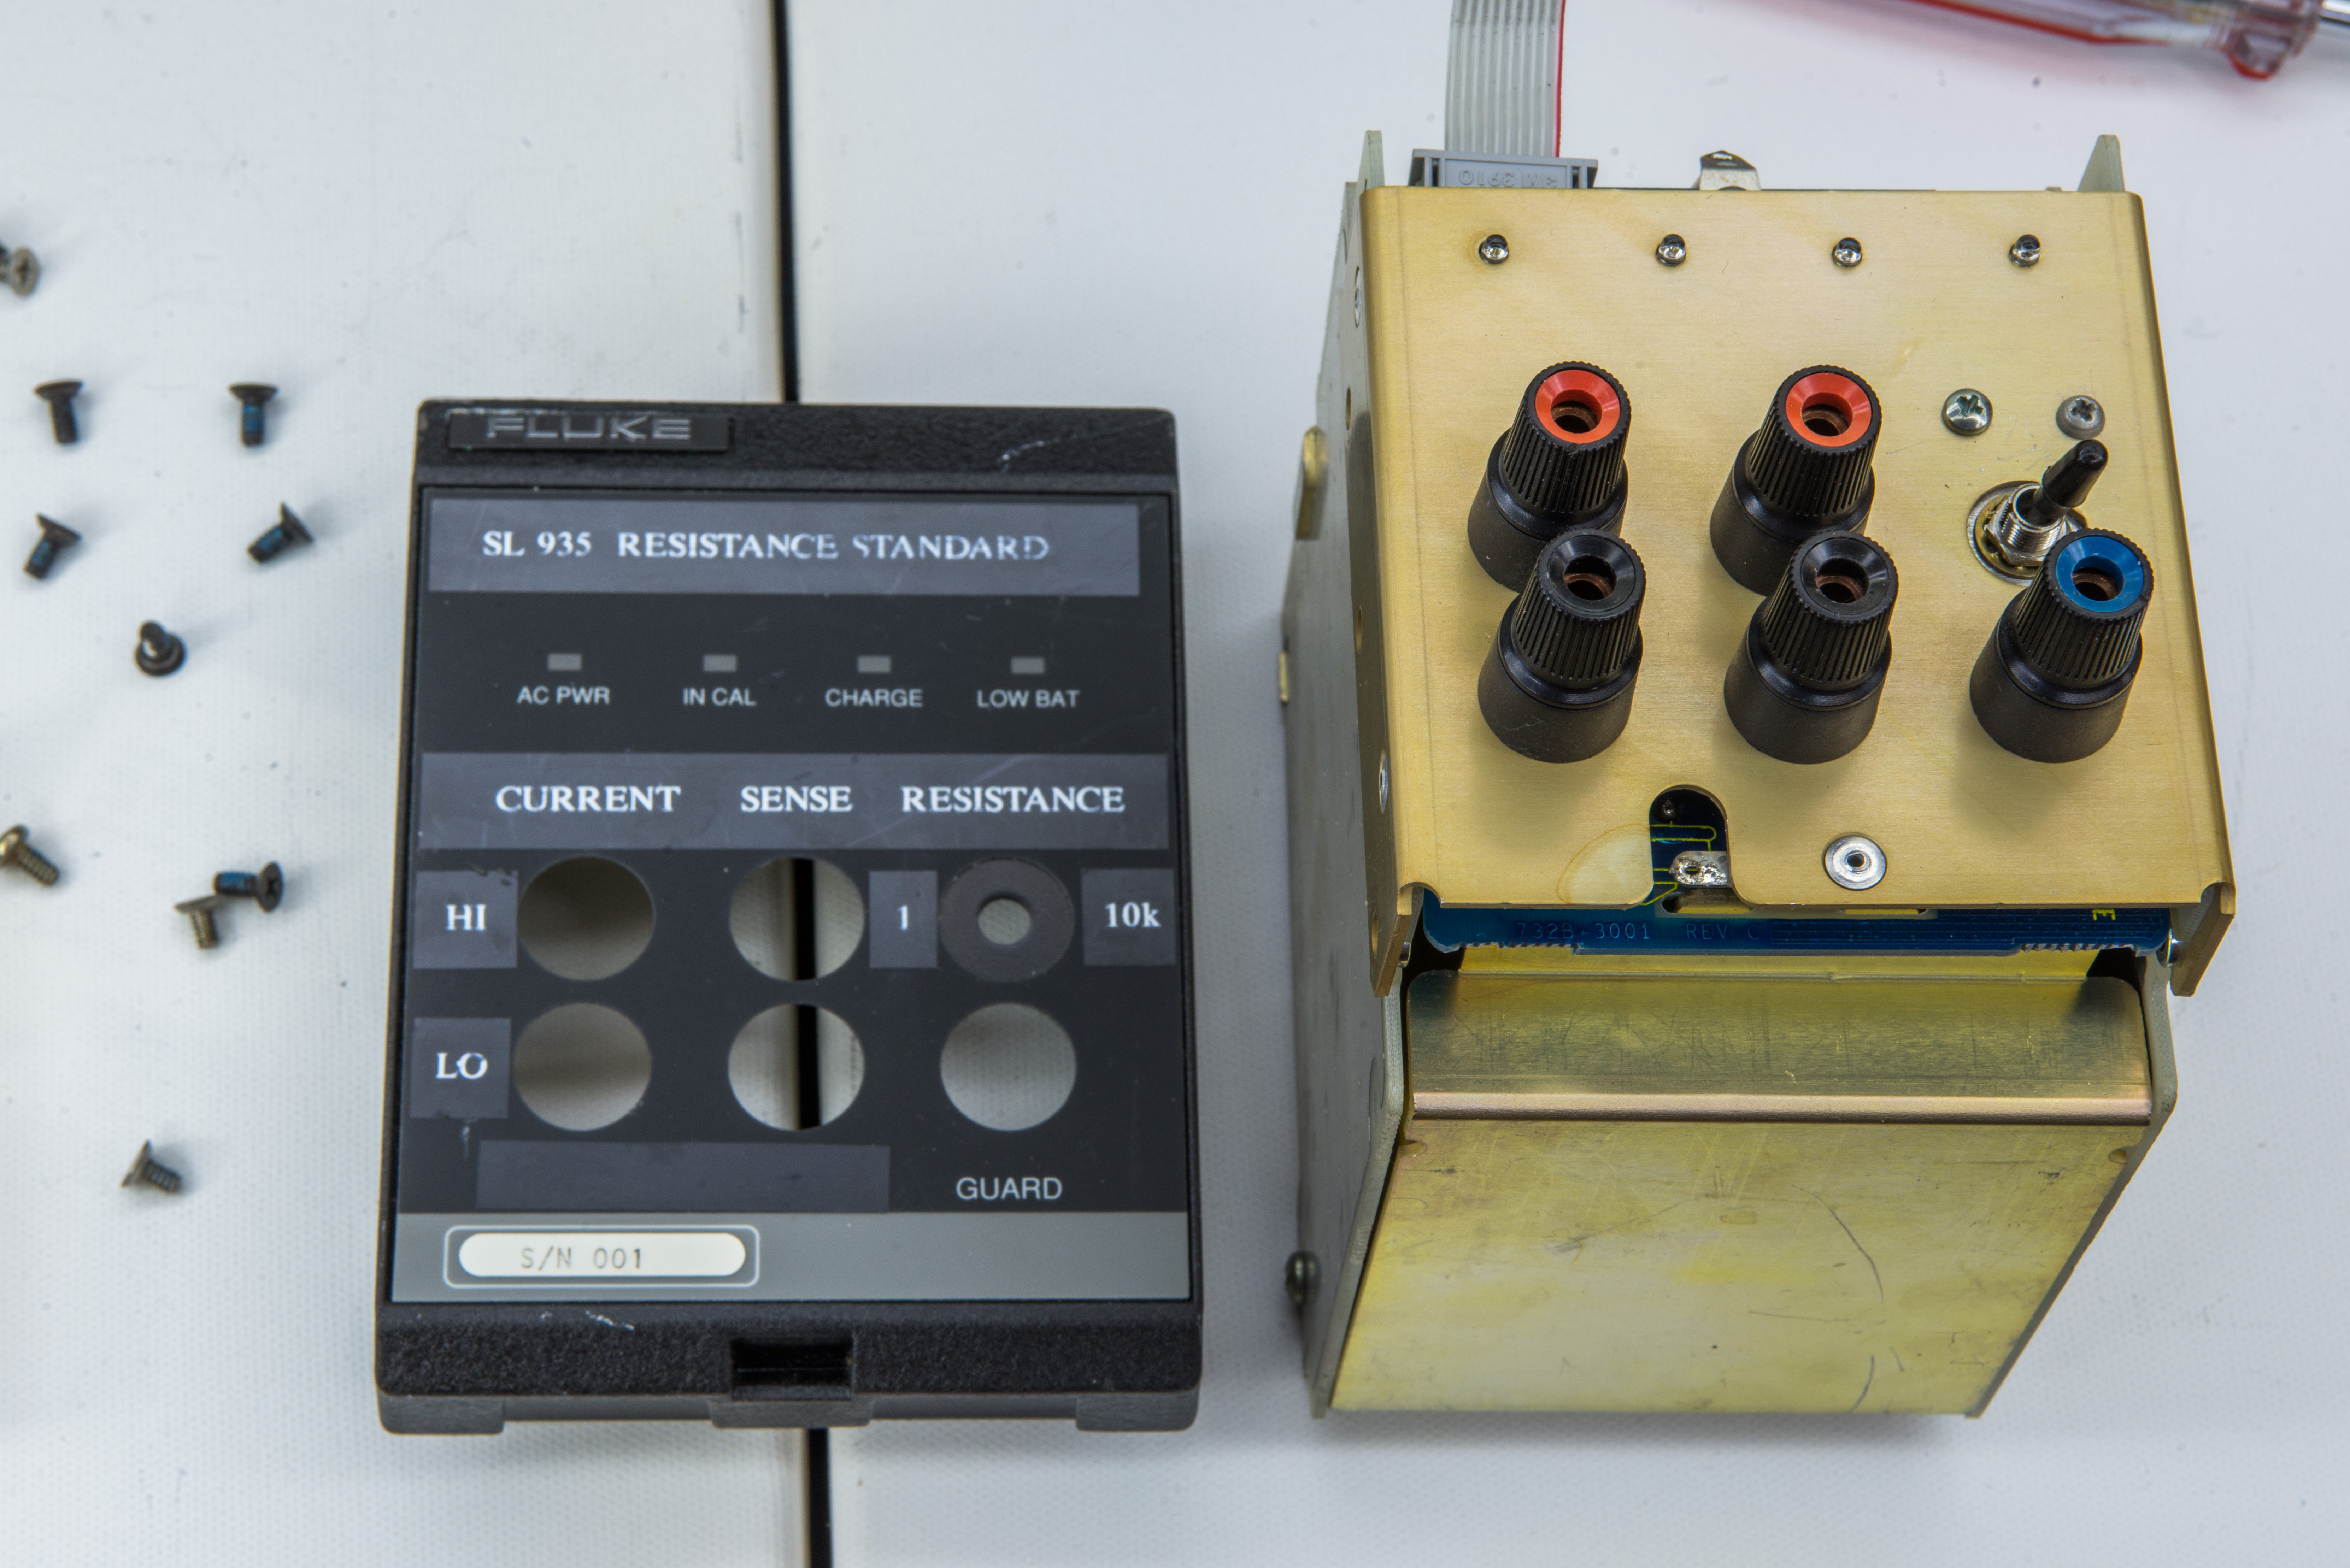
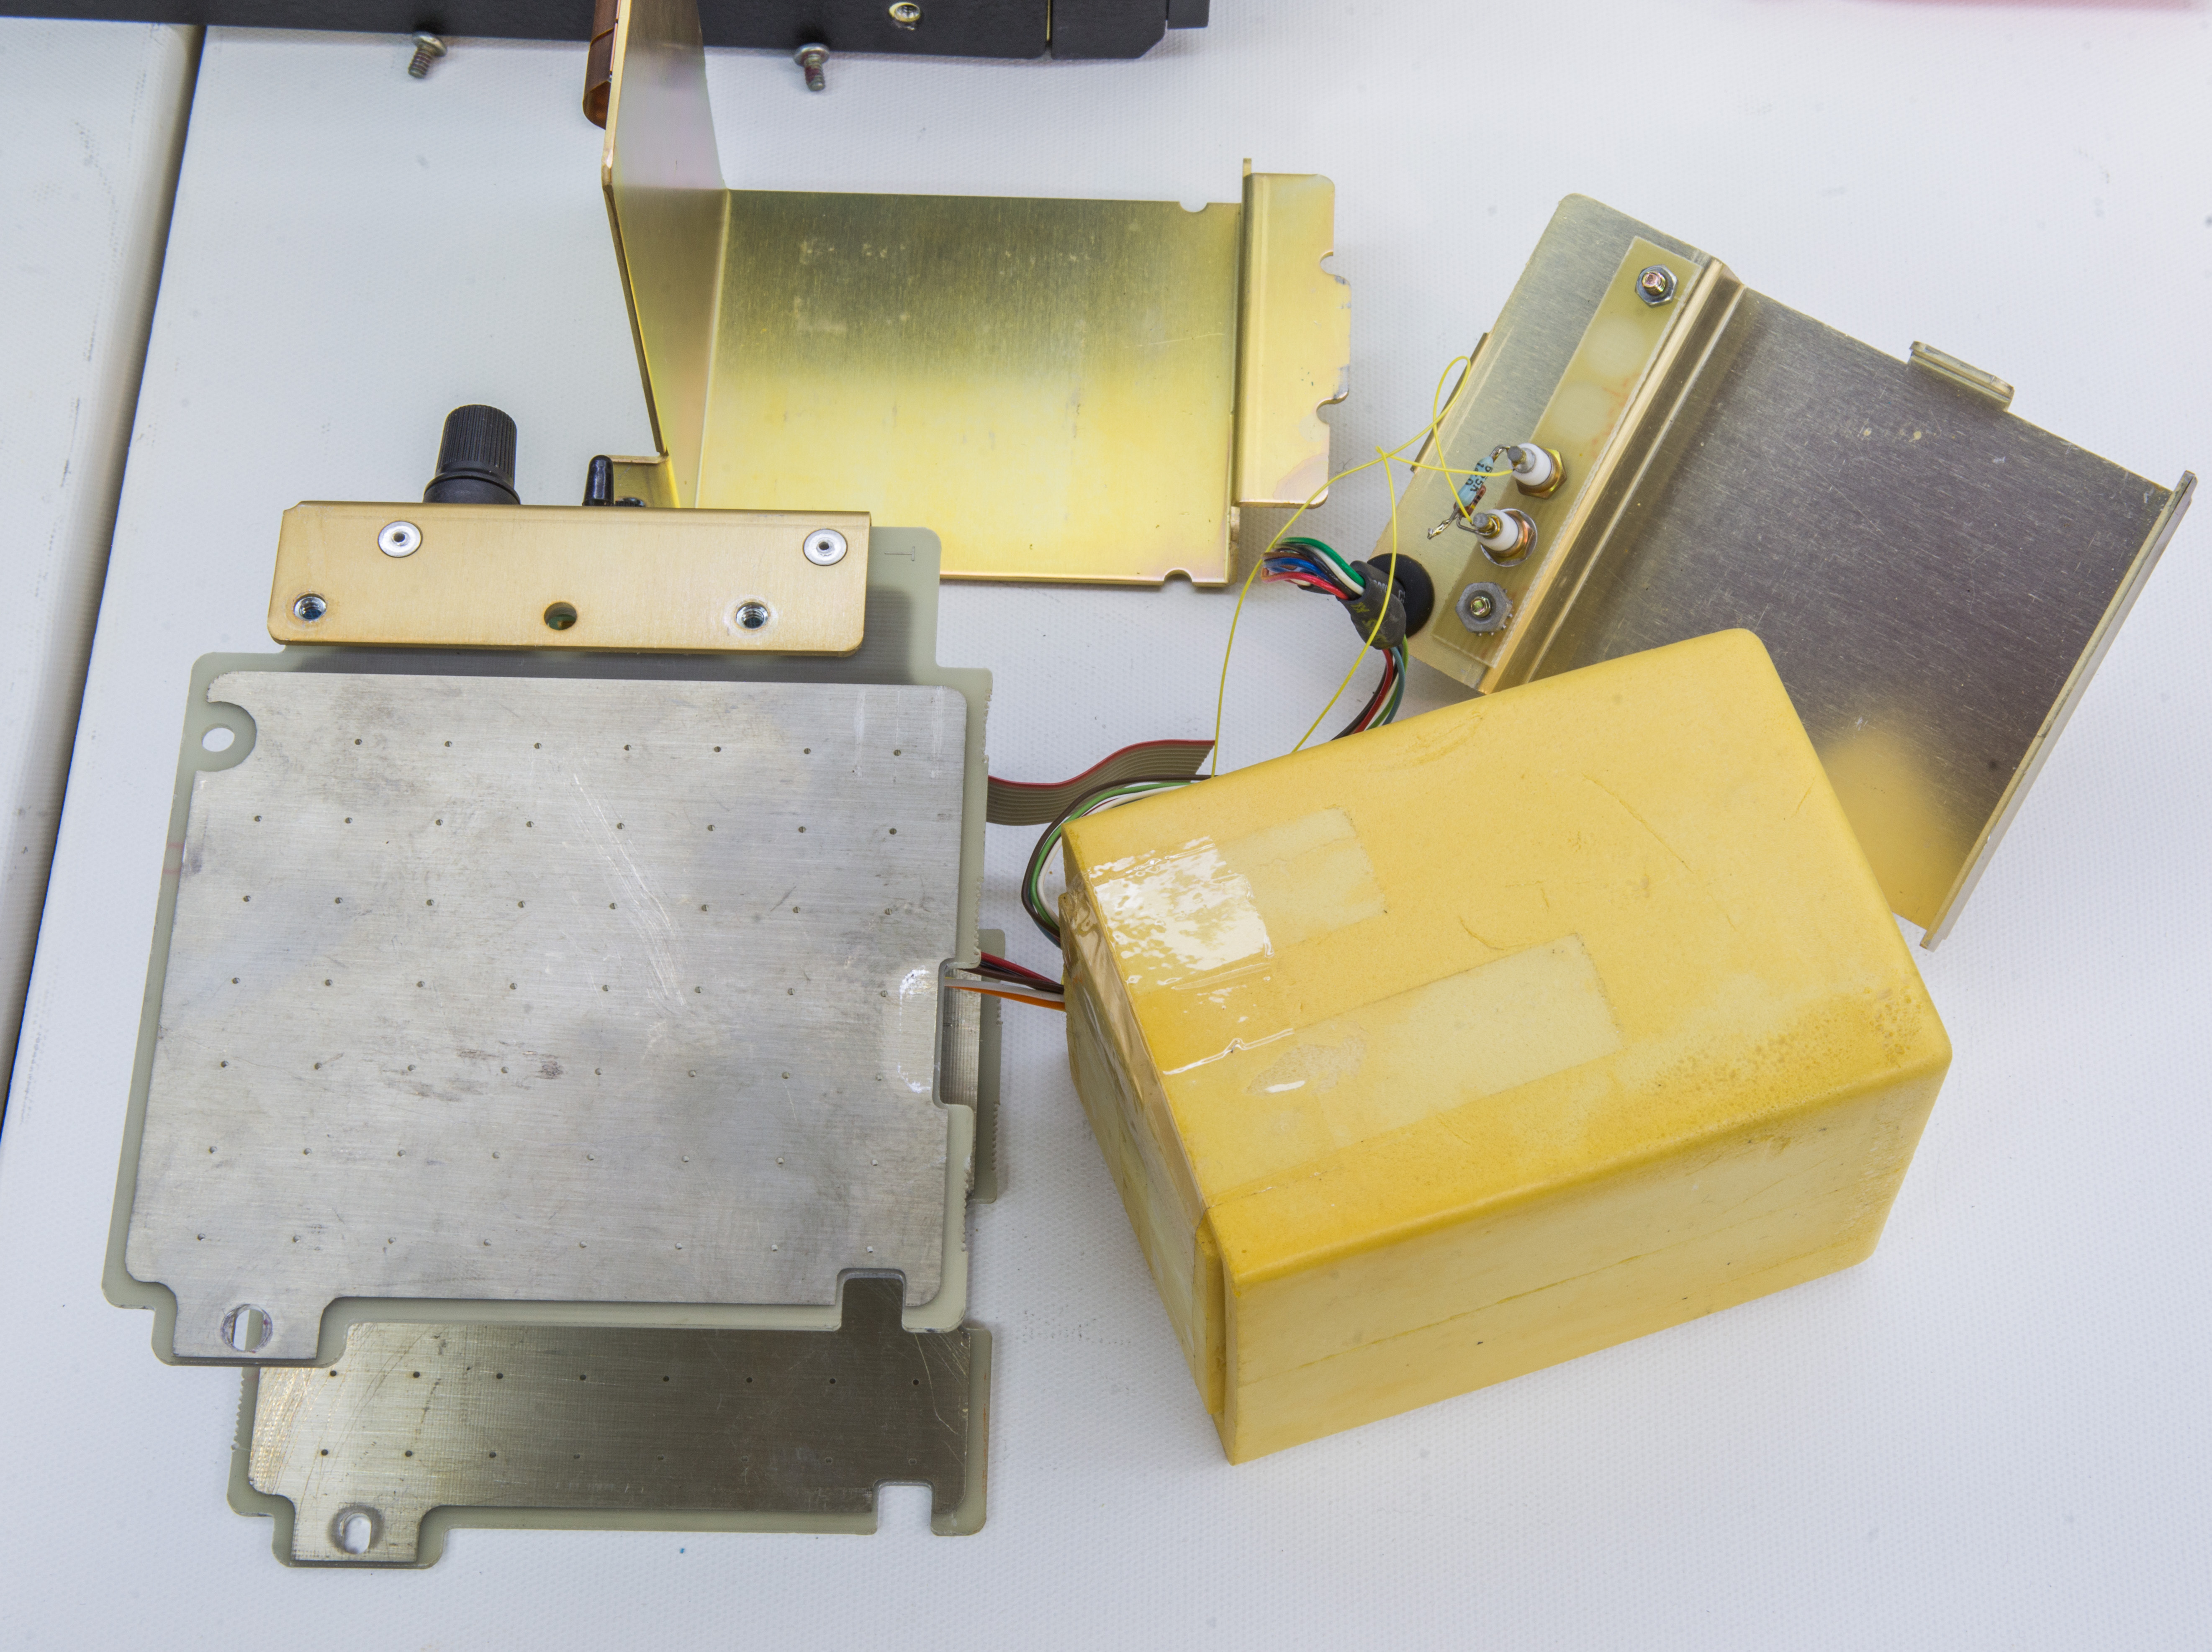
Image 1-2: Fluke SL935 oven module assembly, as received.
Restoration

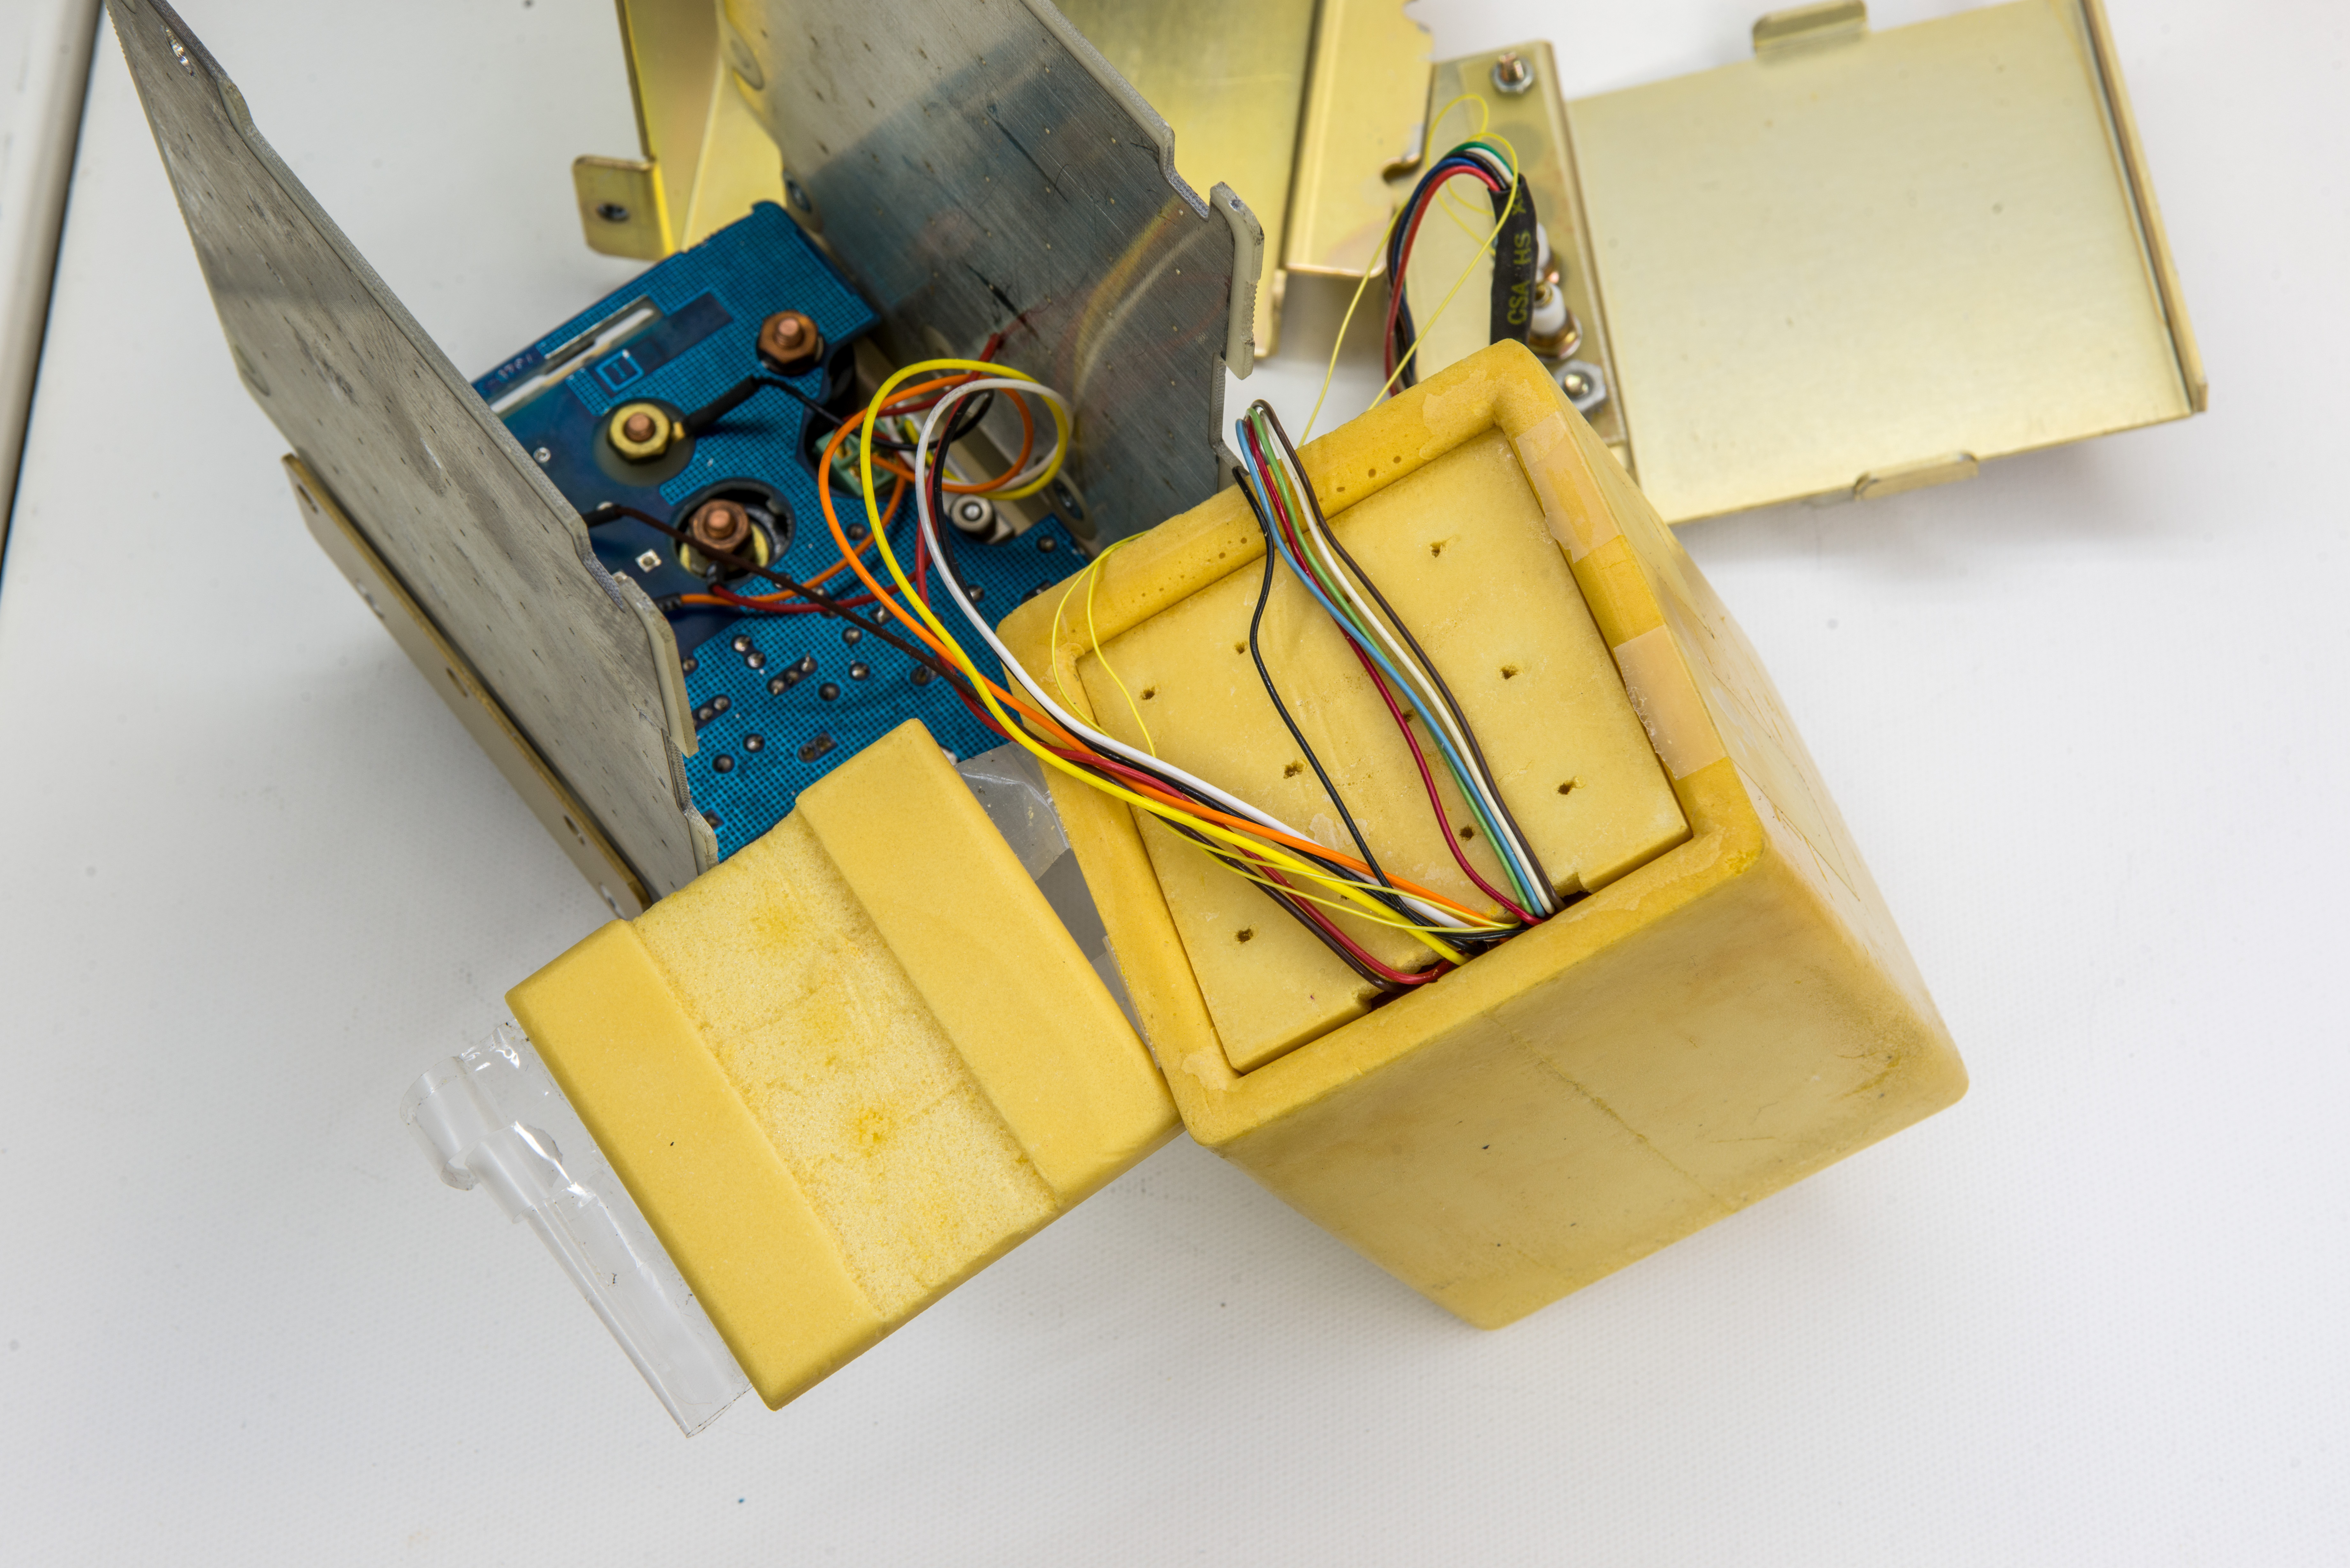
Image 3-4: Oven module construction and wiring.

Image 5: Resistance can removed
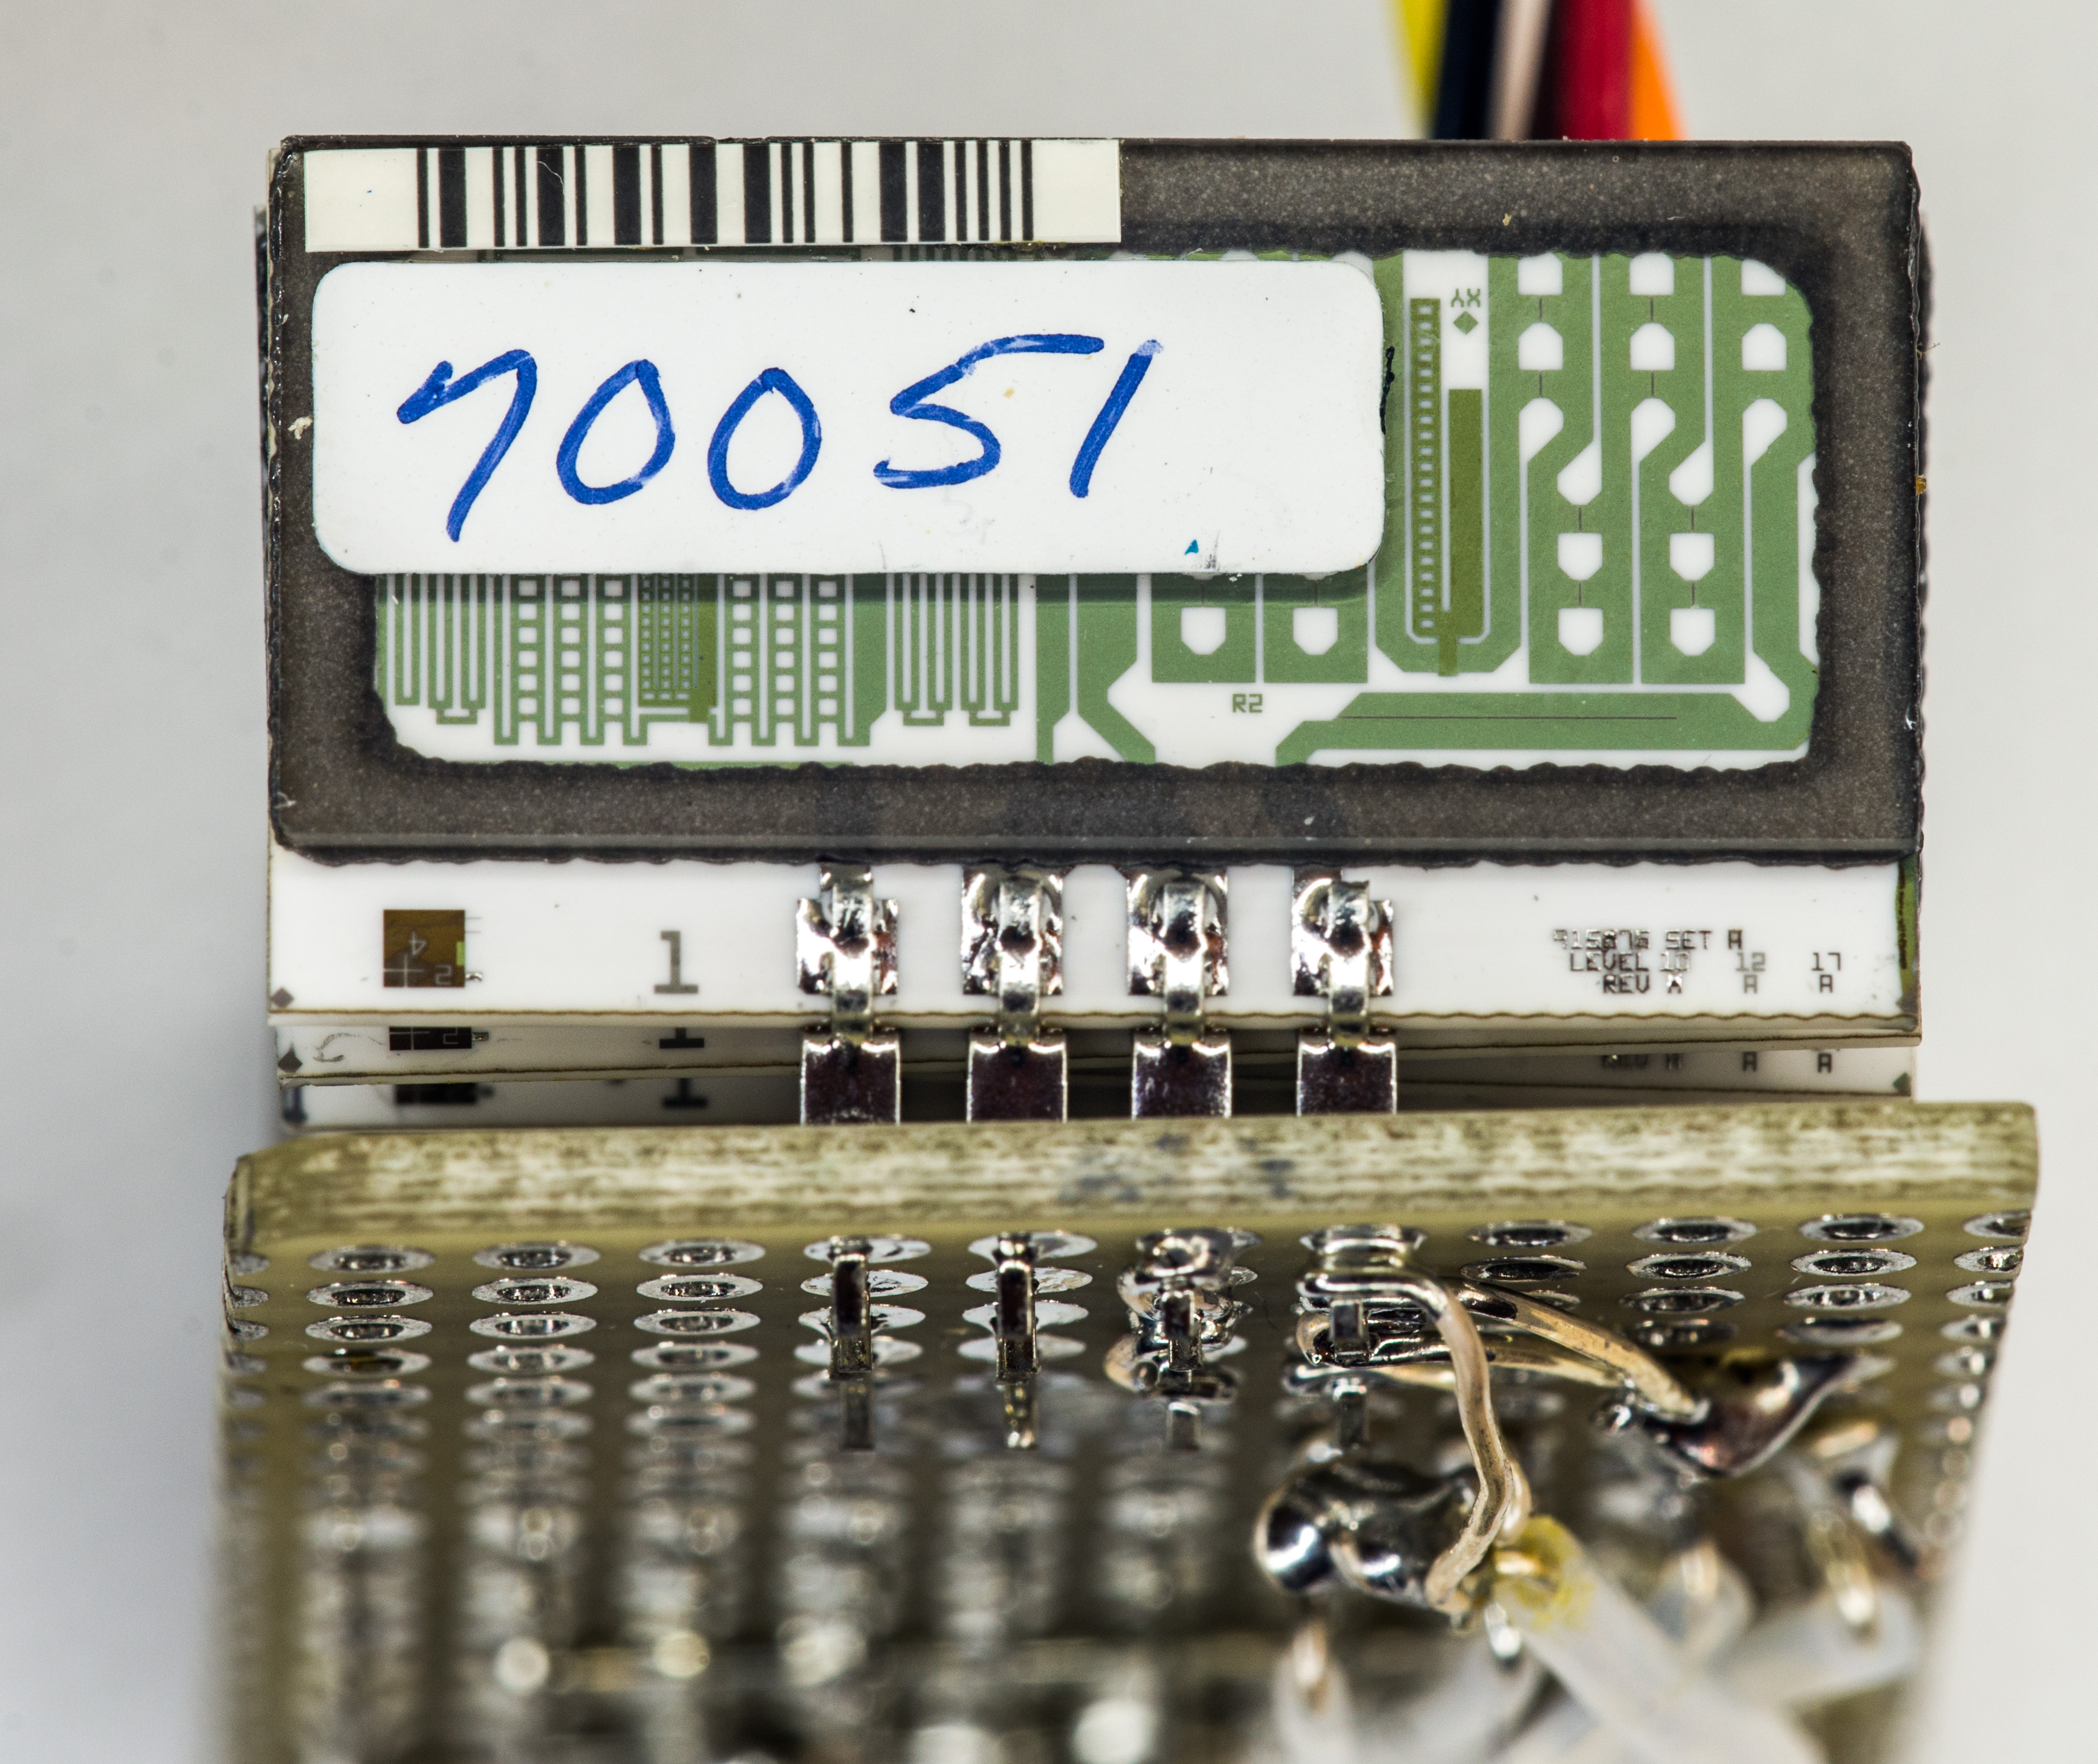
Image 6: 10 KΩ resistance hermetic network array from Fluke P/M 798330.
10 KΩ derived from 10 x Fluke 5700A hermetic resistor network Z1 Fluke 798330 from A10 Ω MAIN PCBA and 2.1111 Ω trim (9 × 19Ω).

Image 7: 1 Ω resistance hermetic network array from Fluke P/N 815889.
1 Ω derived from 4 x Fluke 5700A hermetic resistor network Z5 Fluke 815889 from A9 Ω CAL PCBA.
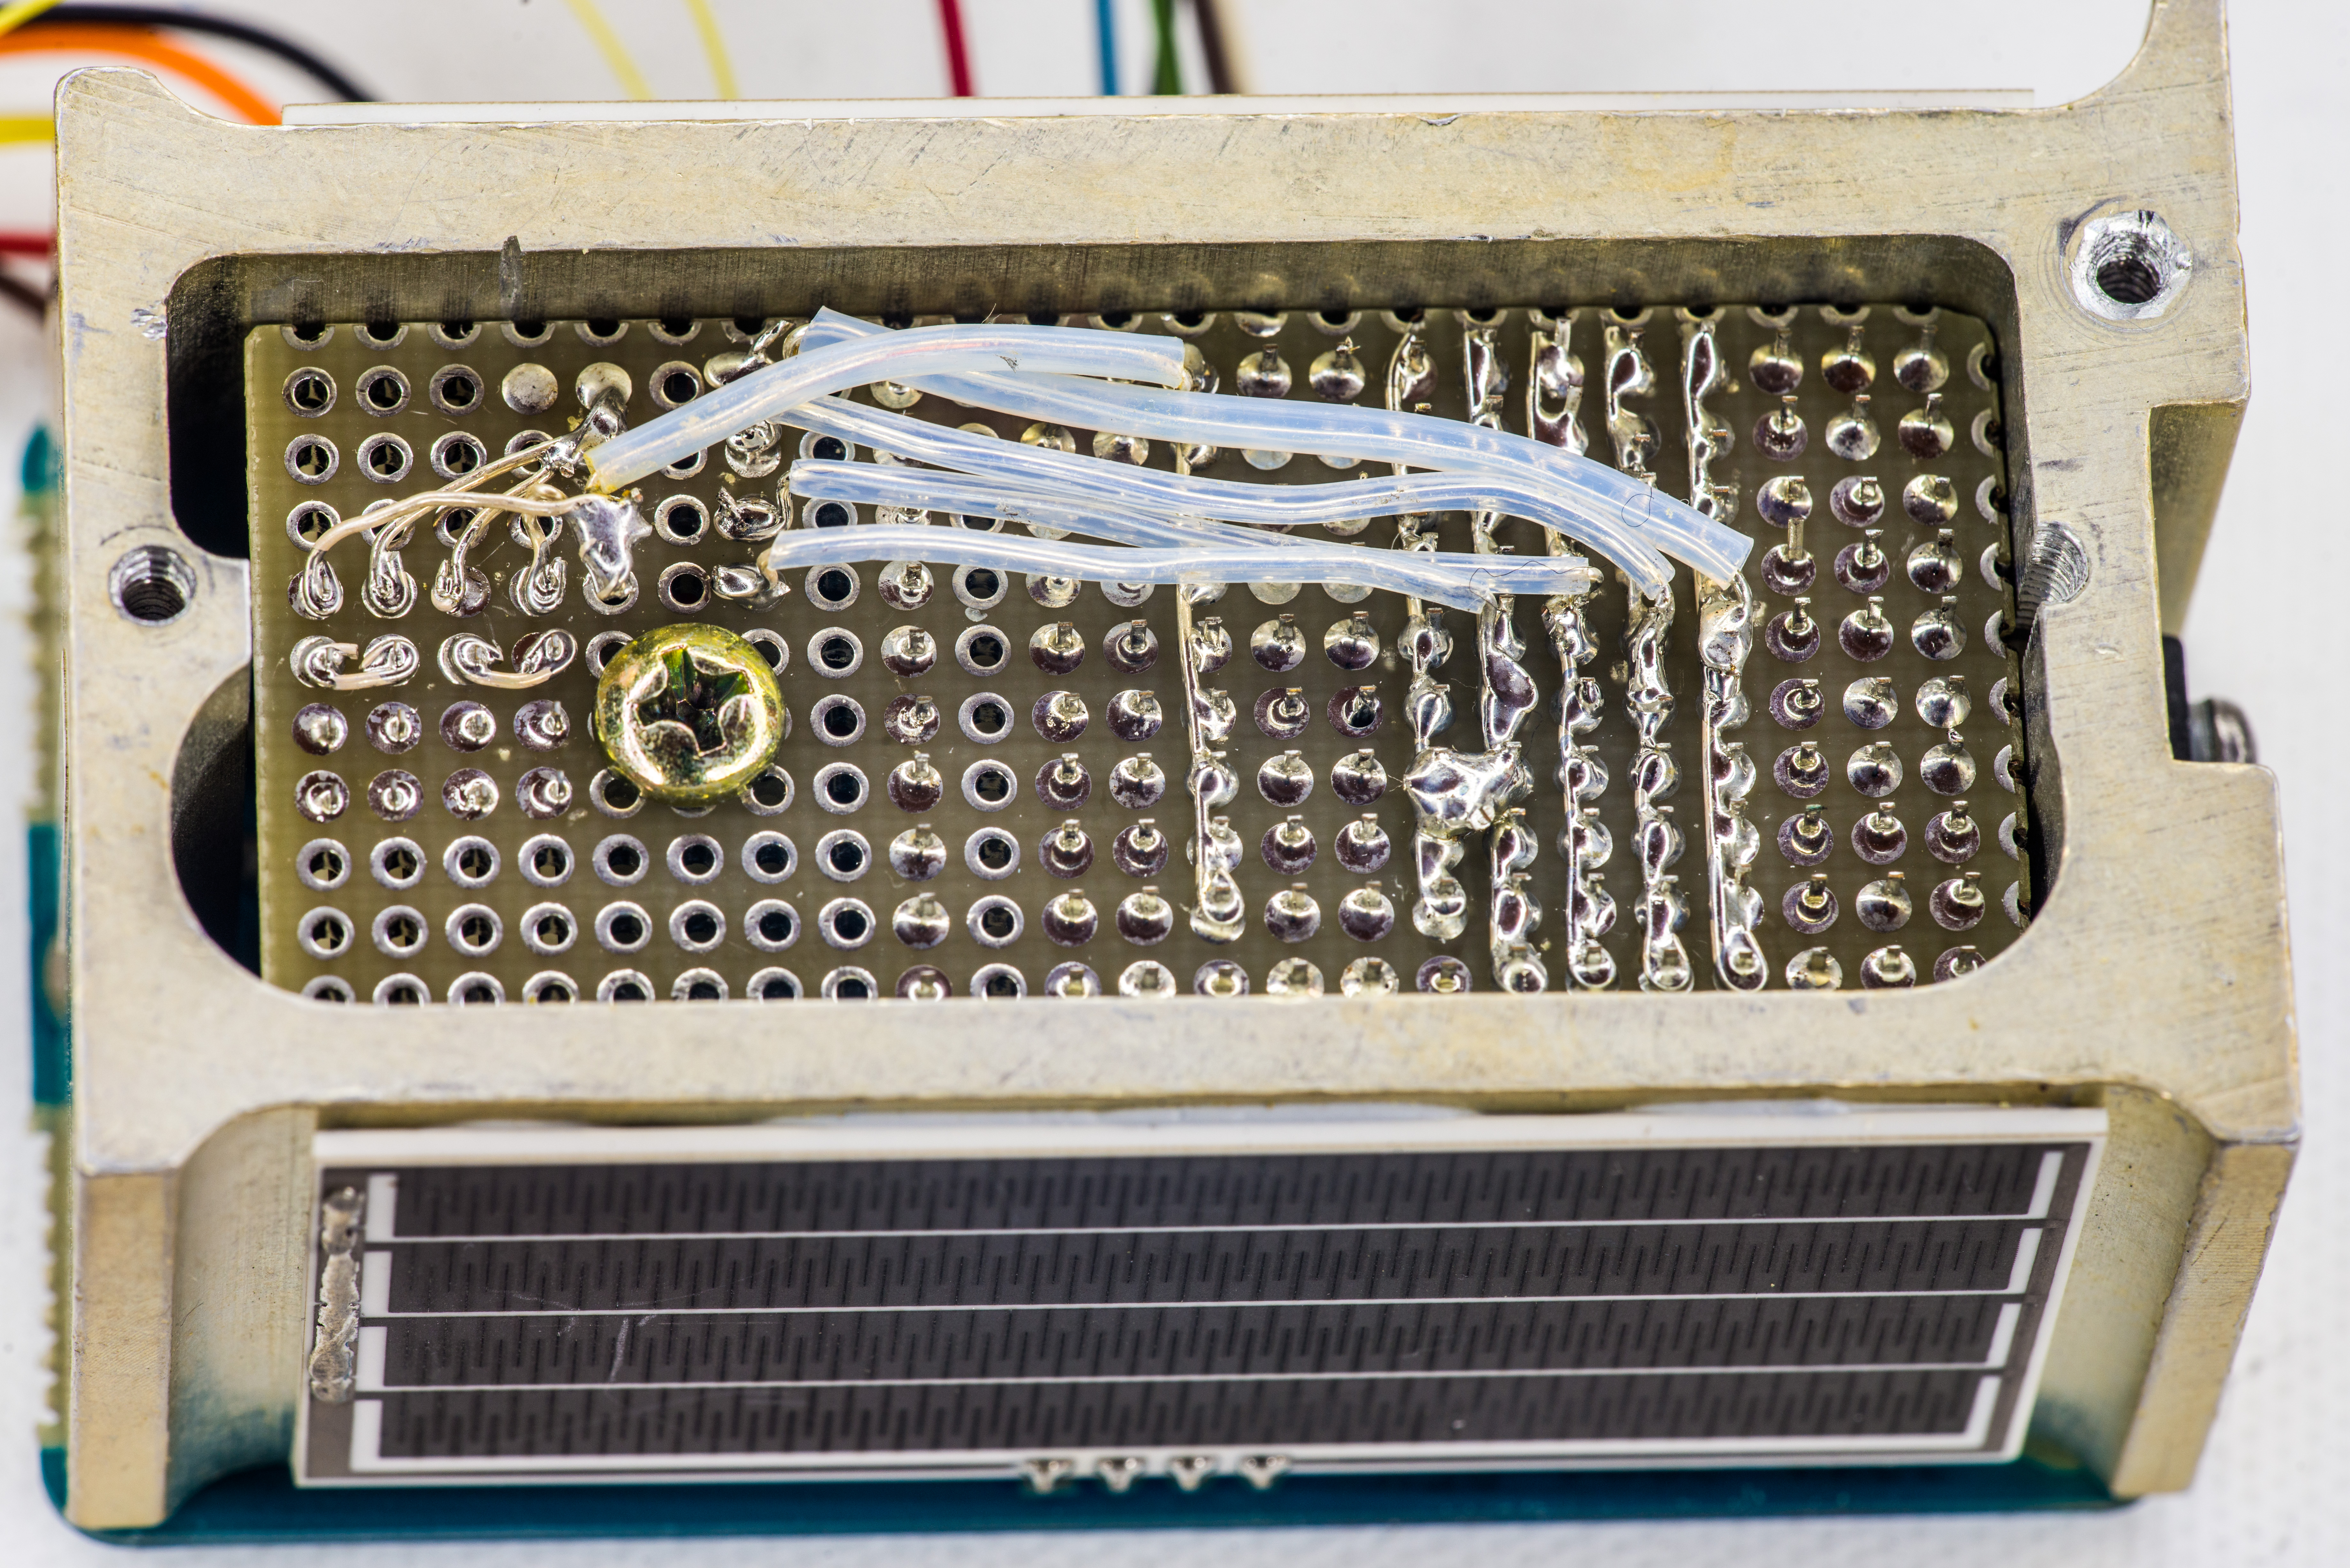
Image 8: Board assembly with silver-coated wires and perf-board.


Image 9-10: Ceramic heater substrate resistors on each side of the oven block.

Image 11: Modified oven 732B control PCBA with TL062C opamp


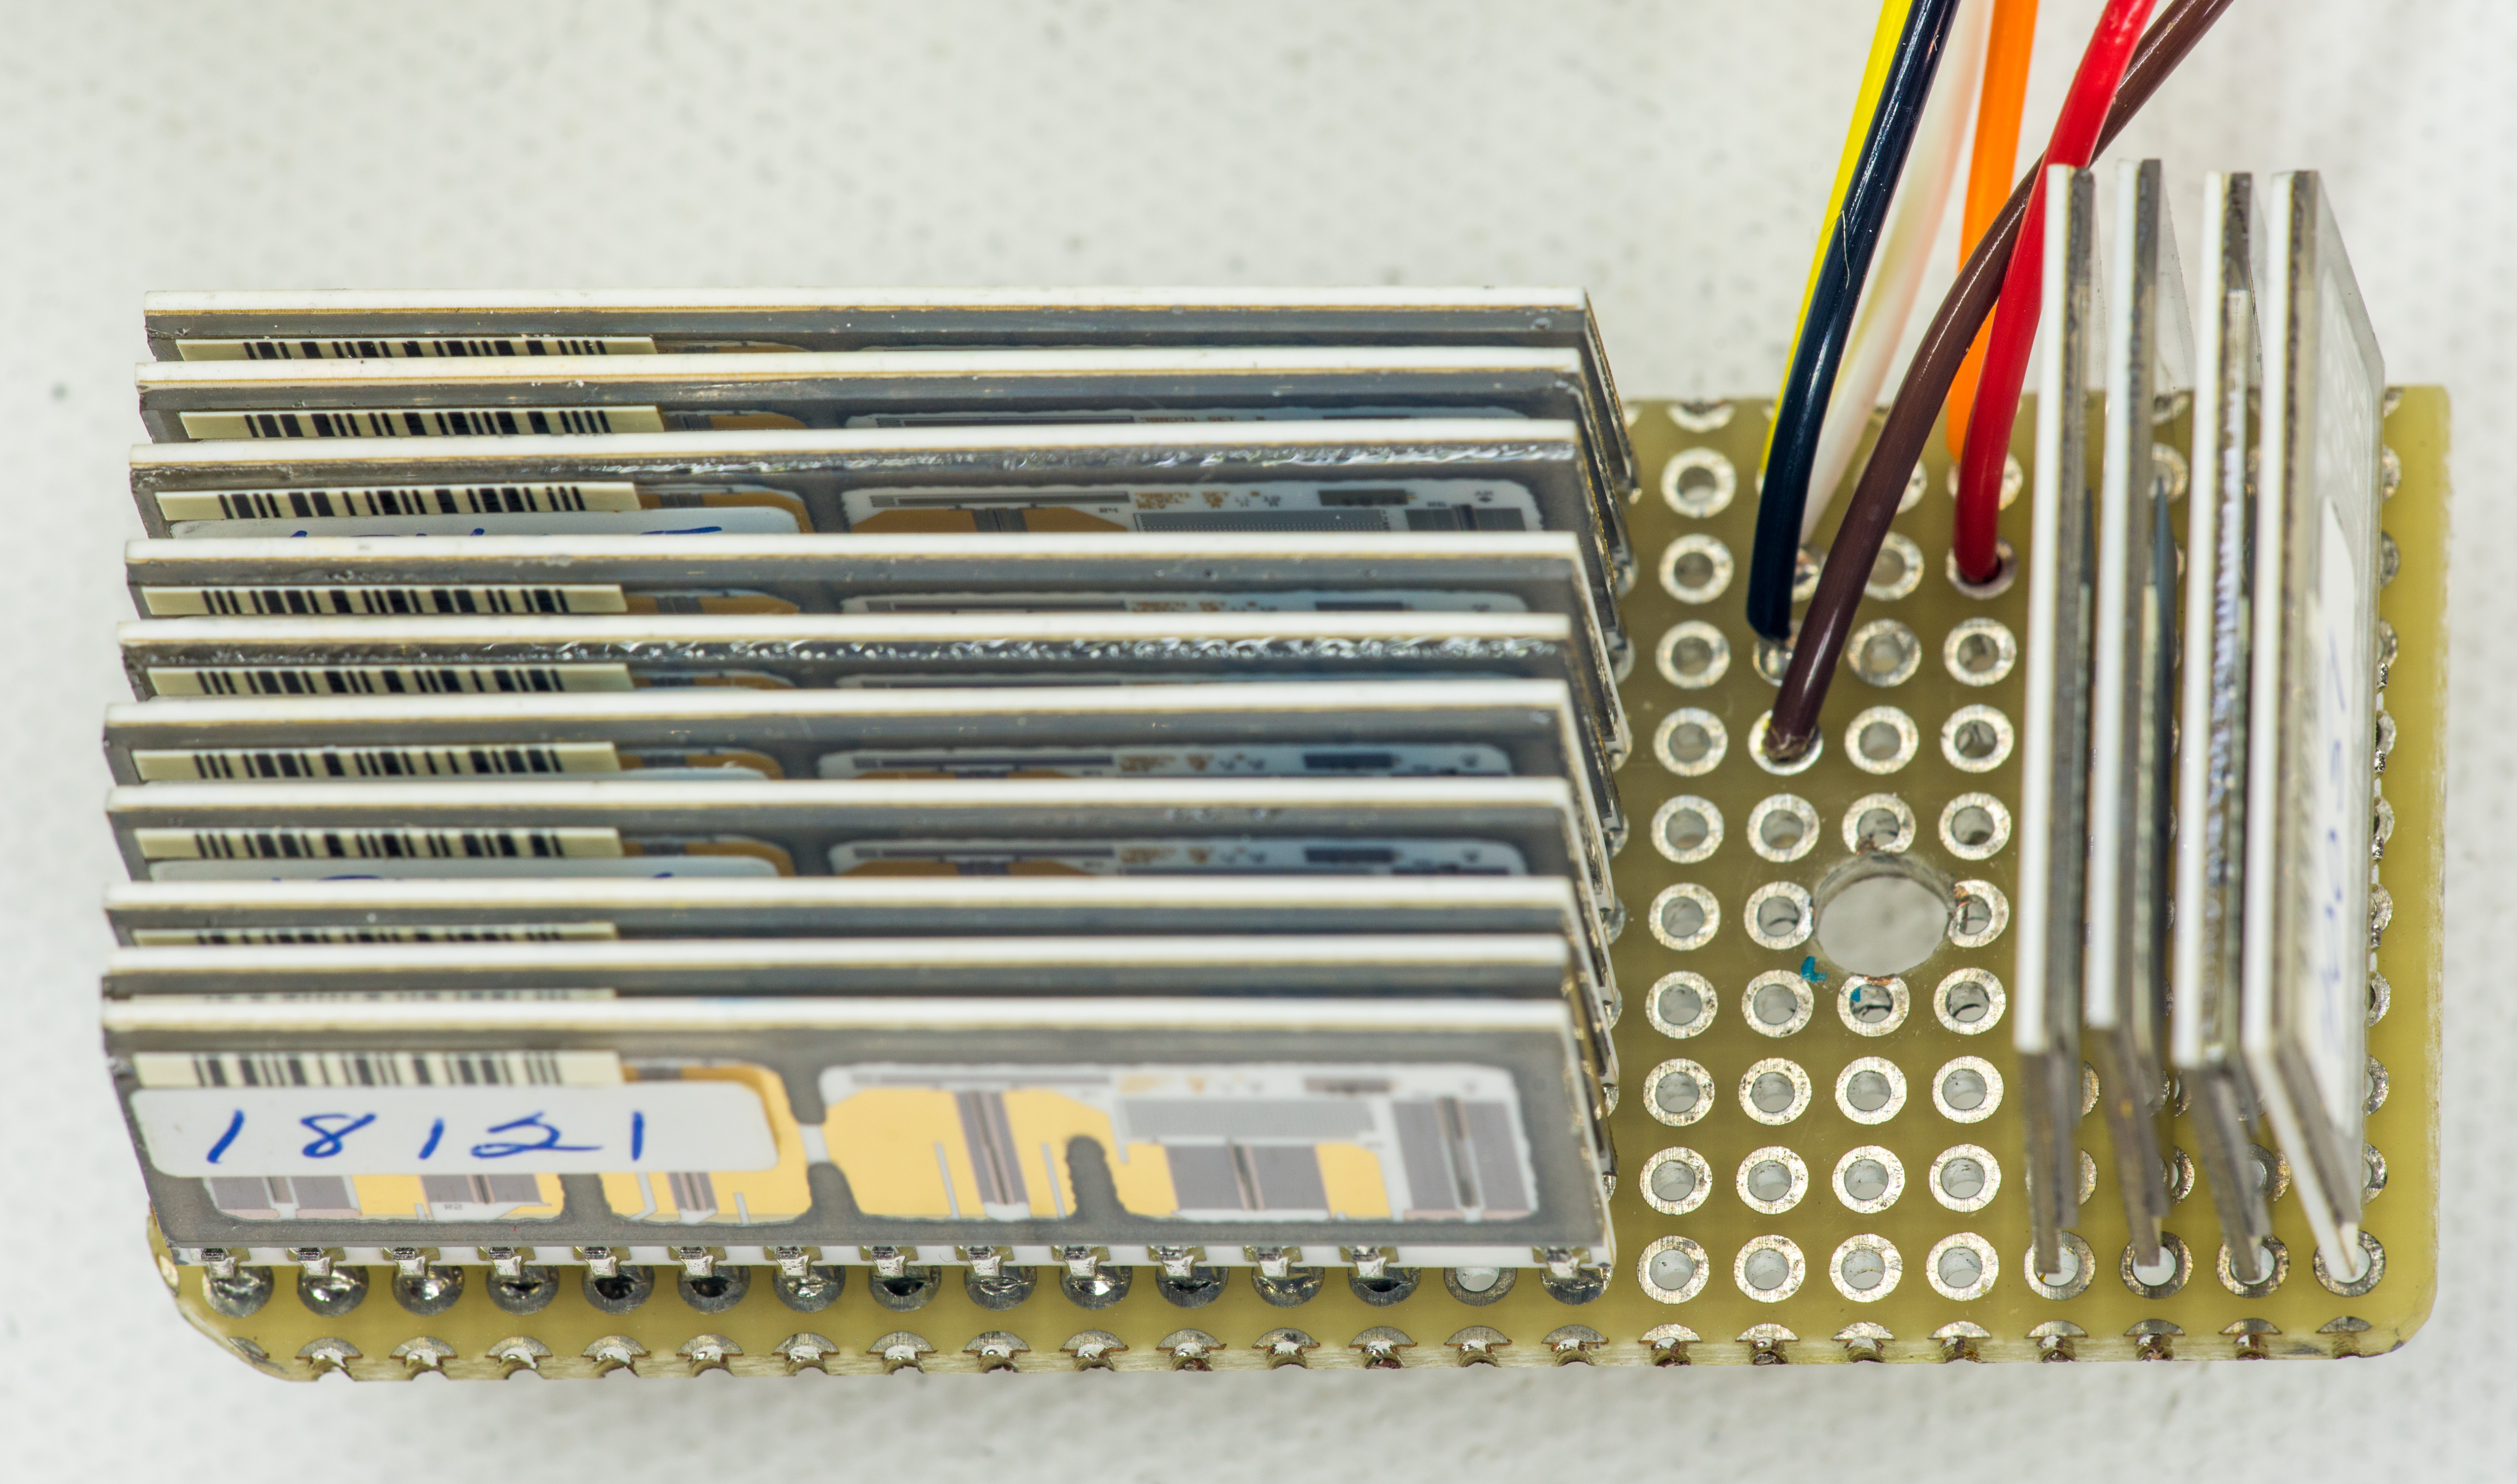
Image 12-14: Another view on resistor networks
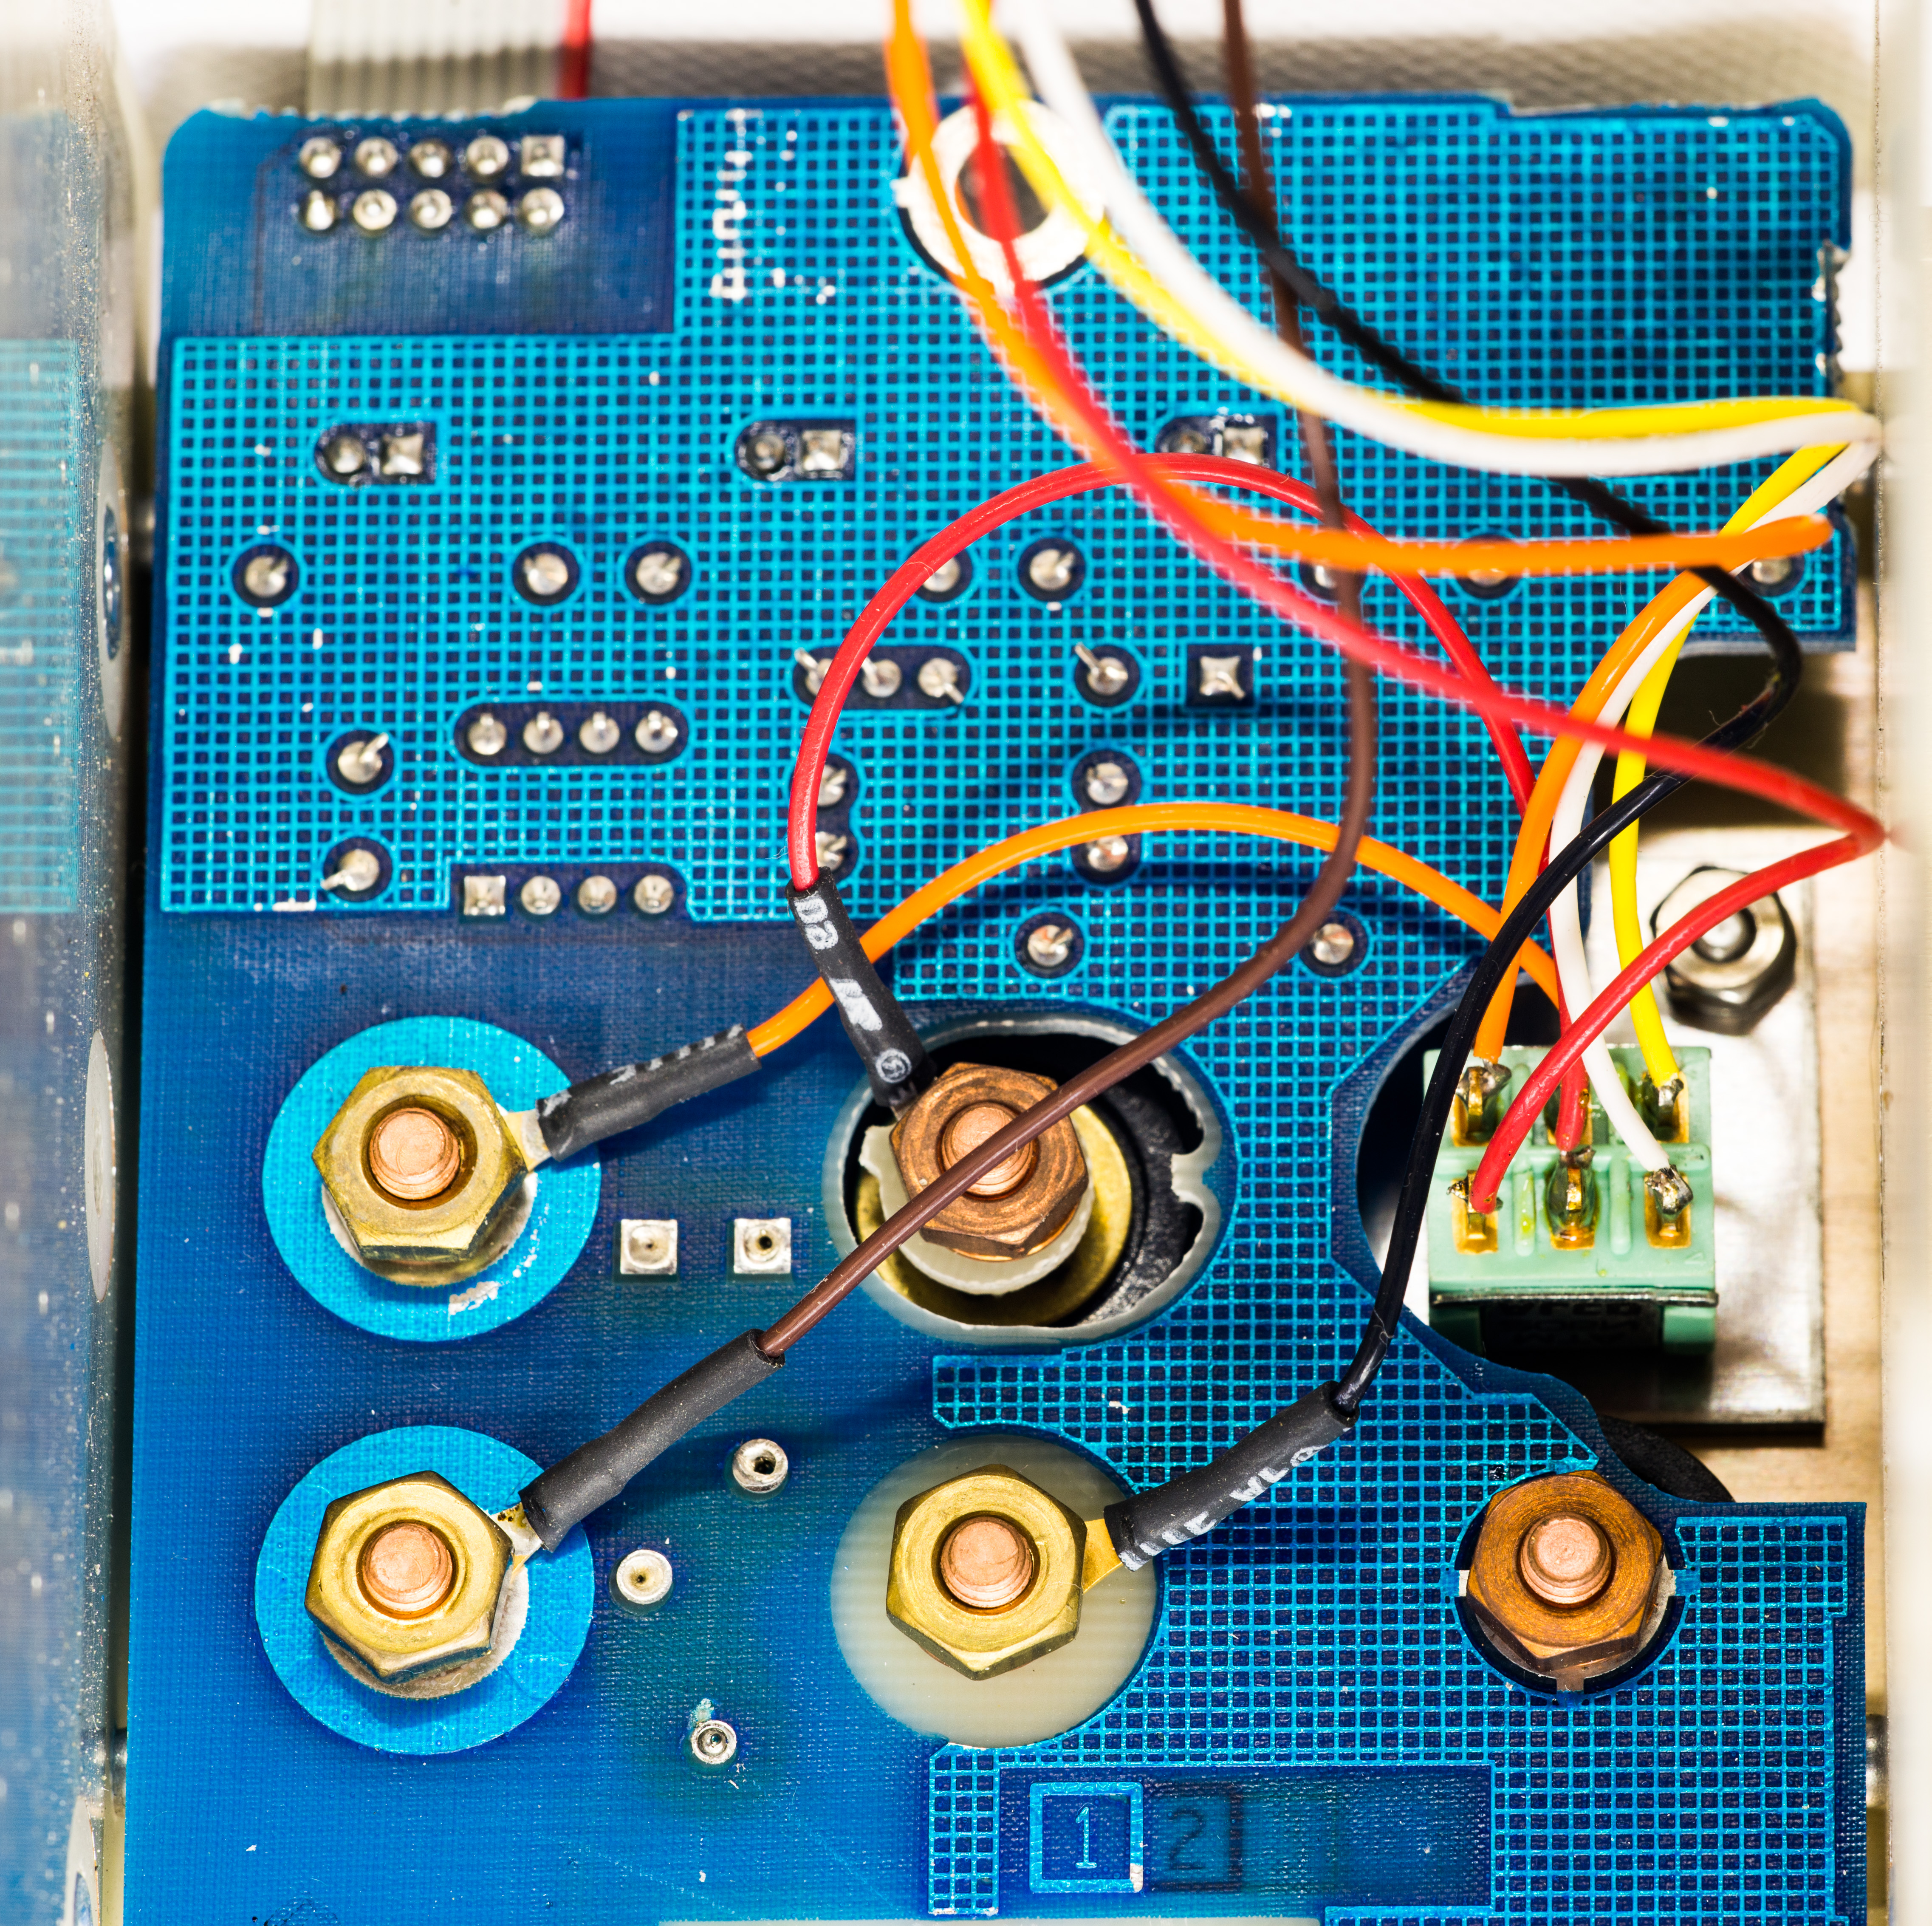
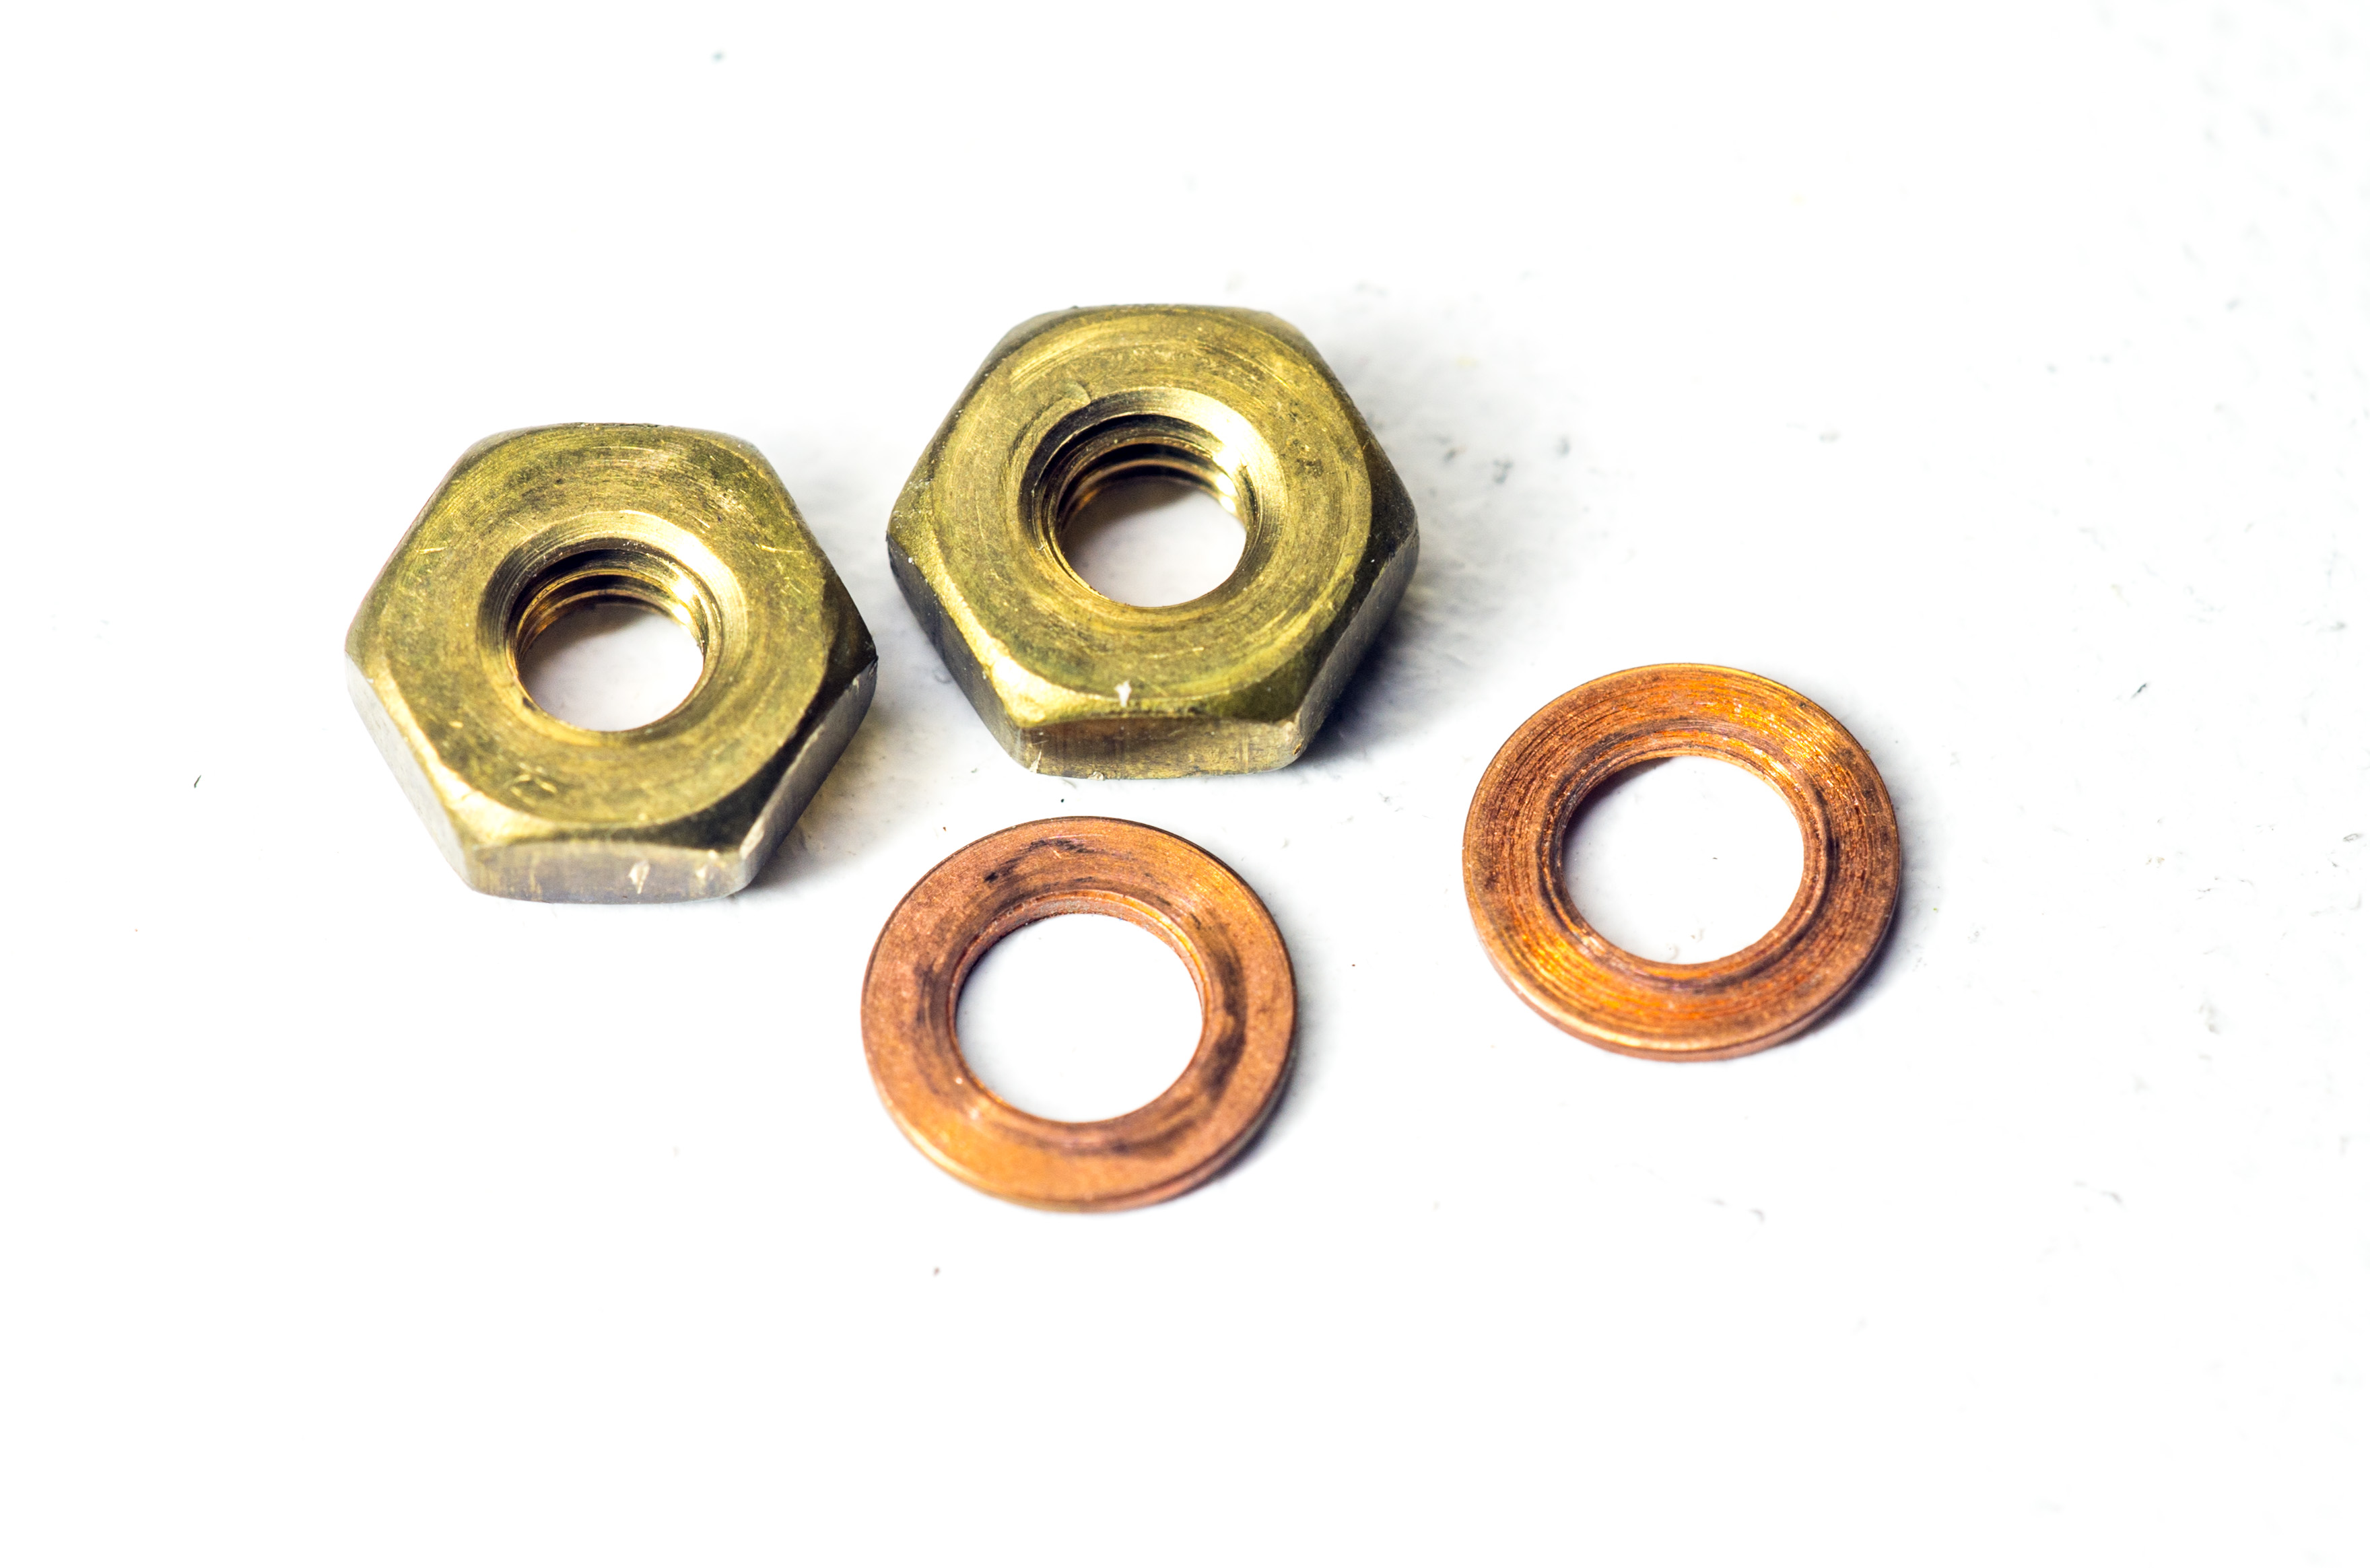
Image 15-16: Wiring to binding posts and copper washers
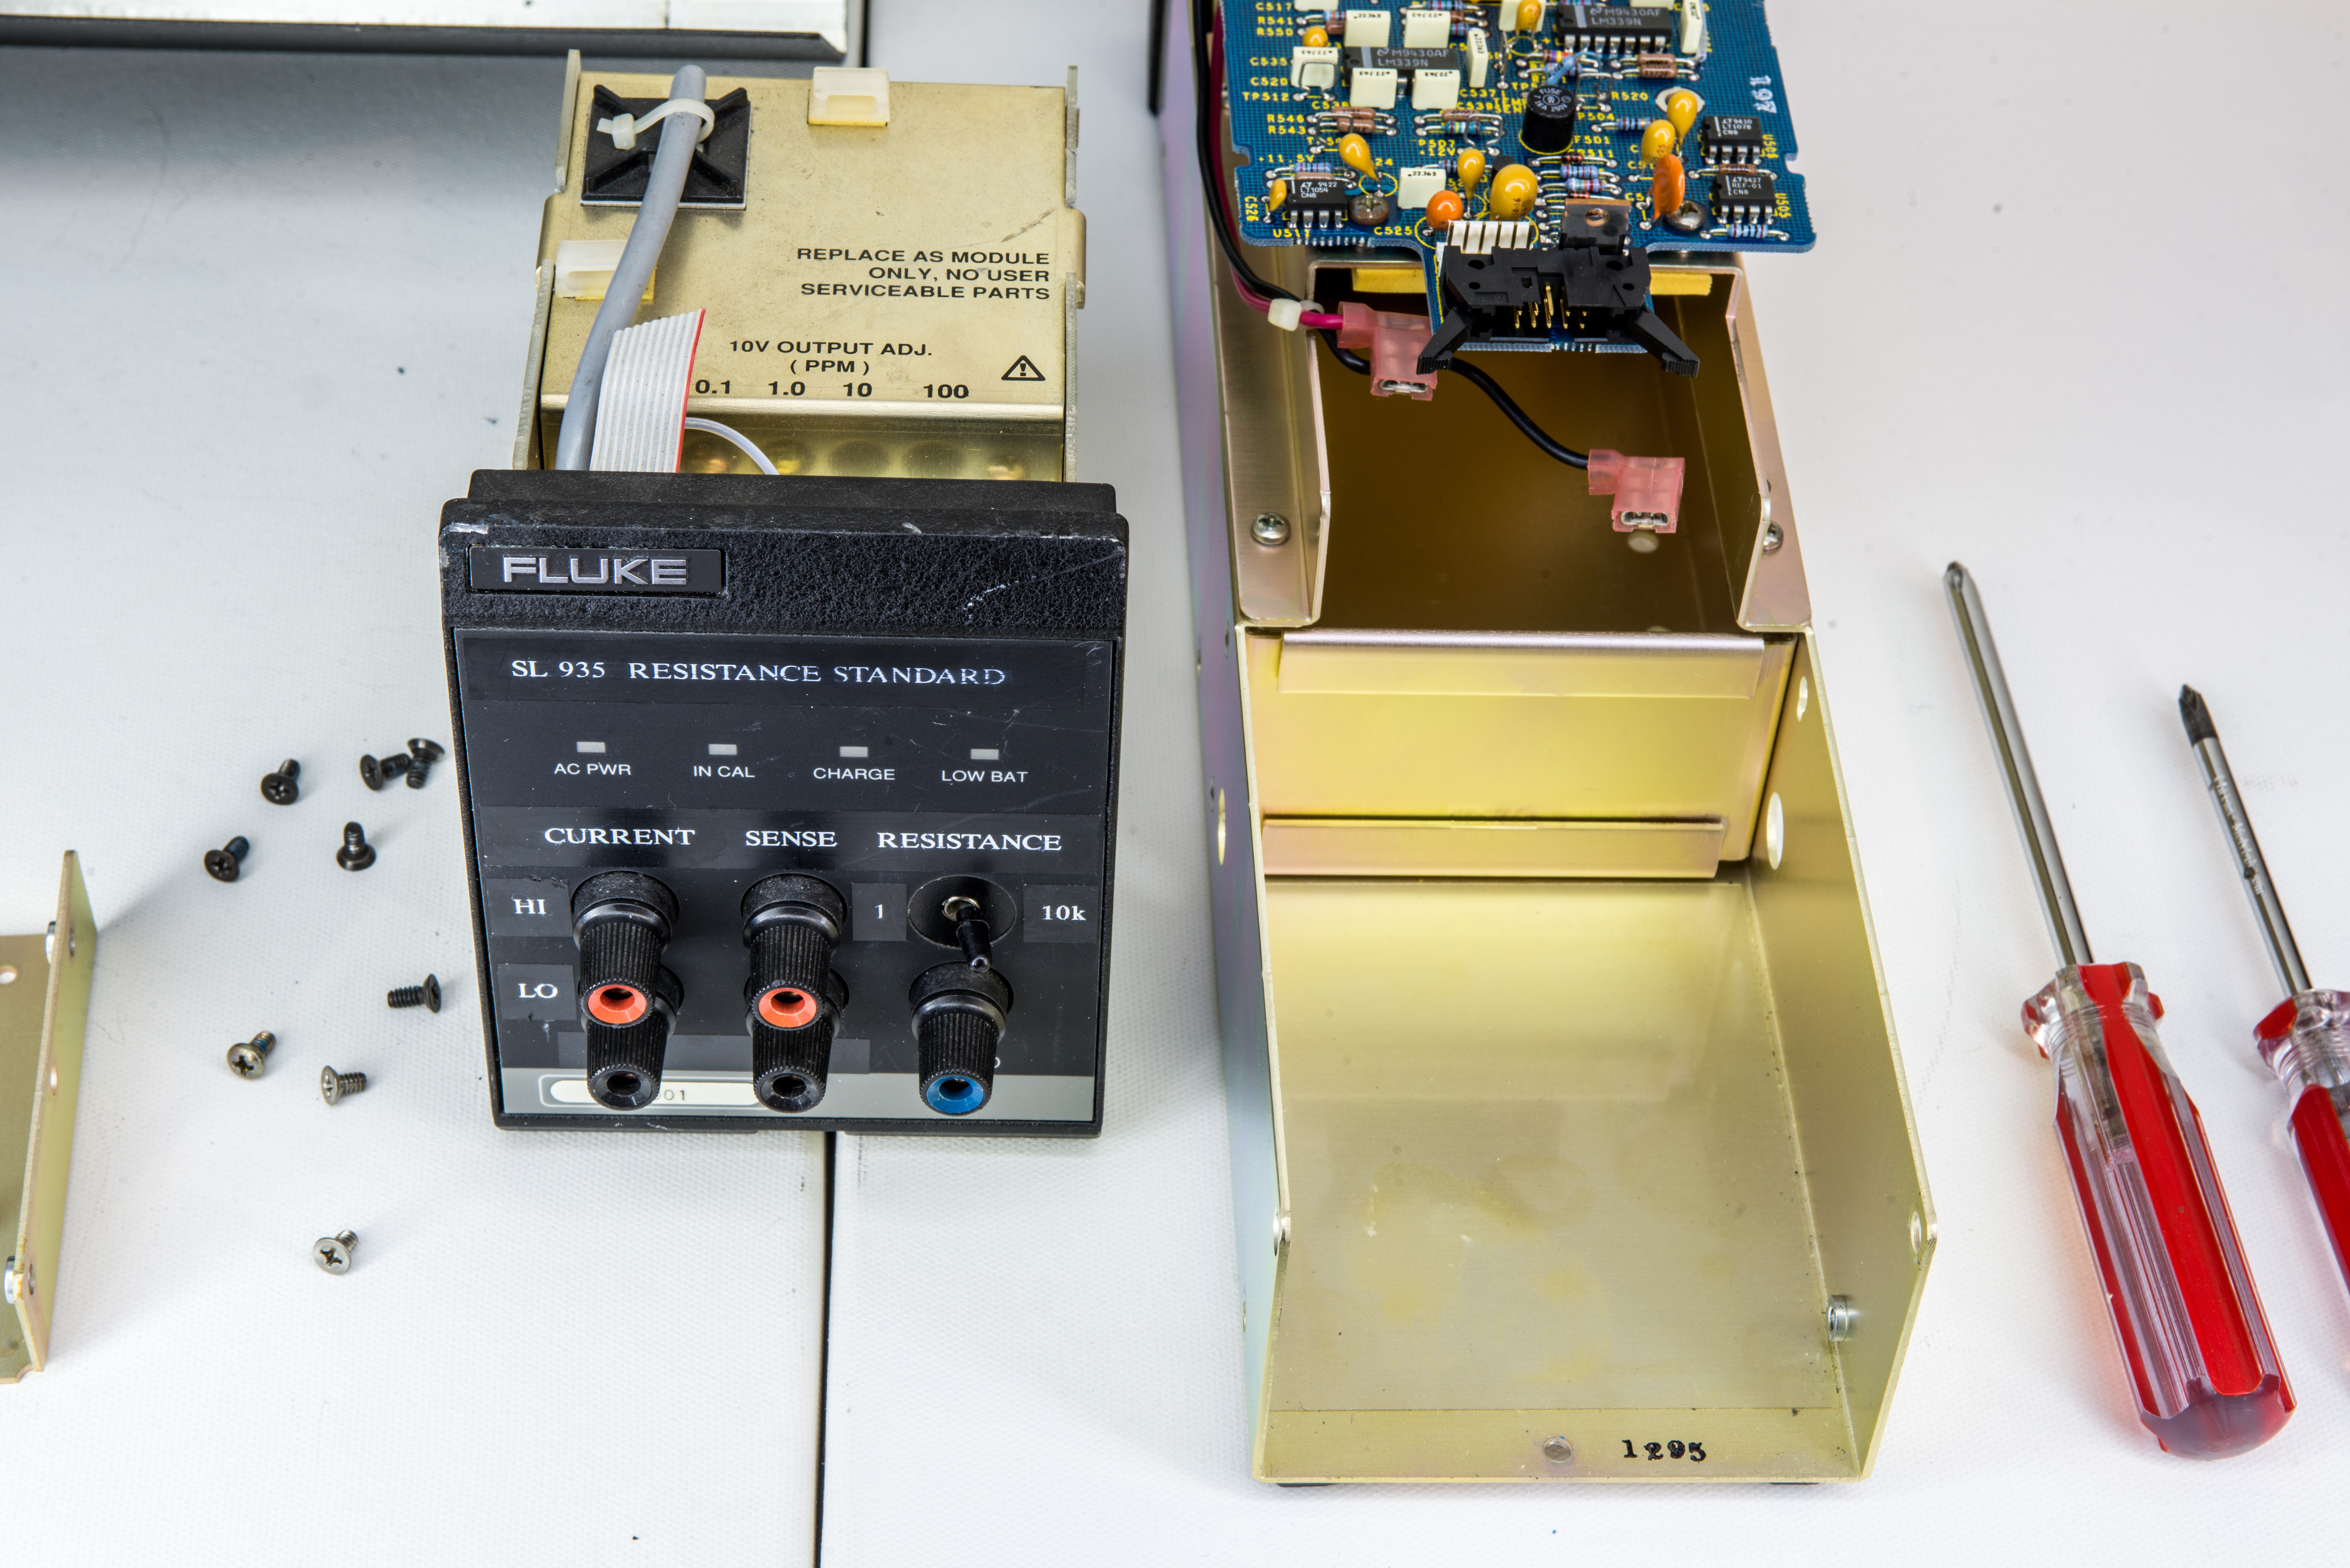
Image 17: Prior to reassembly
To bring resistance standard into useful condition, Fluke 732B-7001 power pack chassis was reused.
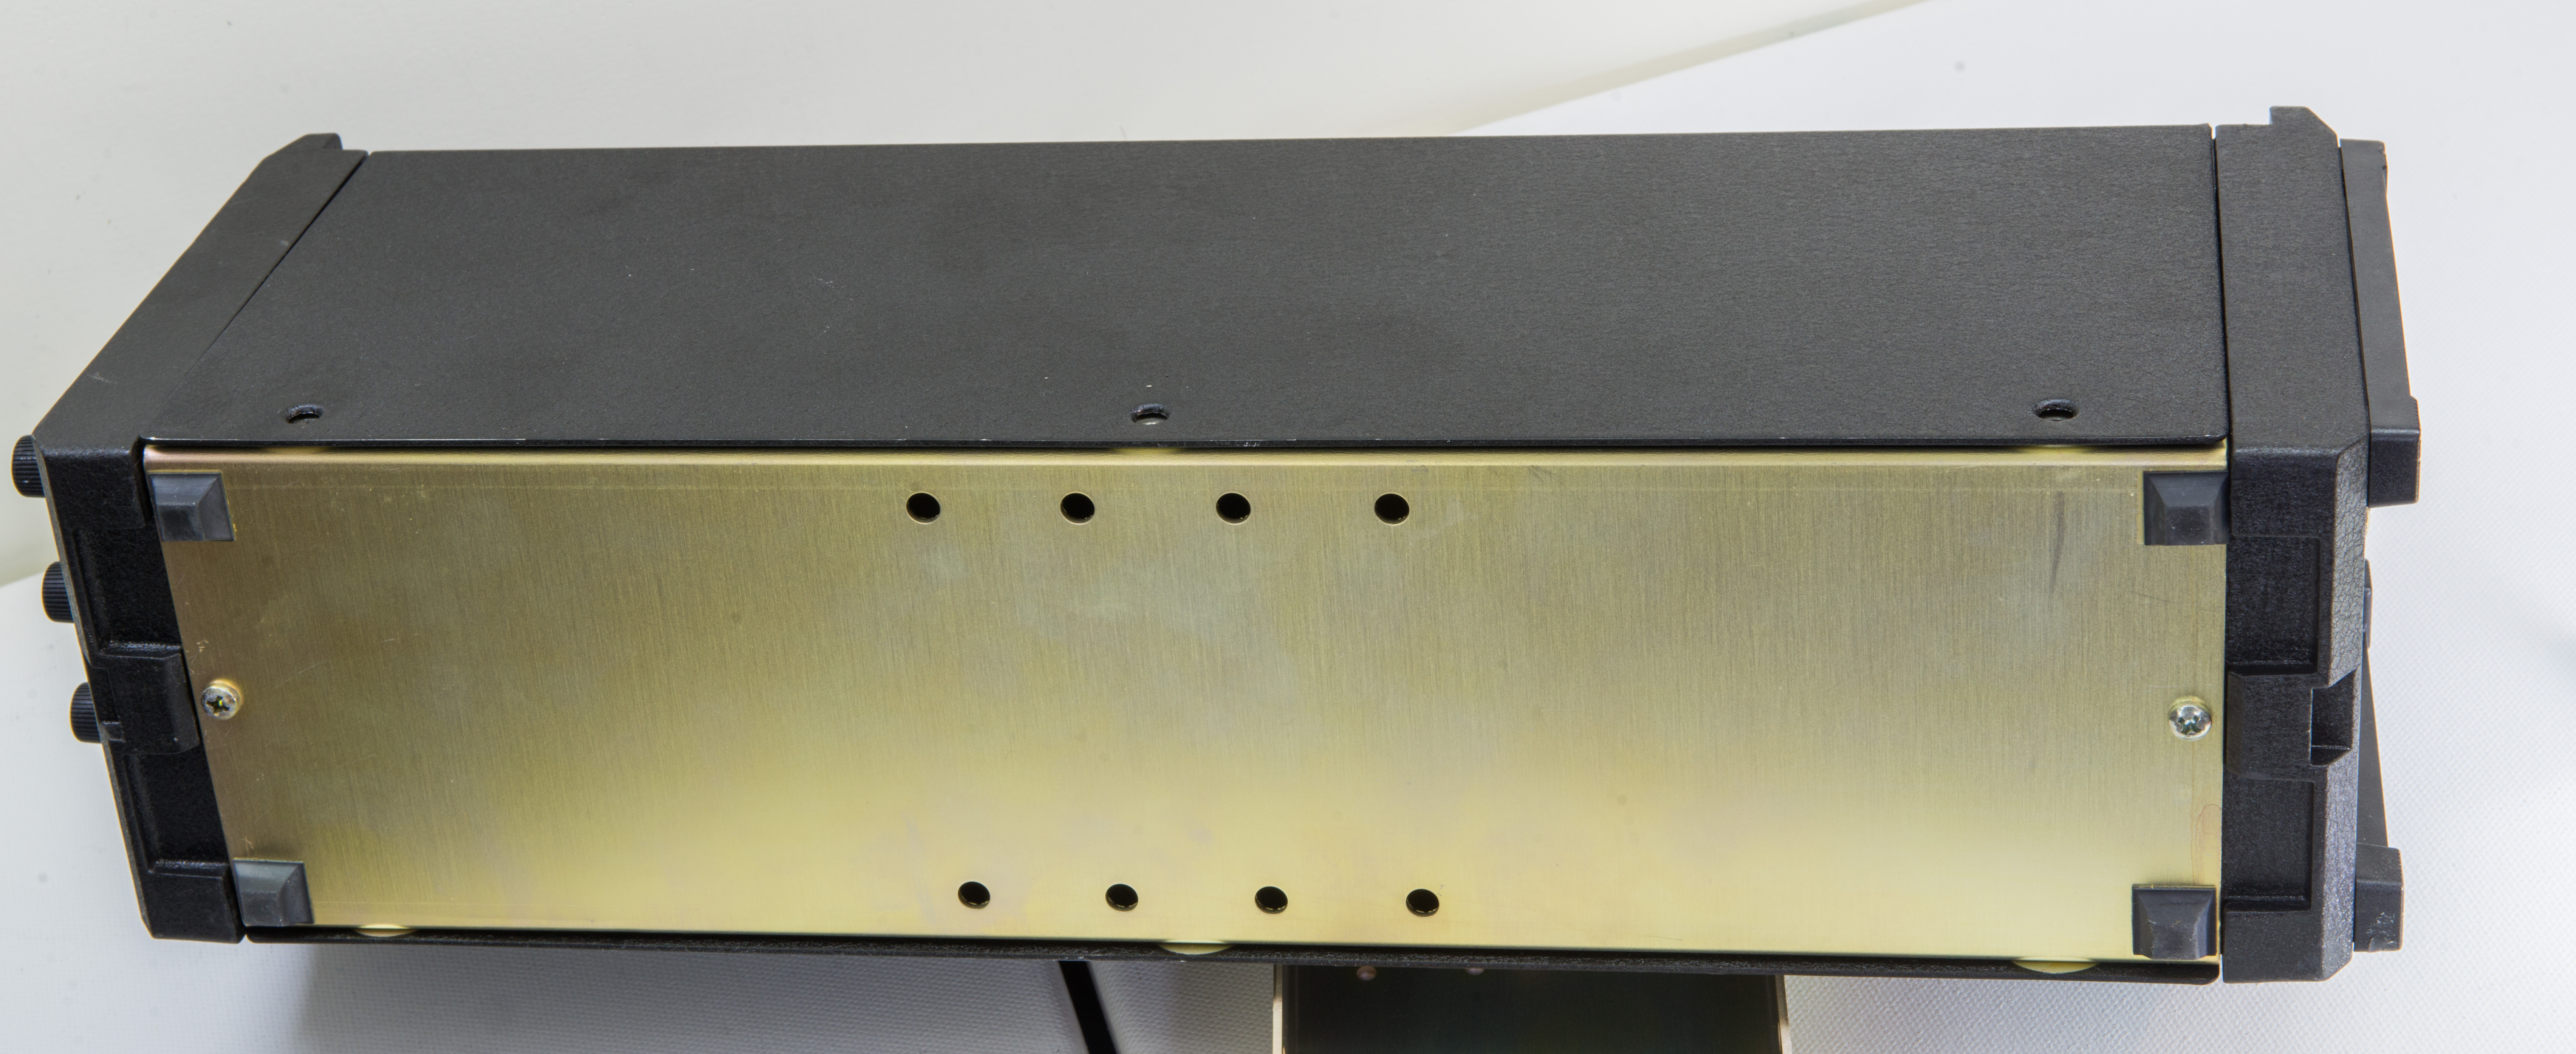
Image 18: Fluke 732B-7001 power pack, bottom side
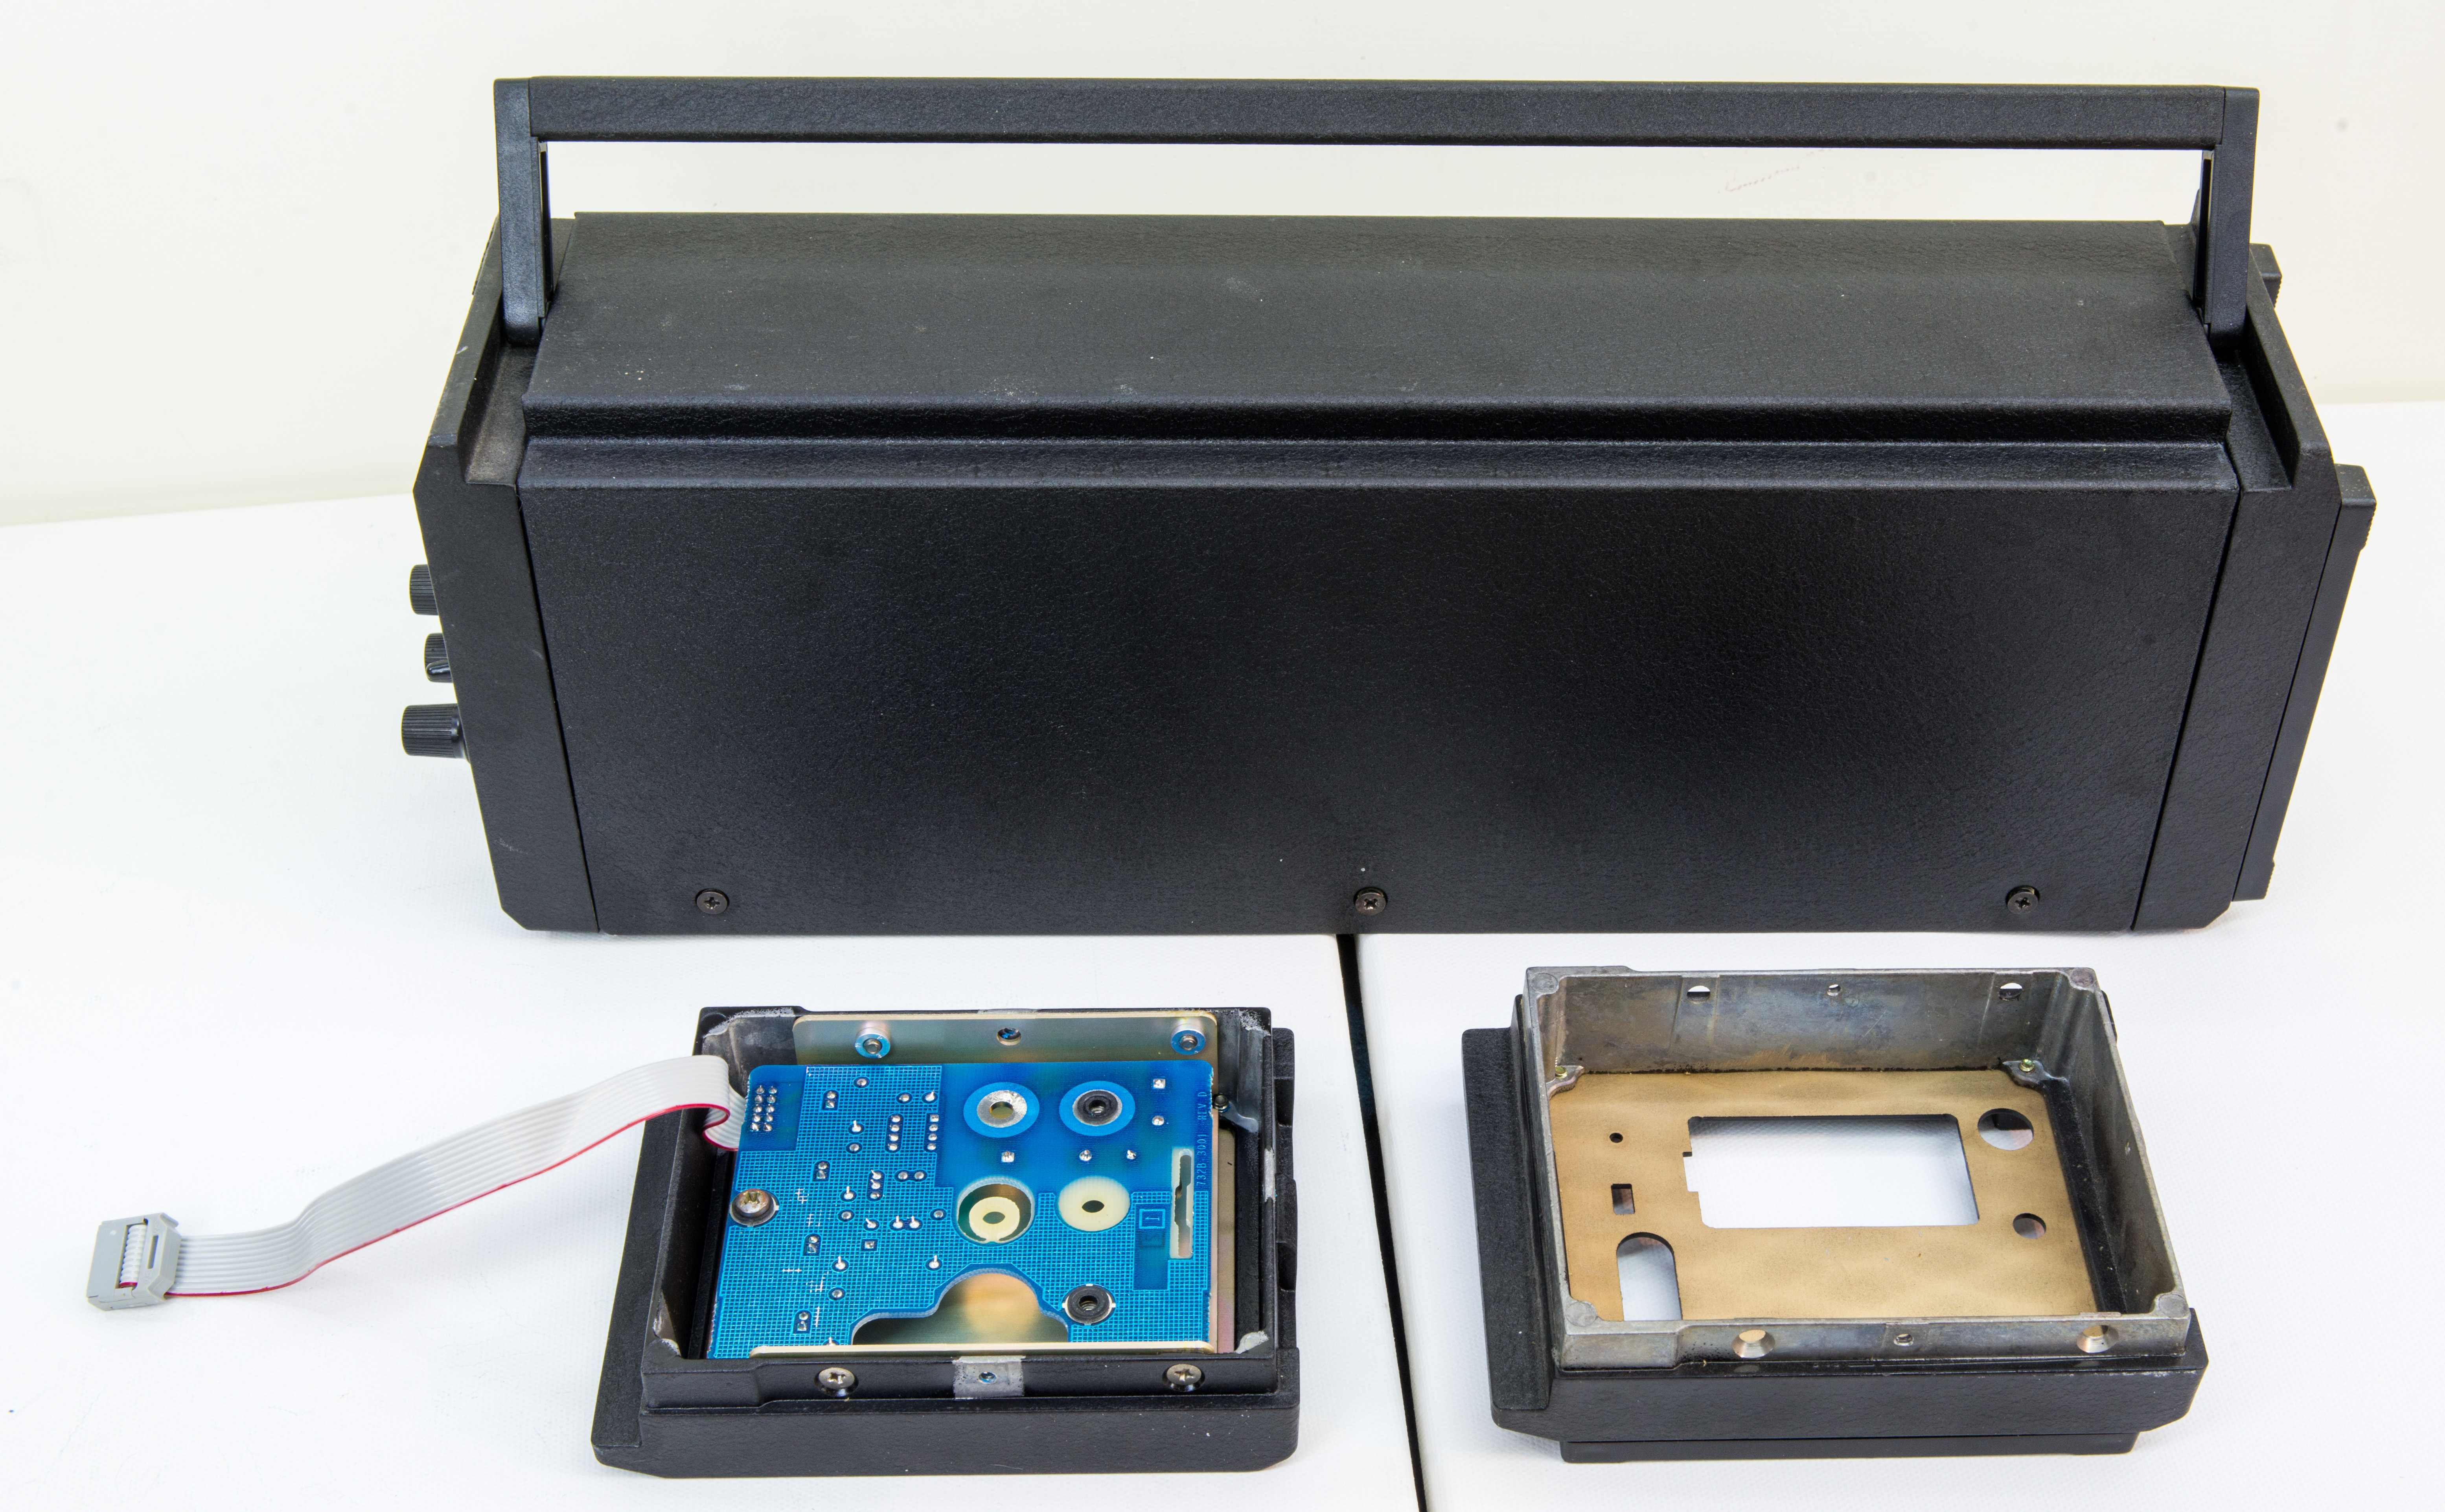
Image 19: Fluke SL935 with the remaining faceplates
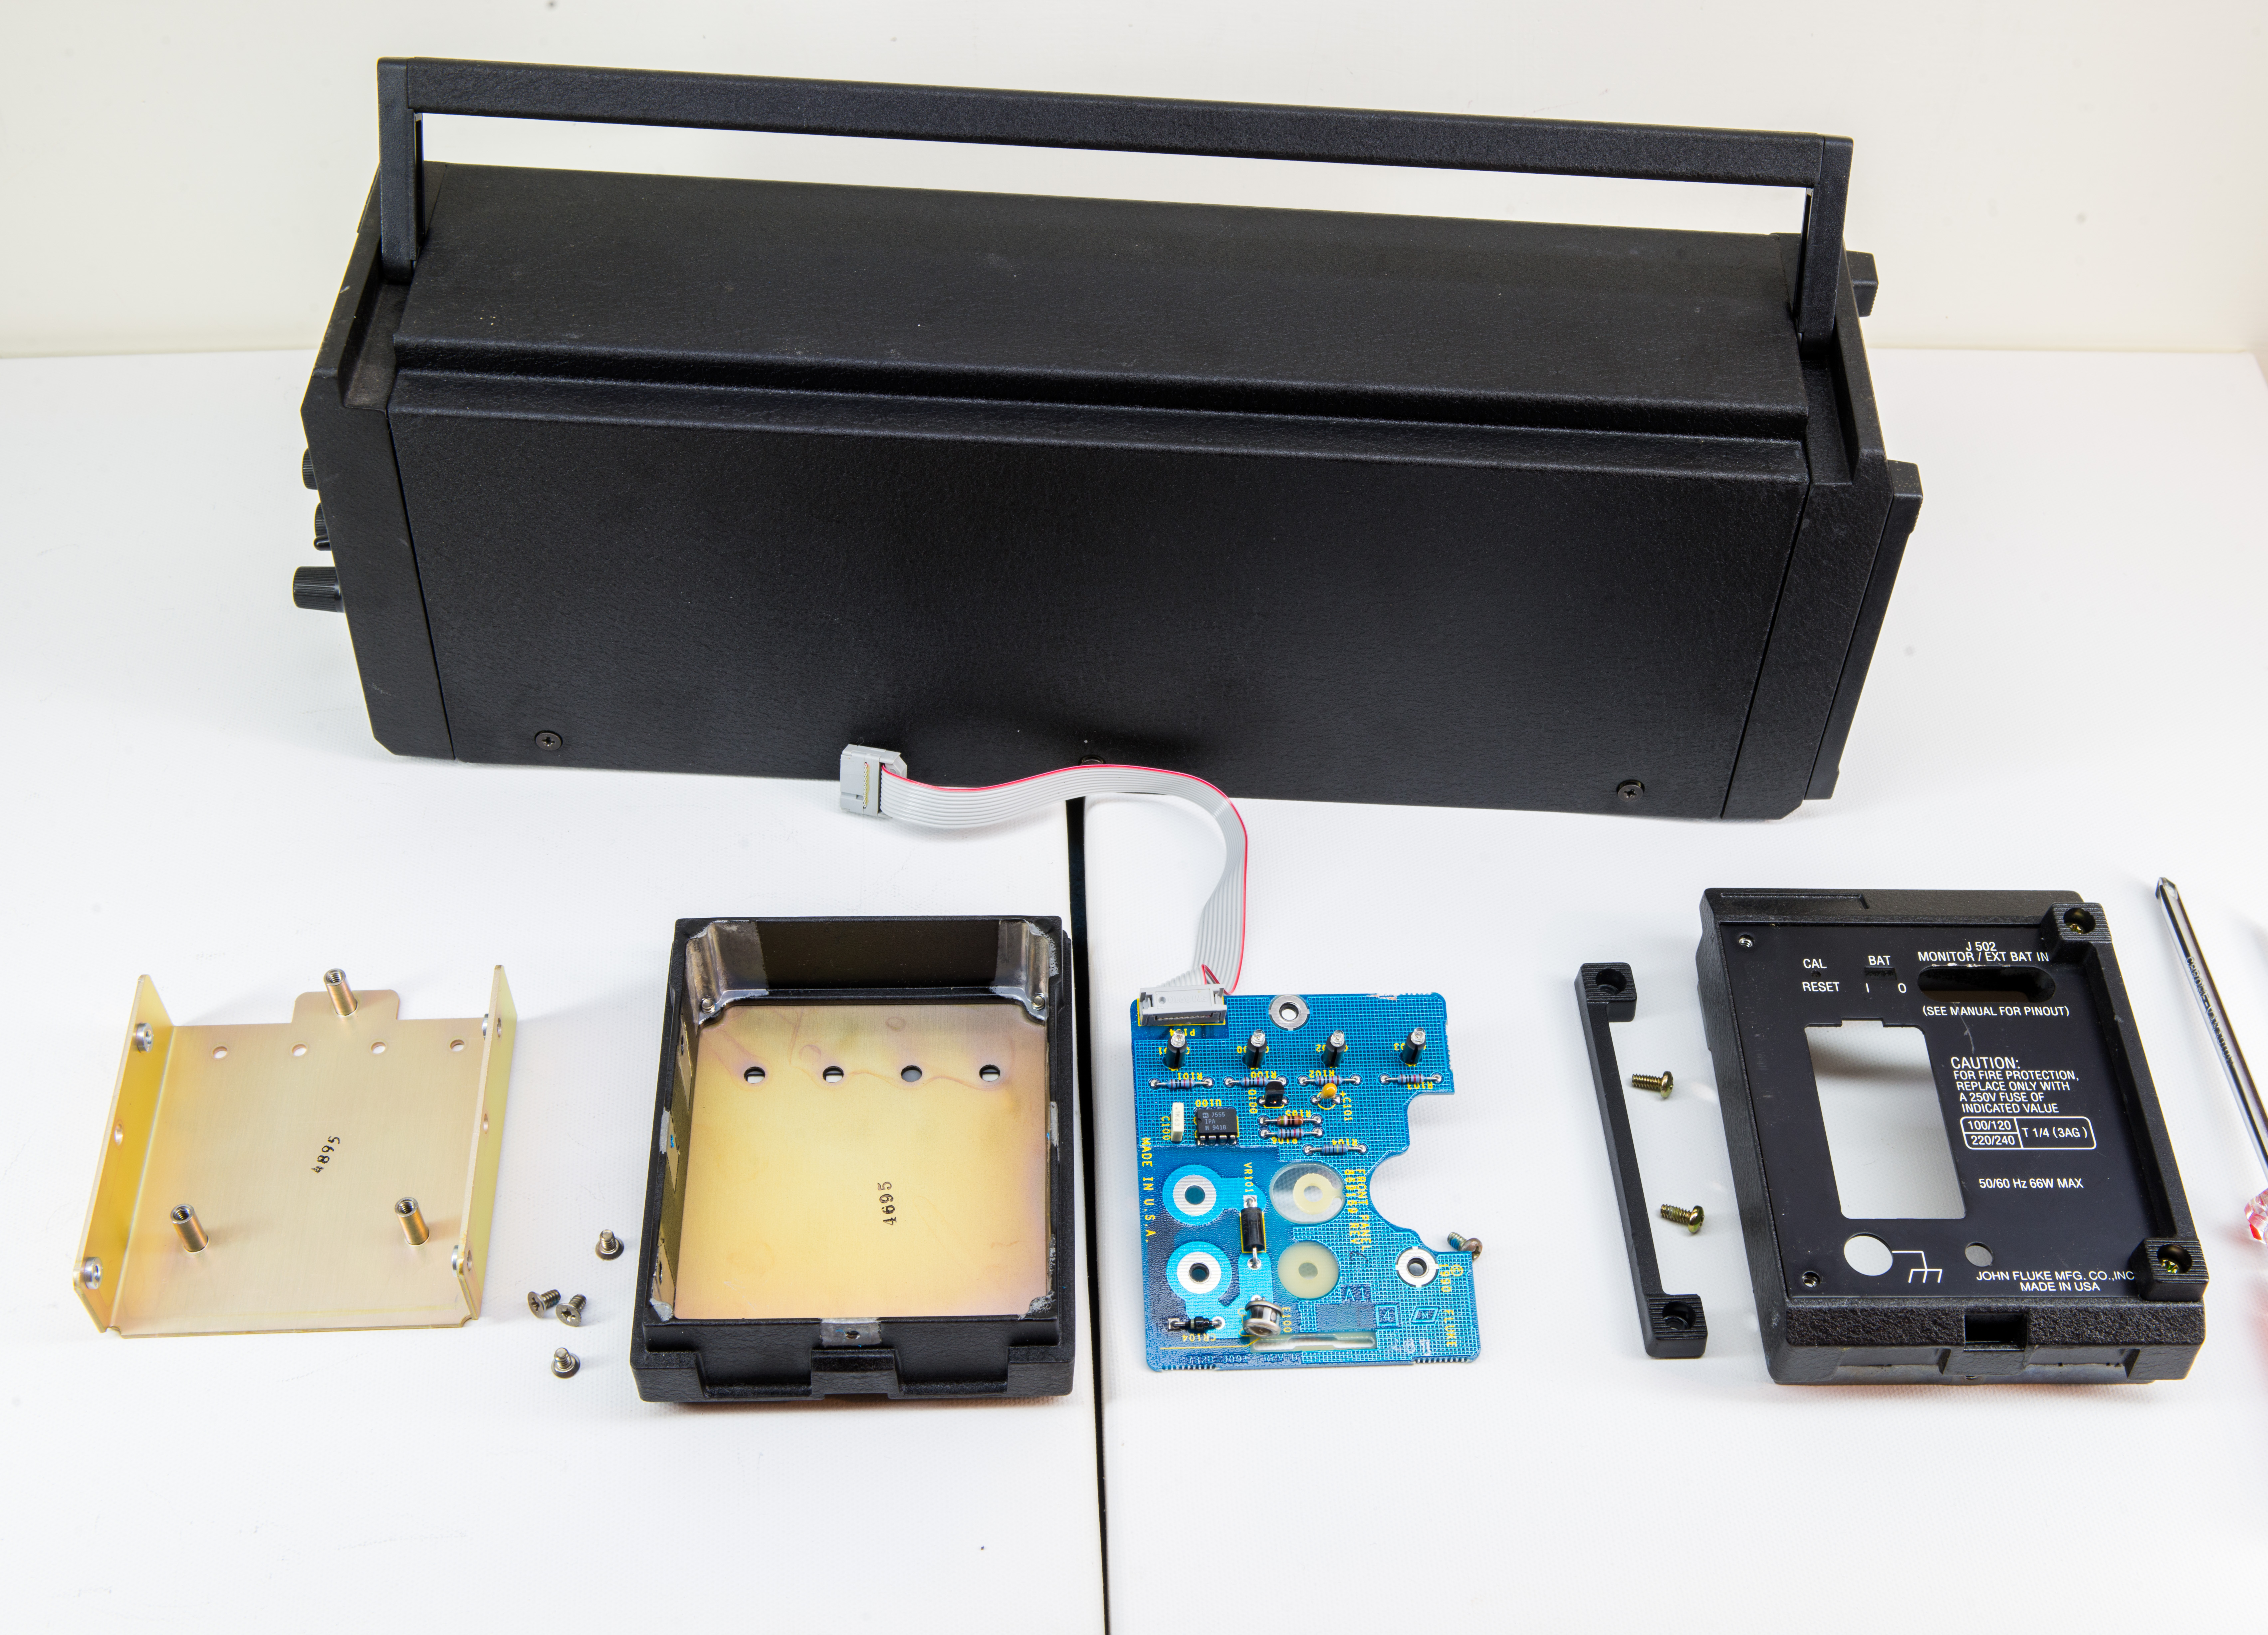
Image 20: Fluke SL935, remaining front and rear parts
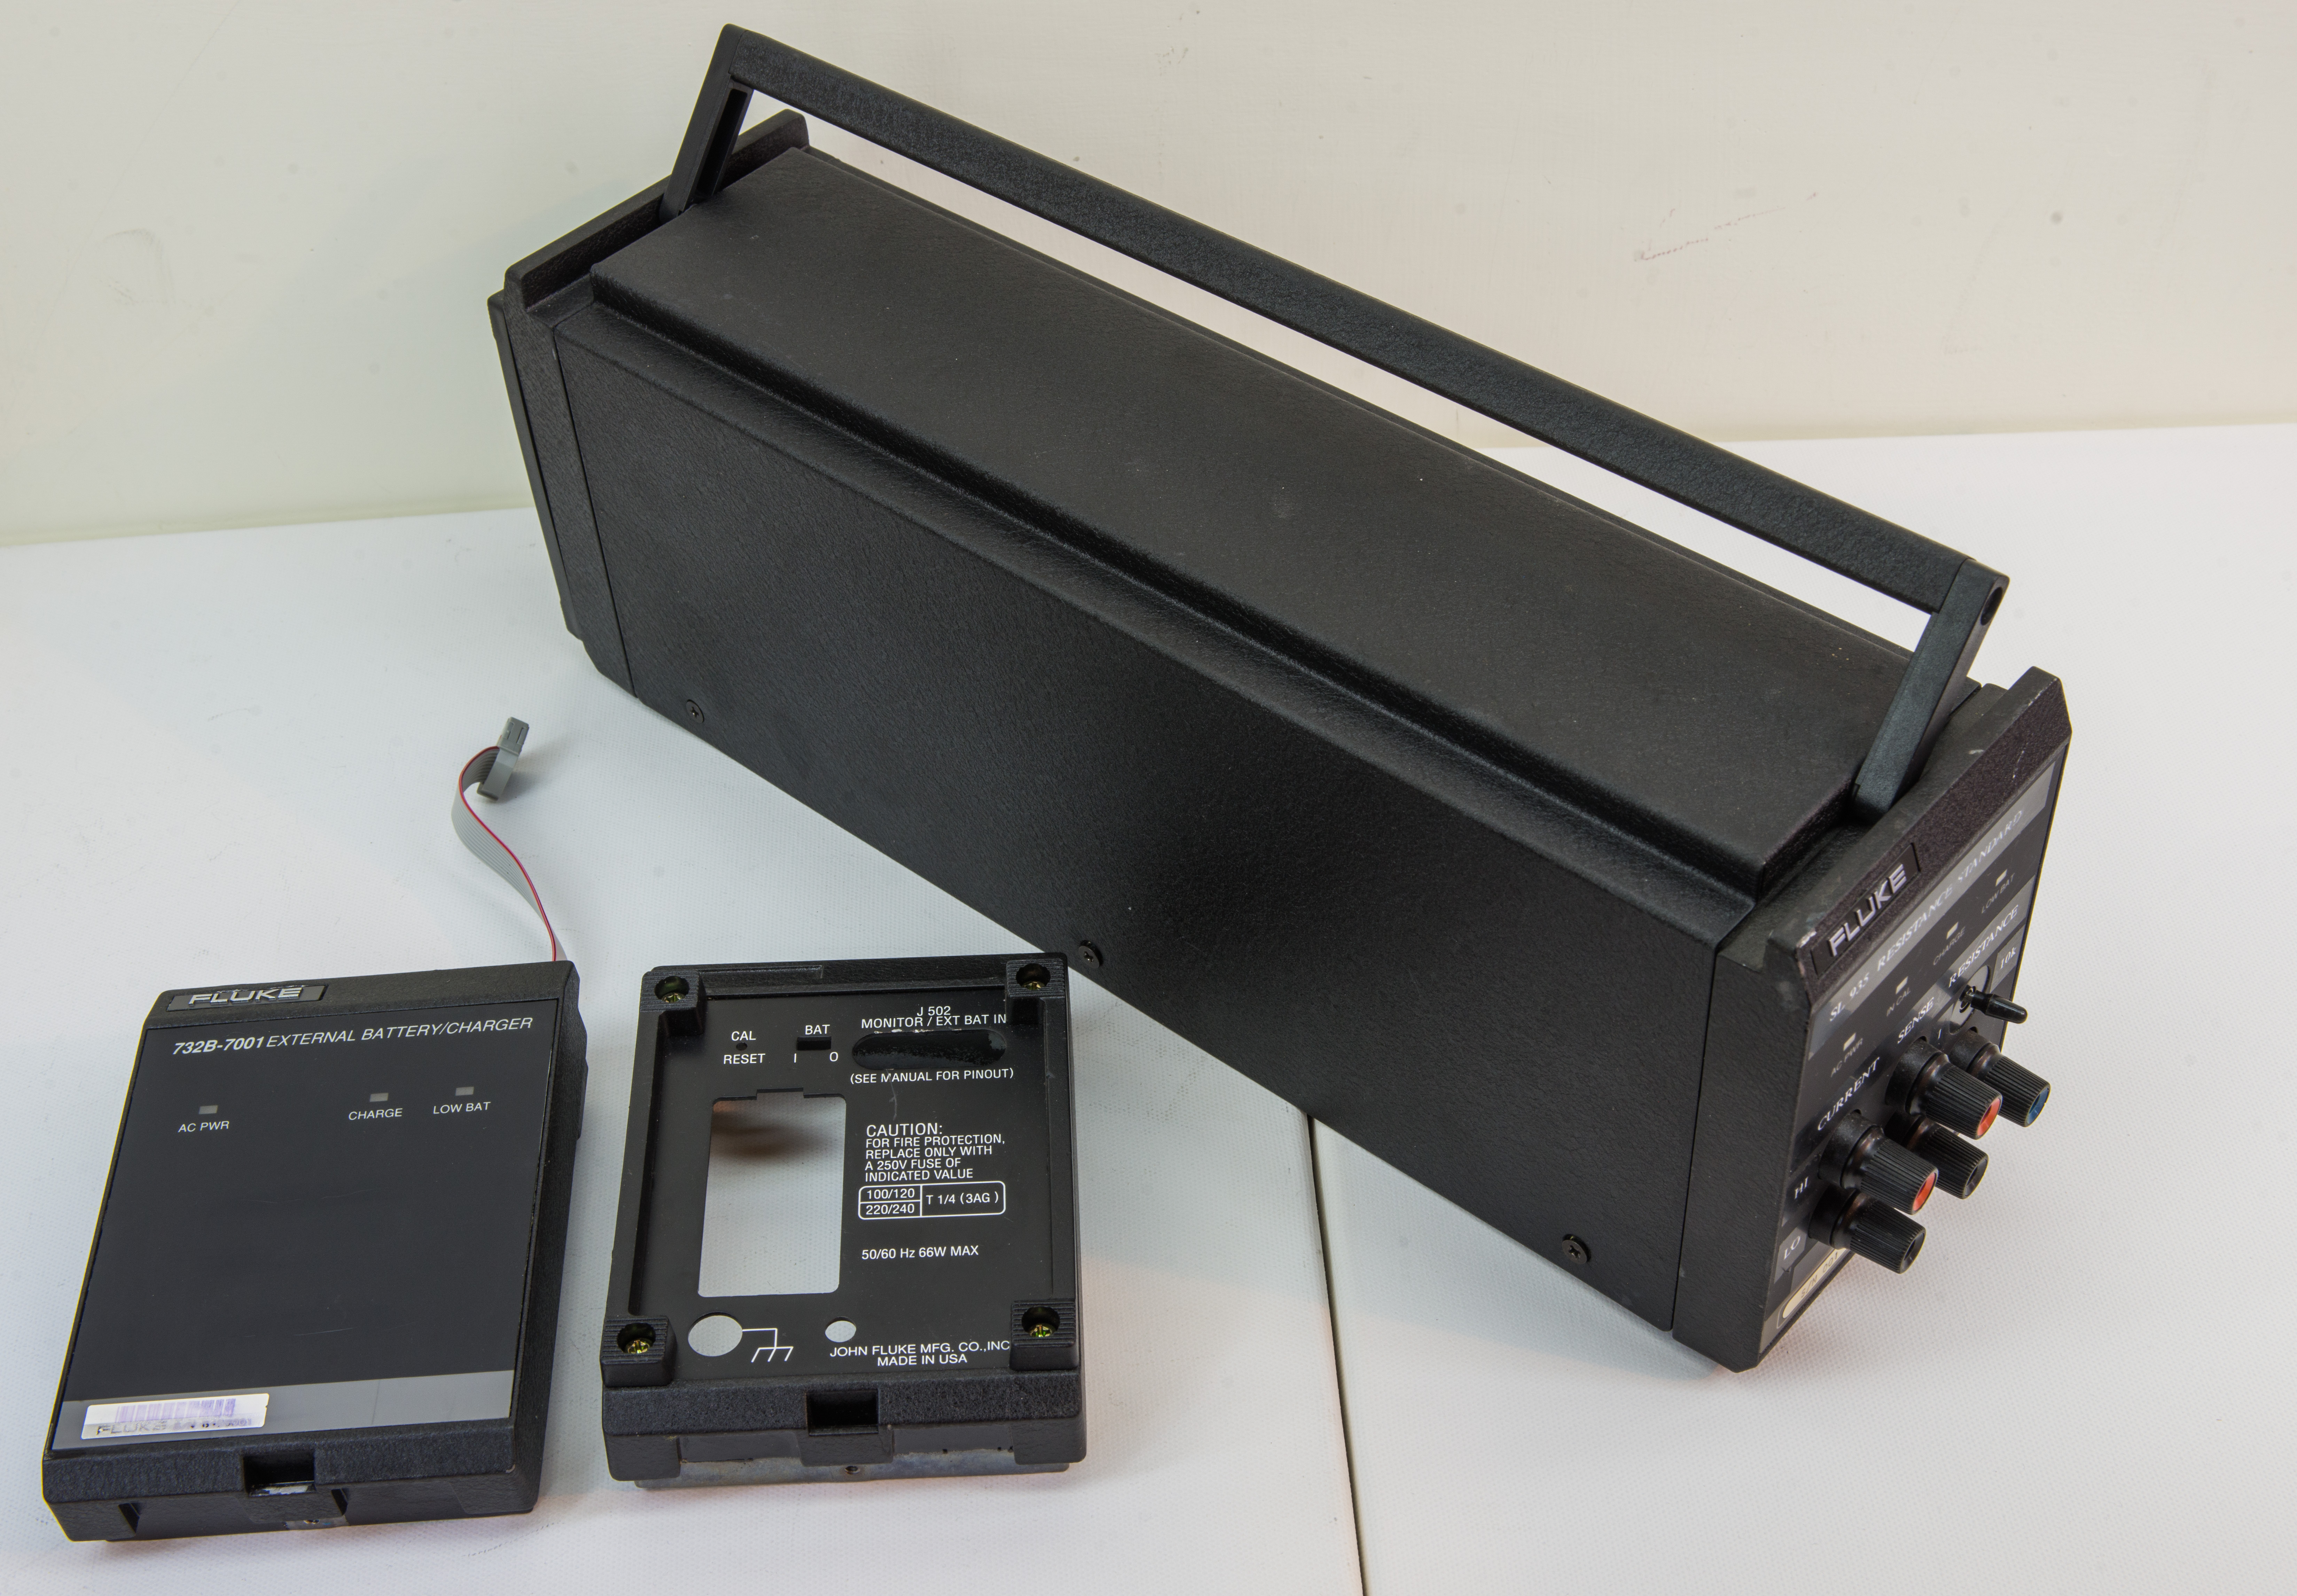
Image 21: Overall view
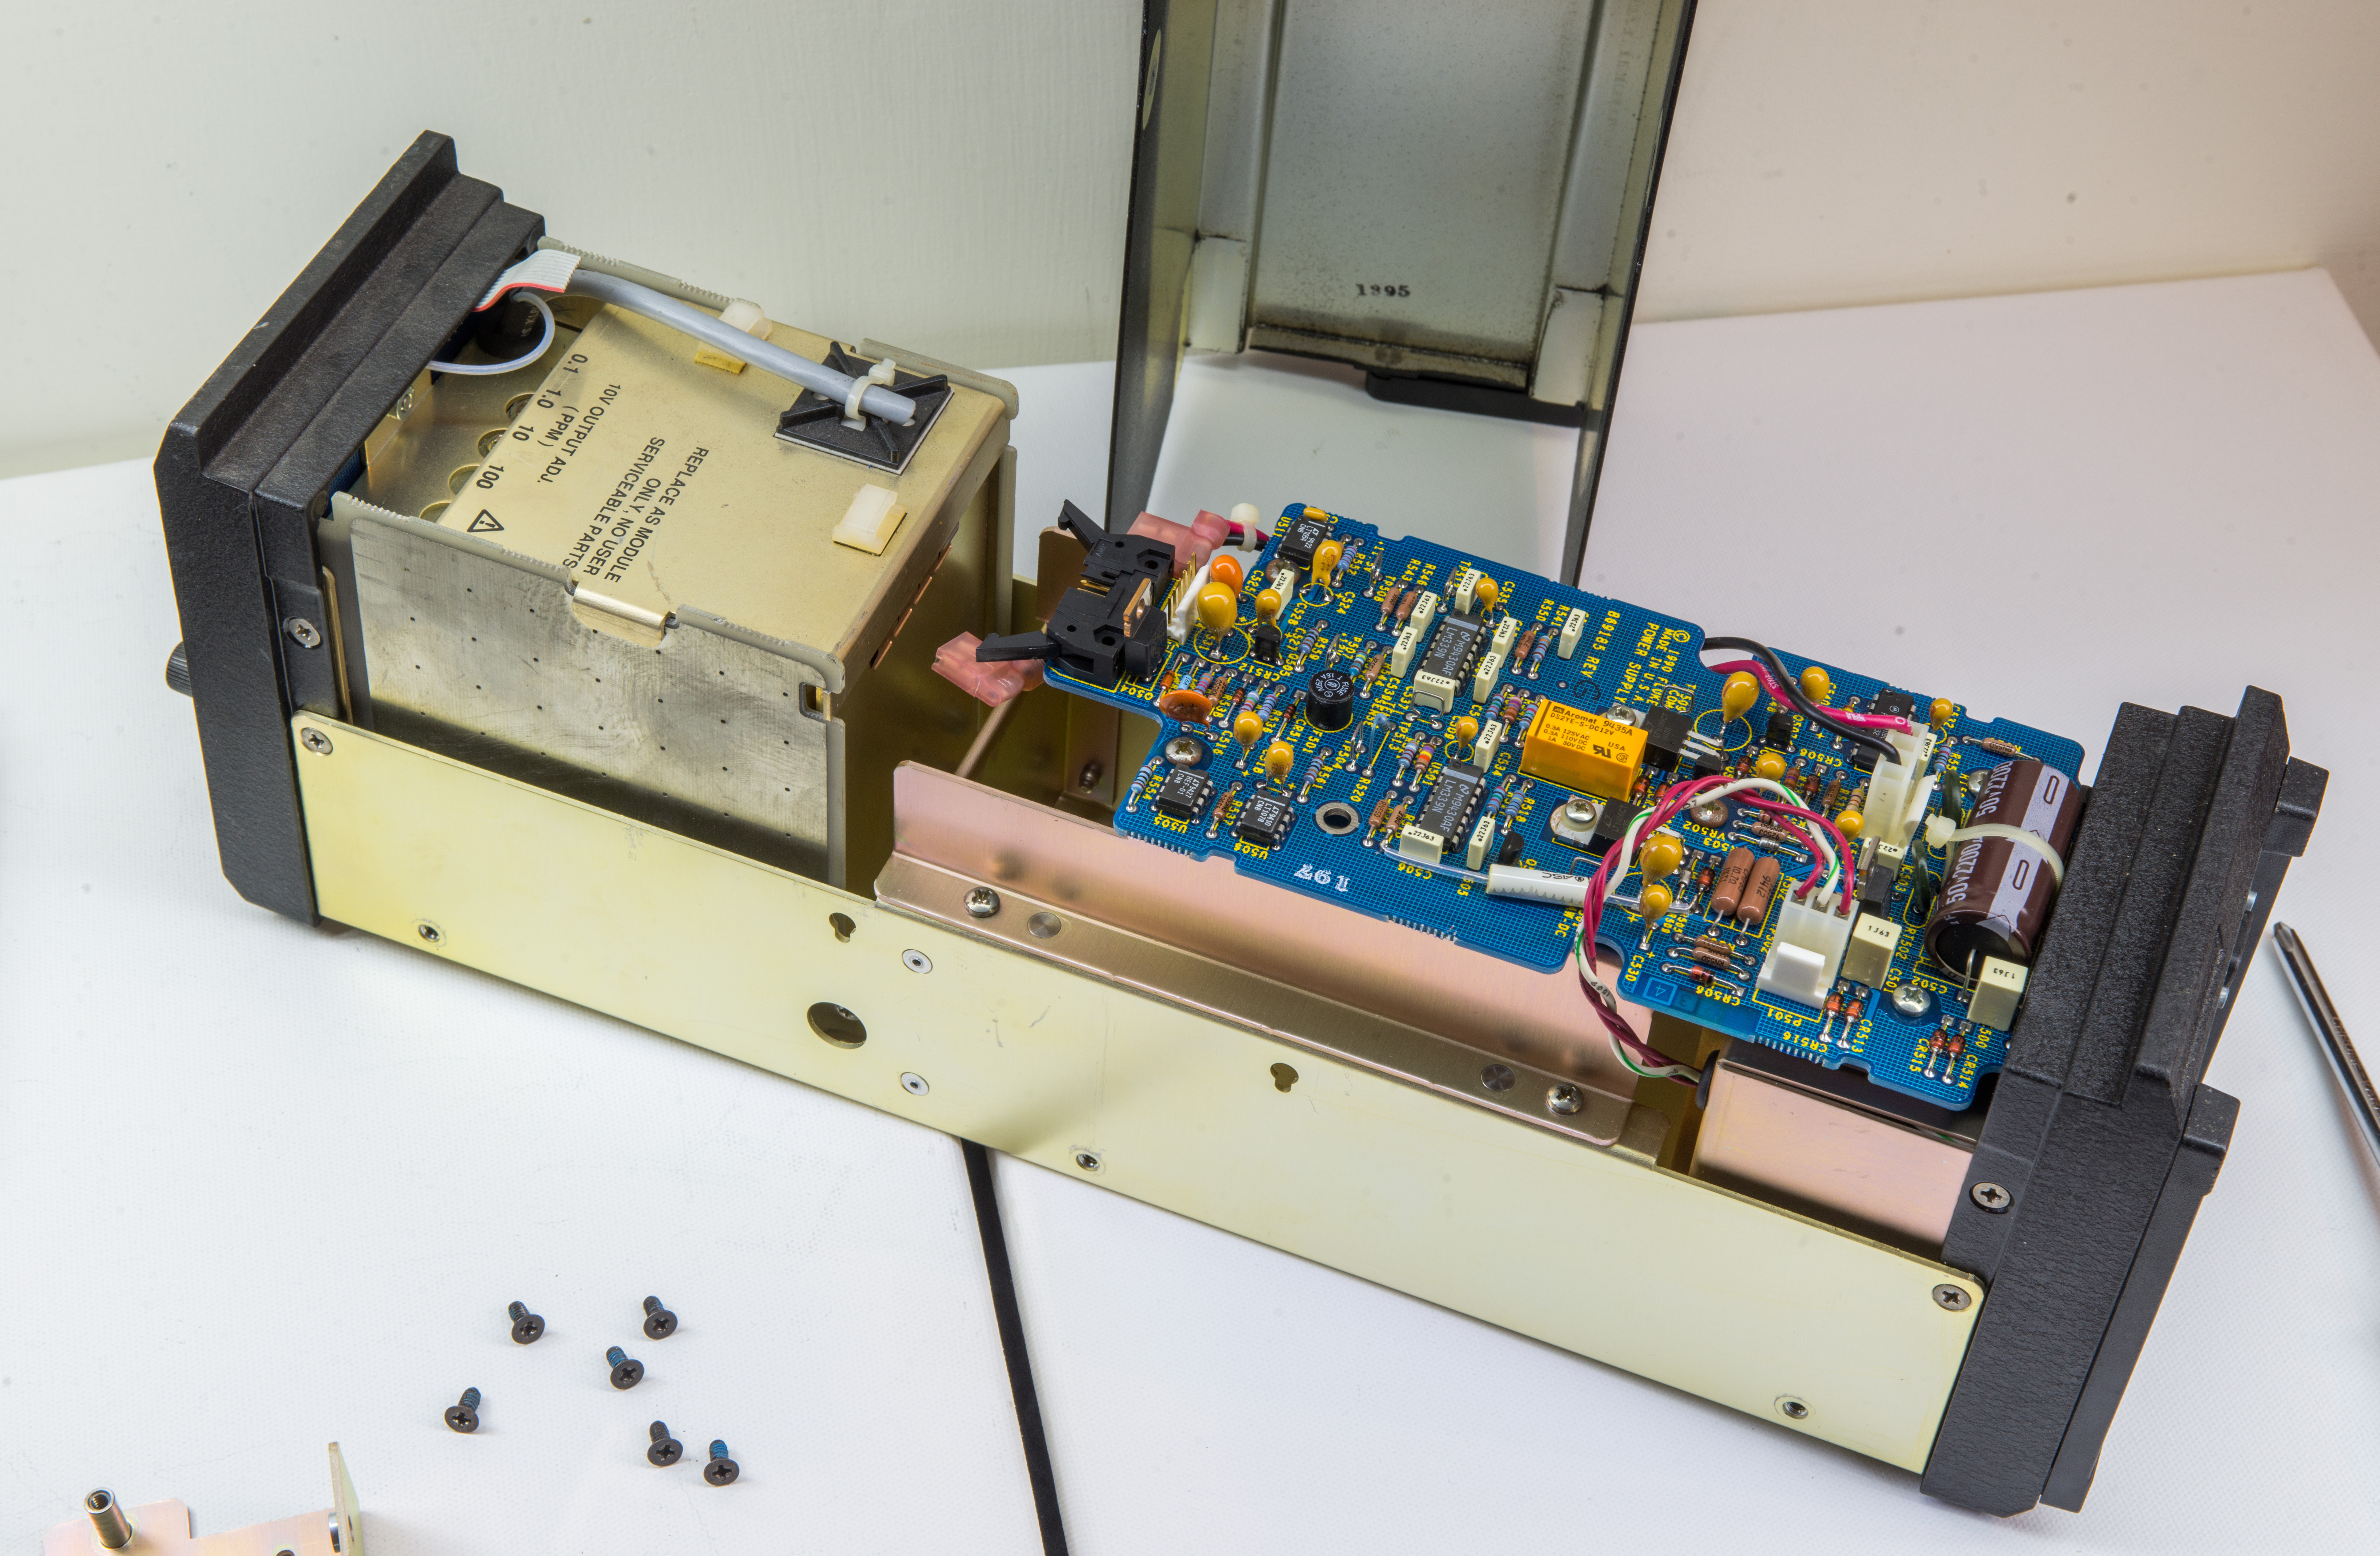
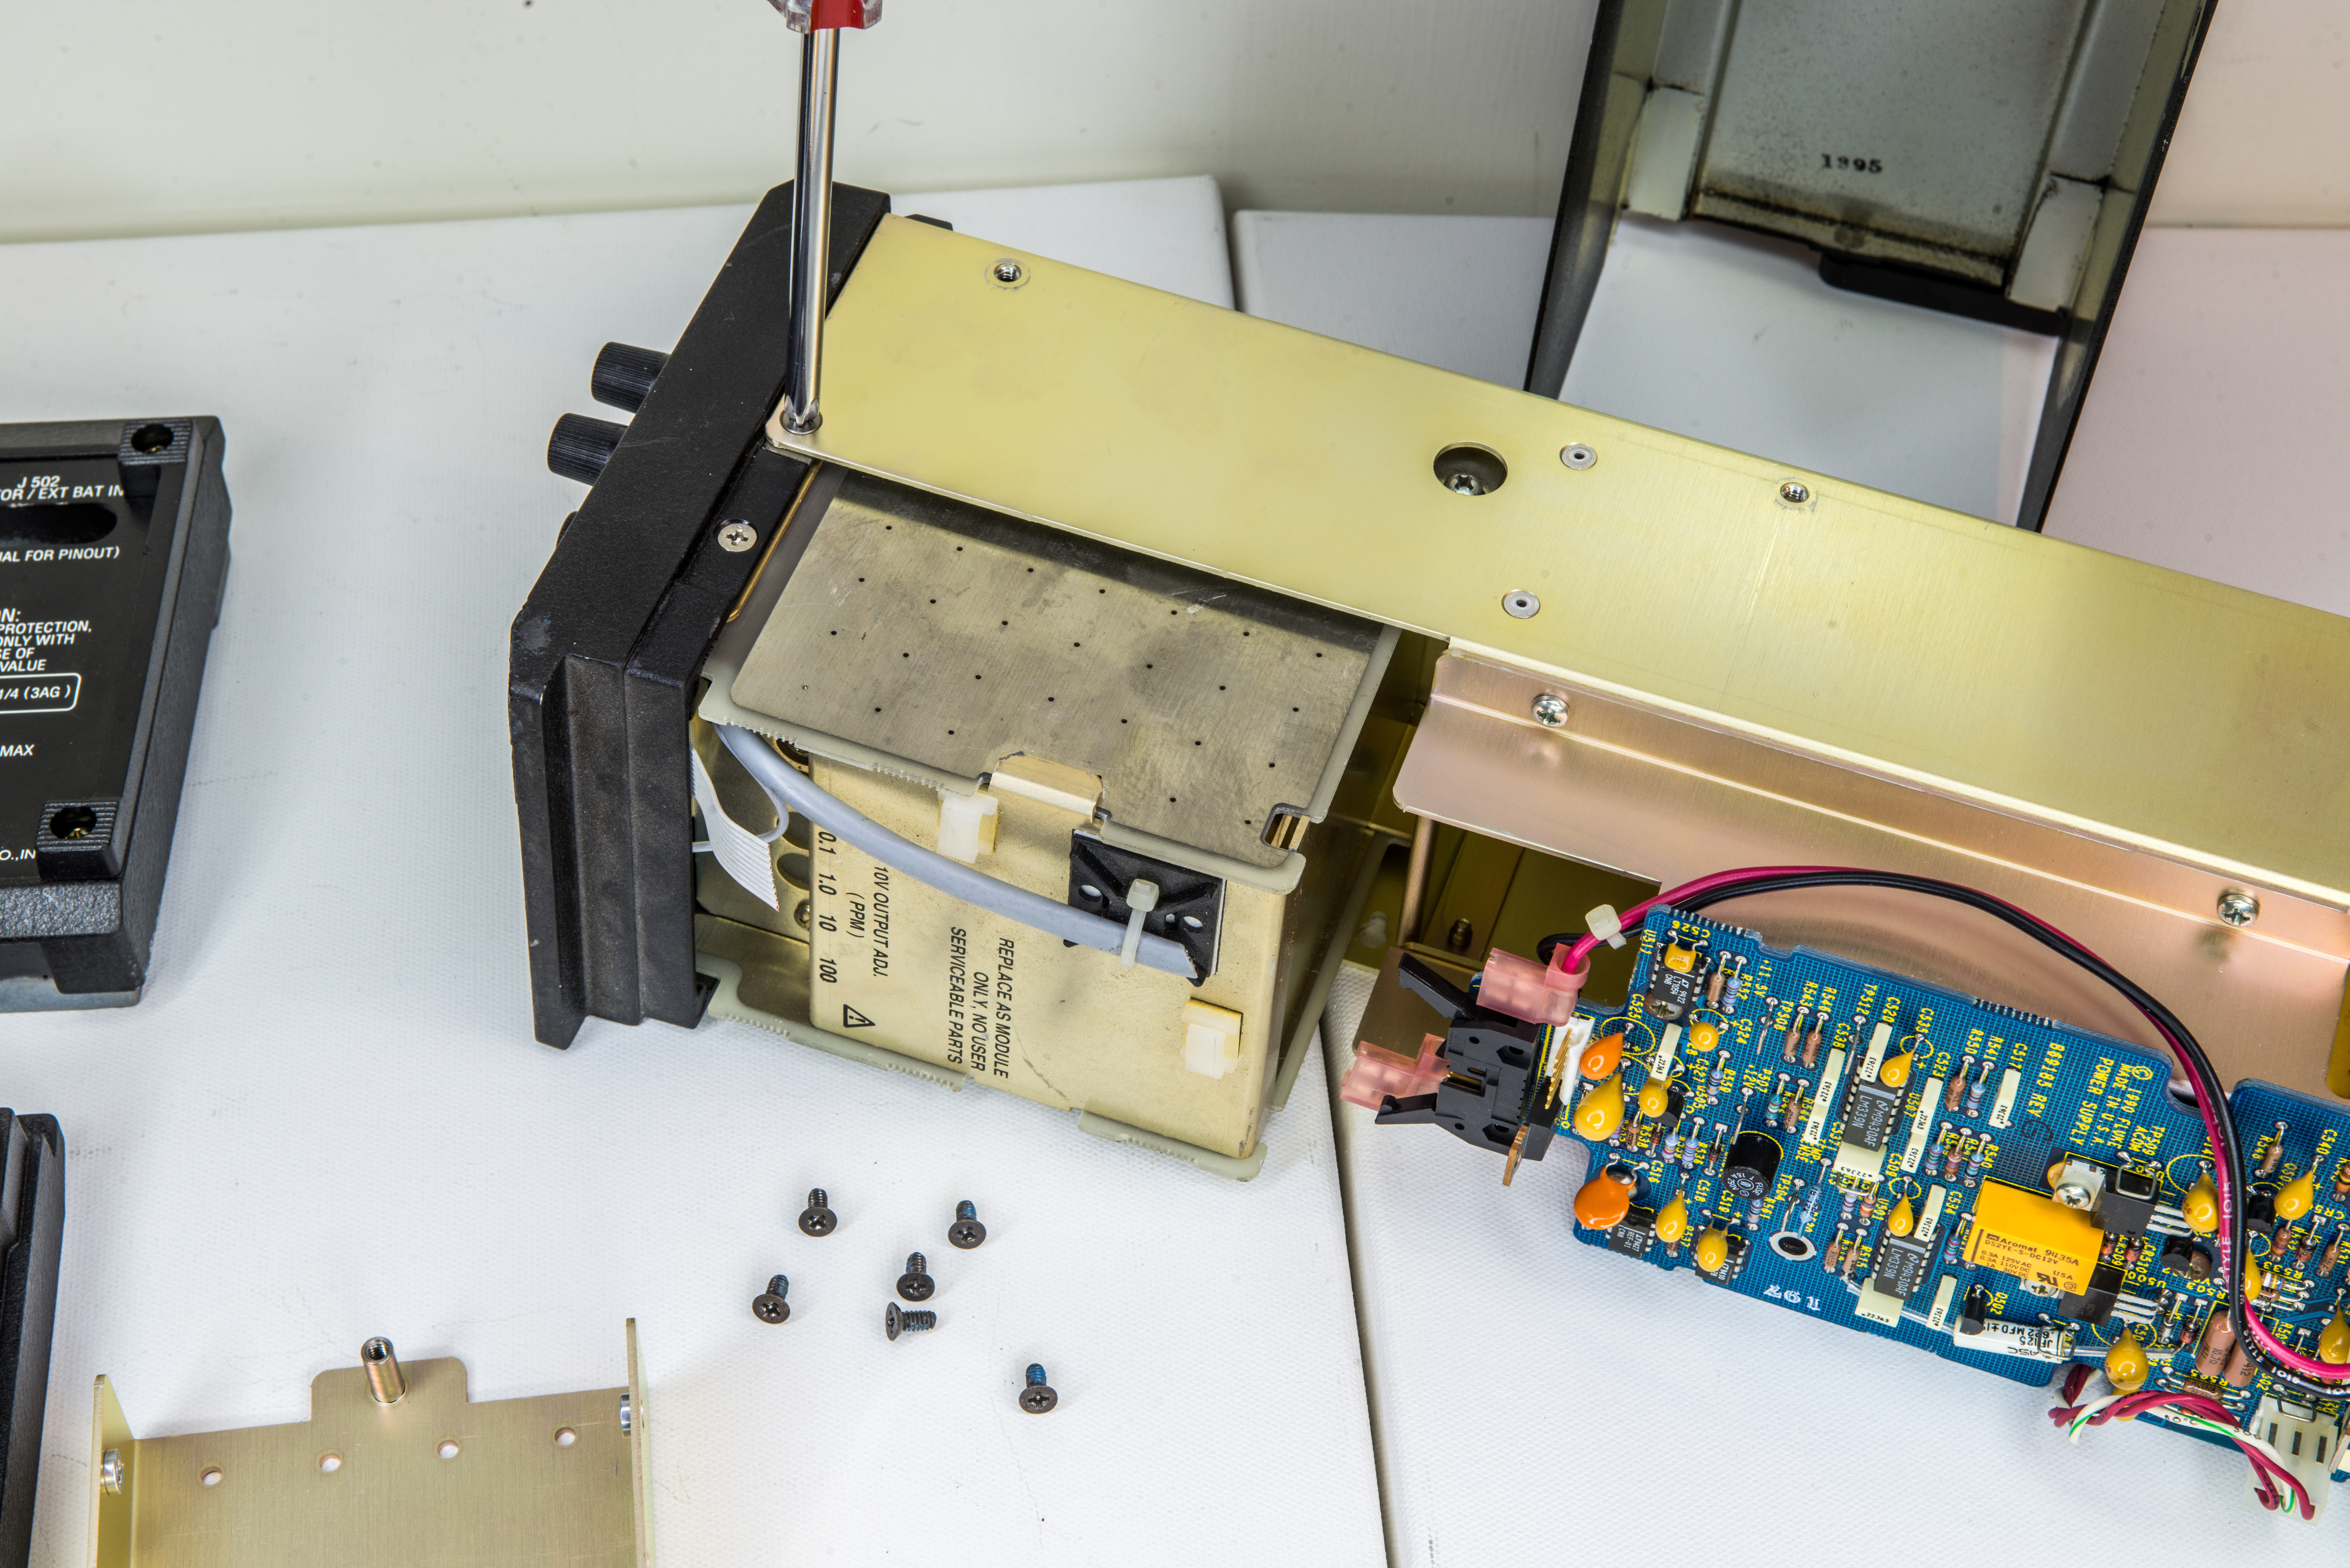
Image 22-23: Fluke SL935 without the top cover shield.
Initial 1 Ω measurement test before teardown
Initial 10 KΩ measurement test before teardown
Fluke 732B-7001 battery/charger design
Modifications and assembly SL935
Thermistor comparator circuit around U507 on charger board was modified to support lower +35°C temperature setpoint of SL935 oven thermistor. This was done by adding 15 KΩ resistor to existing R547 and adding 79.6 KΩ resistor to R549 to move window for proper IN CAL LED operation.
Resulting SL935 battery life test result with new Panasonic battery:
- 134 hours till “low batt” light with ambient temperature ~21 °C – rounded 5 days.
- Voltage changed from 13.0 V to 11.36 VDC. Low Batt LED tripped at 11.48 VDC.
- Charge in 24 hours increased voltage from 11.37V to 13.32V.
Temperature coefficient performance
Temperature coefficient results with oven
10 KΩ test after assembly with oven ON
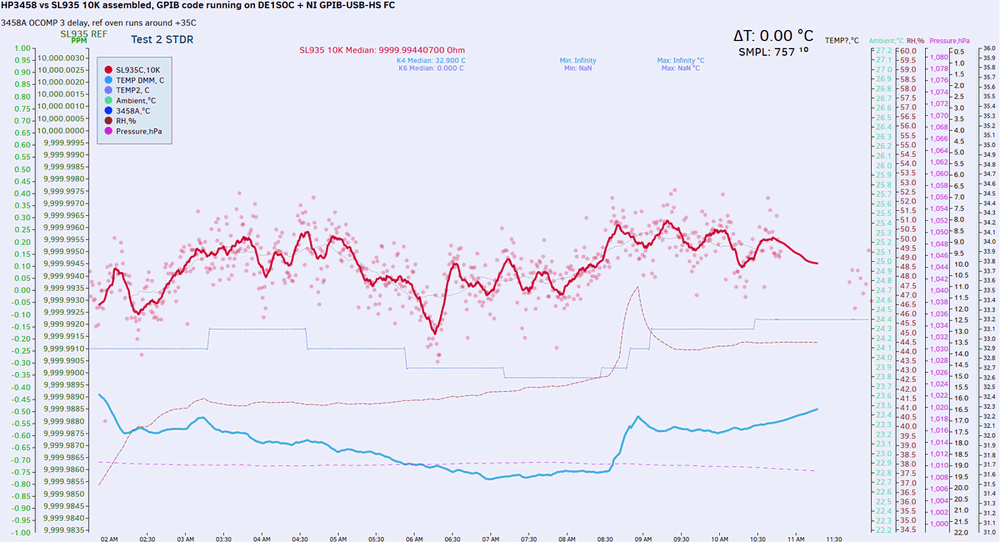
Image 24: Initial test with HP 3458A and 10 KΩ output.
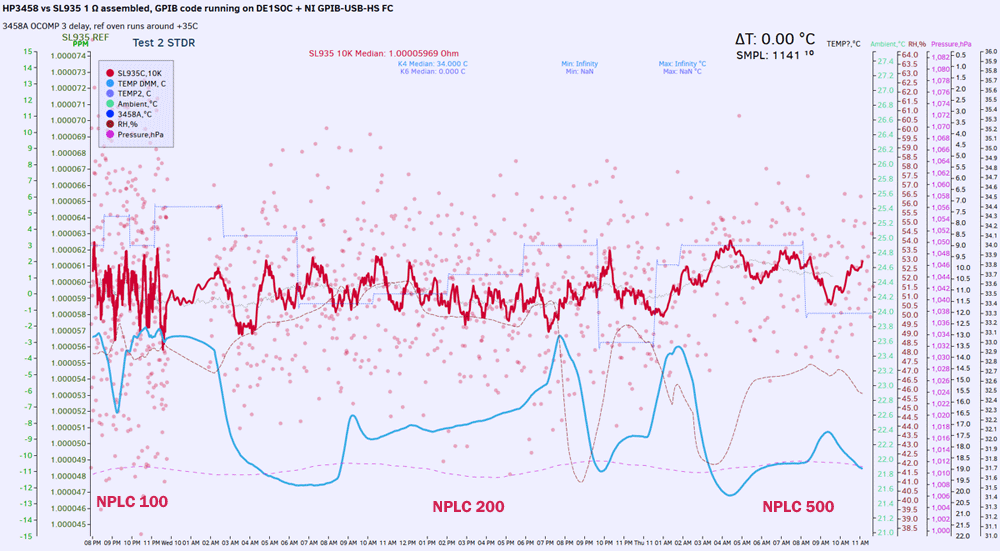
Image 25: Initial test with HP 3458A and 1 Ω output.
Initial graphs from HP 3458A(3). Settings are NPLC 200, DELAY 3, 4-wire 10KΩ fixed range.
Calibration procedure
Since Fluke SL935 is not a commercial product, we have to rethink exact calibration procedure for this unit. Given the level of this standard stability, expected to be at least no worse than Fluke 5720A calibrator specification, we can have procedure similar to Fluke 742A and Fluke 732B calibration. Below is listed procedure steps in sequence.
Performance specifications verified with both 1.0000 Ω and 10000 Ω outputs presented in Table 2.
| Parameter | Condition | Minimum | Typical | Maximum | Unit |
|---|---|---|---|---|---|
| 1.0000 Ω resistance output switch position | |||||
| Stability | ITEST =< 100 mA | 28 | 45 | ppm/year | |
| Resistance value | ITEST =< 100 mA | 1.0000 ±85ppm | Ω | ||
| Resistance tempco | 3 | ppm/°C | |||
| 10000 Ω resistance output switch position | |||||
| Stability | ITEST =< 500 µA | 3 | 6 | ppm/year | |
| Resistance value | ITEST =< 500 µA | 10000 ±9ppm | Ω | ||
| Resistance tempco | 1 | ppm/°C | |||
| Internal oven temperature | ±18-28 °C ambient | +34.0 | +35.0 | +36.0 | °C |
| Thermistor value | DB9 connector, pin 4-8 | 64.35 | 65.00 | 65.65 | KΩ |
| Battery life | After full charge | 168 | 180 | hours | |
| Charge time | 40 | hours | |||
Table 2: Fluke SL935 specification defined prior to calibration.
Resistance values calibration
STEP 1 – Initial pre-condition.
If standard was moved to the new bench station/location, it should be powered by mains and fully charged prior to calibration. Connect clean copper spade lug cables for both force and sense terminals of the Fluke SL935. Leave standard for minimum 2 hours to reach thermal equilibrium with environment. Lab temperature shall be kept in range +20…+25 °C.
STEP 2 – Connect resistance bridge and 10 KΩ reference standard for 10 KΩ comparison.
To establish high accuracy resistance transfer it’s recommended to use precision resistance bridge, such as Measurements International 6010 or Guildline Instruments 6622A in combination with high-stability 10 KΩ resistance reference, such as IET Labs SR104. Maintain reference standard as per standard laboratory guidelines.
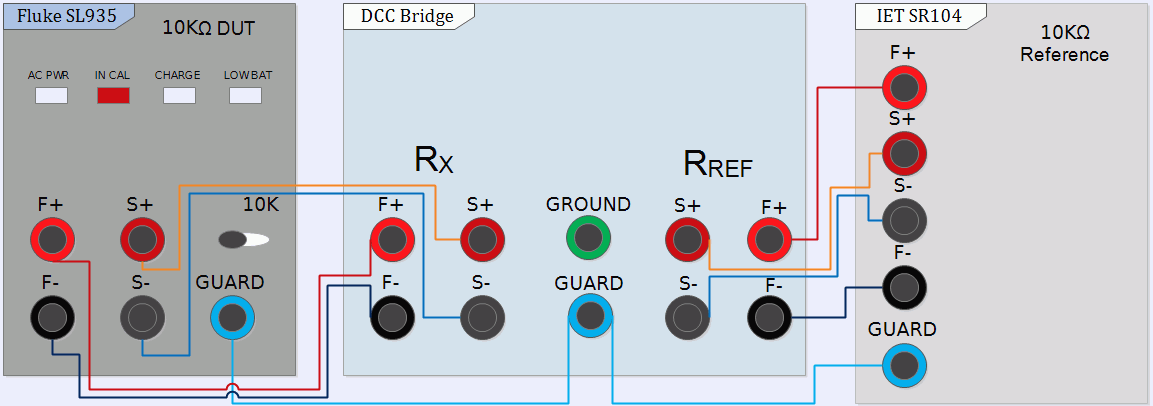
Image 26: Connections for RX Fluke SL935 DUT, DCC bridge system and reference RREF IET SR104.
Use clean metrology-grade low capacitance cables with insulation resistance >1 TΩ to obtain best results. Use 10k switch position on Fluke SL935 front panel, to bring 10 KΩ at the front terminals.
Ensure that SL935 is disconnected from AC power to avoid possibility of ground loops and unwanted EMI/RFI noise pickup.
STEP 3 – Thermal soaking delay.
Let the all equipment and cables rest 15 minutes to reach thermal equilibrium to reduce risk of unwanted thermal EMF errors. Perform internal SL935 thermistor measurement, to establish internal oven temperature during the calibration. Nominal thermistor resistance during normal operation is 65.00 KΩ ±1%.
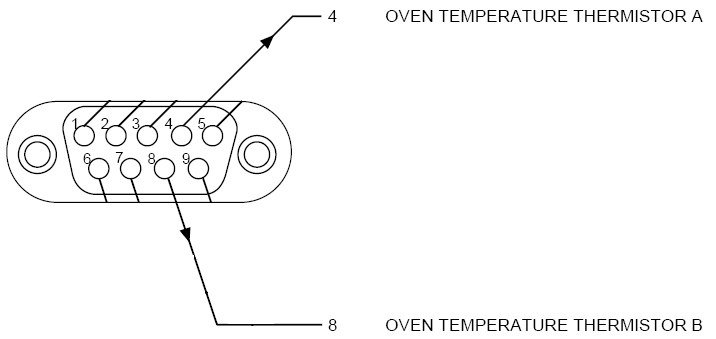
Image 27: Fluke SL935 thermistor pinout on rear DB9 port.
Thermistor can be probed from rear DB9 connector, using pin 4 and pin 8, same pinout as Fluke 732B DC Voltage Standard.
STEP 4 – Perform measurement.
Perform resistance measurement using known value of reference RREF resistance standard and 1:1 bridge comparison mode. Follow standard metrology guidelines for bridge operation for 1:1 transfer.
STEP 5 – Replace 10 KΩ reference standard and connect 1 Ω reference standard for 1 Ω comparison.
To establish high accuracy resistance transfer it’s recommended to use precision resistance bridge, such as Measurements International 6010 or Guildline Instruments 6622A in combination with high-stability 1 Ω resistance reference, such as Leeds and Northrup (L&N) 4210 Thomas-type. Maintain reference standard as per standard laboratory guidelines.
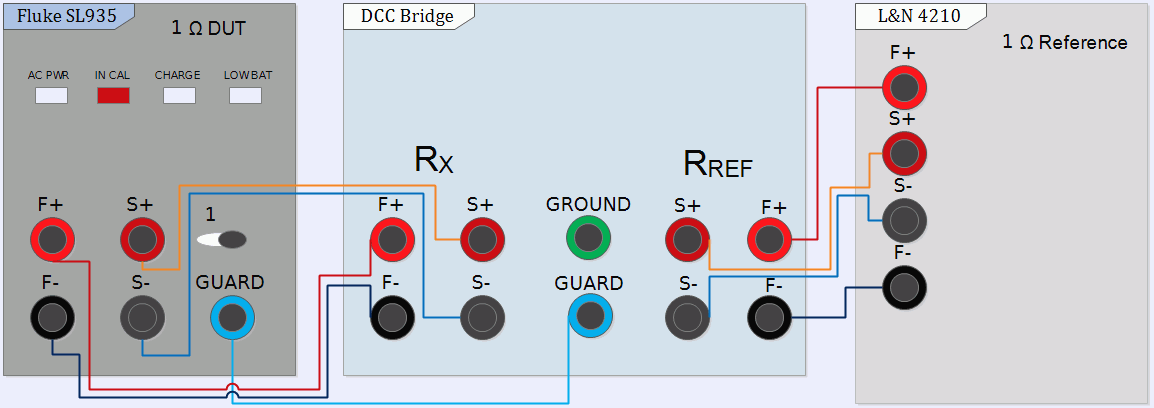
Image 28: Connections for RX Fluke SL935 DUT, DCC bridge system and reference RREF L&N 4210.
Use clean metrology-grade low capacitance cables with insulation resistance >10 GΩ to obtain best results. Use 1 switch position on Fluke SL935 front panel, to bring 1 Ω at the front terminals.
Ensure that SL935 is disconnected from AC power to avoid possibility of ground loops and unwanted EMI/RFI noise pickup.
STEP 6 – Thermal soaking delay and oven temperature measurement.
Let the all equipment and cables rest 15 minutes to reach thermal equilibrium to reduce risk of unwanted thermal EMF errors. Perform internal SL935 thermistor measurement, to establish internal oven temperature during the calibration. Nominal thermistor resistance during normal operation is 65.00 KΩ ±1%. Image 28 can be referenced for thermistor probe pinout connections.
STEP 7 – Perform measurement.
Perform resistance measurement using known value of reference RREF resistance standard and 1:1 bridge comparison mode. Follow standard metrology guidelines for bridge operation for 1:1 transfer.
STEP 8 – Assign resistance value and reconnect AC power.
Once measurement is complete, disconnect test equipment and connect Fluke SL935 DUT to AC mains to maintain oven operation and battery charge.
Assign determined resistance value to each of Fluke SL935 resistance outputs, using metrology-standard guidelines and lab methodology. Include uncertainty with assigned value for further use.
Temperature coefficient calibration
Typical metrology range for high-performance resistance transfer standards is +18 °C to +28 °C, which gives 10 degree window for temperature stability evaluation. Suggested workflow to perform this calibration is outlines in steps below.
If standard was moved to the new bench station/location, it should be powered by mains and fully charged. Connect clean copper spade lug cables for both force and sense terminals of the Fluke SL935. Leave standard for minimum 2 hours to reach thermal equilibrium with environment. Lab temperature shall be kept in range +20…+25 °C, following standard metrology guidelines in place.
For tempco test airbath chamber that can fit Fluke SL935 shall be used. Recommended air bath is Measurement International Model 9300A. Temperature range shall be adjustable in range from +18 °C to +28 °C to allow full metrology range calibration.
Only DUT need to be subjected to temperature variation, to establish temperature/resistance correlation. Ensure that SL935 is disconnected from AC power to avoid possibility of ground loops and unwanted EMI/RFI noise pickup.
Perform automated measurement, following same connections and procedure as in STEP 2-4 during resistance value calibration, but this time with air bath temperature variation in 1 °C steps or finer. As the result there should be at least 10 points available with measured resistance:
Formula defined from the calibration, using 0.30 mADC test current:
RTEMP = R[TREF] × (1 + α × (TEMP – TREF) + β × (TEMP – TREF)2 ),
Where for 10 KΩ values are:
α = 0.00890E-6 Ω/°C,
β = 0.00042E-6 Ω/°C2,
R[TREF] = 9999.9747 Ω and TREF = +23.00 °C.
Calculated resistance table would be:
| Resistance value | Airbath Temperature | Measurement Uncertainty | Total resistance deviation from +23.00 °C |
|---|---|---|---|
| 9999.97436 Ω | +18 °C ±0.05 °C | ±0.33 ppm | -0.034 ppm |
| 9999.97441 Ω | +19 °C ±0.05 °C | ±0.33 ppm | -0.029 ppm |
| 9999.97447 Ω | +20 °C ±0.05 °C | ±0.33 ppm | -0.023 ppm |
| 9999.97453 Ω | +21 °C ±0.05 °C | ±0.33 ppm | -0.016 ppm |
| 9999.97461 Ω | +22 °C ±0.05 °C | ±0.33 ppm | -0.008 ppm |
| 9999.97470 Ω | +23 °C ±0.05 °C | ±0.33 ppm | Reference |
| 9999.97479 Ω | +24 °C ±0.05 °C | ±0.33 ppm | +0.009 ppm |
| 9999.97489 Ω | +25 °C ±0.05 °C | ±0.33 ppm | +0.019 ppm |
| 9999.97500 Ω | +26 °C ±0.05 °C | ±0.33 ppm | +0.030 ppm |
| 9999.97512 Ω | +27 °C ±0.05 °C | ±0.33 ppm | +0.042 ppm |
| 9999.97525 Ω | +28 °C ±0.05 °C | ±0.33 ppm | +0.055 ppm |
Table 3: 28 November 2017 data of 10 KΩ measurement for temperature coefficient evaluation
Once test is complete, switch SL935 output resistance to 1 Ω, reconfigure measurement equipment and perform measurement for 1 Ω value as in STEP 5-7. As the result there should be at least 10 points available with measured resistance:
| Resistance value | Airbath Temperature | Measurement Uncertainty | Total resistance deviation from +23.00 °C |
|---|---|---|---|
| 1.00005896 Ω | +18 °C ±0.05 °C | ±0.17 ppm | -0.062 ppm |
| 1.00005897 Ω | +19 °C ±0.05 °C | ±0.17 ppm | -0.048 ppm |
| 1.00005898 Ω | +20 °C ±0.05 °C | ±0.17 ppm | -0.036 ppm |
| 1.00005900 Ω | +21 °C ±0.05 °C | ±0.17 ppm | -0.023 ppm |
| 1.00005901 Ω | +22 °C ±0.05 °C | ±0.17 ppm | -0.011 ppm |
| 1.00005902 Ω | +23 °C ±0.05 °C | ±0.17 ppm | Reference |
| 1.00005903 Ω | +24 °C ±0.05 °C | ±0.17 ppm | +0.011 ppm |
| 1.00005904 Ω | +25 °C ±0.05 °C | ±0.17 ppm | +0.021 ppm |
| 1.00005905 Ω | +26 °C ±0.05 °C | ±0.17 ppm | +0.031 ppm |
| 1.00005906 Ω | +27 °C ±0.05 °C | ±0.17 ppm | +0.041 ppm |
| 1.00005907 Ω | +28 °C ±0.05 °C | ±0.17 ppm | +0.050 ppm |
Table 4: Example of 1 Ω measurement range for temperature coefficient evaluation
Formula defined from the calibration is same as in case with 10 KΩ, this time using 100 mADC test current:
RTEMP = R[TREF] × (1 + α × (TEMP – TREF) + β × (TEMP – TREF)2 ),
Where for 1 Ω values are:
α = 0.01117E-6 Ω/°C,
β = 0.00023E-6 Ω/°C2,
R[TREF] = 1.00005902 Ω and TREF = +23.00 °C.
Once measurement is complete, disconnect test equipment and connect Fluke SL935 DUT to AC mains to maintain oven operation and battery charge.
Live temperature corrected standard resistance calculator
The temperature correction alpha/beta values are now known, so we can calculate true resistance value for both 10 KΩ and 1 Ω outputs, with little calculator help. This is handy to account for variation in ambient temperature. We added interactive real-time calculator for this article to aid with the calculation. Just fill in blue boxes, if your resistor have different alpha/beta values and enjoy the calculated value of expected resistances in red.
RSTD = 10000 Ω + (( (α × ΔTEMP) + (β × ΔTEMP2) + RSTD_DEV) × 10000 Ω / 1-6) Ω
Formula for 1 Ω is essentially same:
RSTD = 1 Ω + (( (α × ΔTEMP) + (β × ΔTEMP2) + RSTD_DEV) × 1 Ω / 1-6) Ω
Here’s realtime calculator that accept resistor parameters from PI certificate:
|
Alpha α +23 °C ppm/°C Beta β +23 °C ppm/(°C)2 RSTD deviation +23 °C ppm Temperature to recalculate at °C | CalCert |
|
Alpha α +23 °C ppm/°C Beta β +23 °C ppm/(°C)2 RSTD deviation +23 °C ppm Temperature to recalculate at °C | |
This resistance value may be used as given at +23°C, if the change in resistance for the temperature range to be encountered is acceptable. For example, temperature variations less than ±2 °C from a nominal +23 °C would result in a worst case resistance deviation less than -0.3 ppm. If this is an acceptable, then no temperature correction is required.
Here is also python application to calculate resistance relations if you prefer to play with numbers more.
import sys

# Constants from resistor calibration
ALPHA    = -0.03  # Alpha value at +23c
BETA     = -0.028 # Beta value
R_DEV    = 0.0    # Deviation value for standard resistor
TEMP_DEV = 0.004  # Deviation value for RT
STEP     = 0.5    # Step to go thru temperature points in mode 2
#count = 0

def show_r(temp, rsi):
    f = 0
    delta = temp - 23.0
    ppm = 0.0 + (ALPHA * delta) + (BETA * delta * delta)
    r = 10000.0 + ((ppm+R_DEV) * 10000.0 / 1000000.0)
    f = (temp * 9.0 / 5.0) + 32.0
    print ("temp = %5.2fC / %5.2fF Rstd = %12.5f Ohms, %3.3f ppm\n" % (temp,f, r, R_DEV+ppm ) ),
    return r

print "-- xDevs.com/EEVBlog RComp | ESI SR104 correction calculator -- \n-- https://xdevs.com/review/sr104/  Rev.1 Apr 2018           --"
print "R deviation = %.4f ppm    T deviation = %.4f%%\n" % (R_DEV, TEMP_DEV),
print "Alpha = %.4f ppm/C       Beta = %.4f ppm/C/C\n" % (ALPHA, BETA)

mode = int(raw_input("Enter 1 to calculate Rstd at Rrtd or Enter 2 for table curve generate"))
if (mode == 1):
    rt = float(raw_input("Room Temp: "))
    rs = float(raw_input("Standard resistance: "))
    rs = 10000.0 + (R_DEV * 10000.0 / 1000000.0)
    print "Rt=%f  Rs=%f\n" % (rt, rs)
    r = (rt - rs) * 100.0 / 10000.0
    r = r - TEMP_DEV
    r = r * 10.0
    temp = r + 23.0
    show_r(temp, 10000)
elif (mode == 2):
    count = int(10 / STEP);
    for ix in range (0,count+1):
        temp = float(18 + ix * STEP)
        show_r(temp, 10000)
Example prinout of python program shown below:
# python ./sr104.py
-- xDevs.com/EEVBlog RComp | ESI SR104 correction calculator --
-- https://xdevs.com/review/sr104/  Rev.1 Apr 2018           --
R deviation = 0.0000 ppm    T deviation = 0.0040%
Alpha = -0.0300 ppm/C       Beta = -0.0280 ppm/C/C

Enter 1 to calculate Rstd at Rrtd or Enter 2 for table curve generate2
temp = 18.00C / 64.40F Rstd =   9999.99450 Ohms, -0.550 ppm
temp = 18.50C / 65.30F Rstd =   9999.99568 Ohms, -0.432 ppm
temp = 19.00C / 66.20F Rstd =   9999.99672 Ohms, -0.328 ppm
temp = 19.50C / 67.10F Rstd =   9999.99762 Ohms, -0.238 ppm
temp = 20.00C / 68.00F Rstd =   9999.99838 Ohms, -0.162 ppm
temp = 20.50C / 68.90F Rstd =   9999.99900 Ohms, -0.100 ppm
temp = 21.00C / 69.80F Rstd =   9999.99948 Ohms, -0.052 ppm
temp = 21.50C / 70.70F Rstd =   9999.99982 Ohms, -0.018 ppm
temp = 22.00C / 71.60F Rstd =  10000.00002 Ohms, 0.002 ppm
temp = 22.50C / 72.50F Rstd =  10000.00008 Ohms, 0.008 ppm
temp = 23.00C / 73.40F Rstd =  10000.00000 Ohms, 0.000 ppm
temp = 23.50C / 74.30F Rstd =   9999.99978 Ohms, -0.022 ppm
temp = 24.00C / 75.20F Rstd =   9999.99942 Ohms, -0.058 ppm
temp = 24.50C / 76.10F Rstd =   9999.99892 Ohms, -0.108 ppm
temp = 25.00C / 77.00F Rstd =   9999.99828 Ohms, -0.172 ppm
temp = 25.50C / 77.90F Rstd =   9999.99750 Ohms, -0.250 ppm
temp = 26.00C / 78.80F Rstd =   9999.99658 Ohms, -0.342 ppm
temp = 26.50C / 79.70F Rstd =   9999.99552 Ohms, -0.448 ppm
temp = 27.00C / 80.60F Rstd =   9999.99432 Ohms, -0.568 ppm
temp = 27.50C / 81.50F Rstd =   9999.99298 Ohms, -0.702 ppm
temp = 28.00C / 82.40F Rstd =   9999.99150 Ohms, -0.850 ppm
Be sure to update constants ALPHA, BETA, R_DEV, TEMP_DEV to match your SR104 standard lid information before use.
I have compiled few known ESI SR104 and our ovenized Fluke SL935 temperature stability data together into pretty Excel chart:
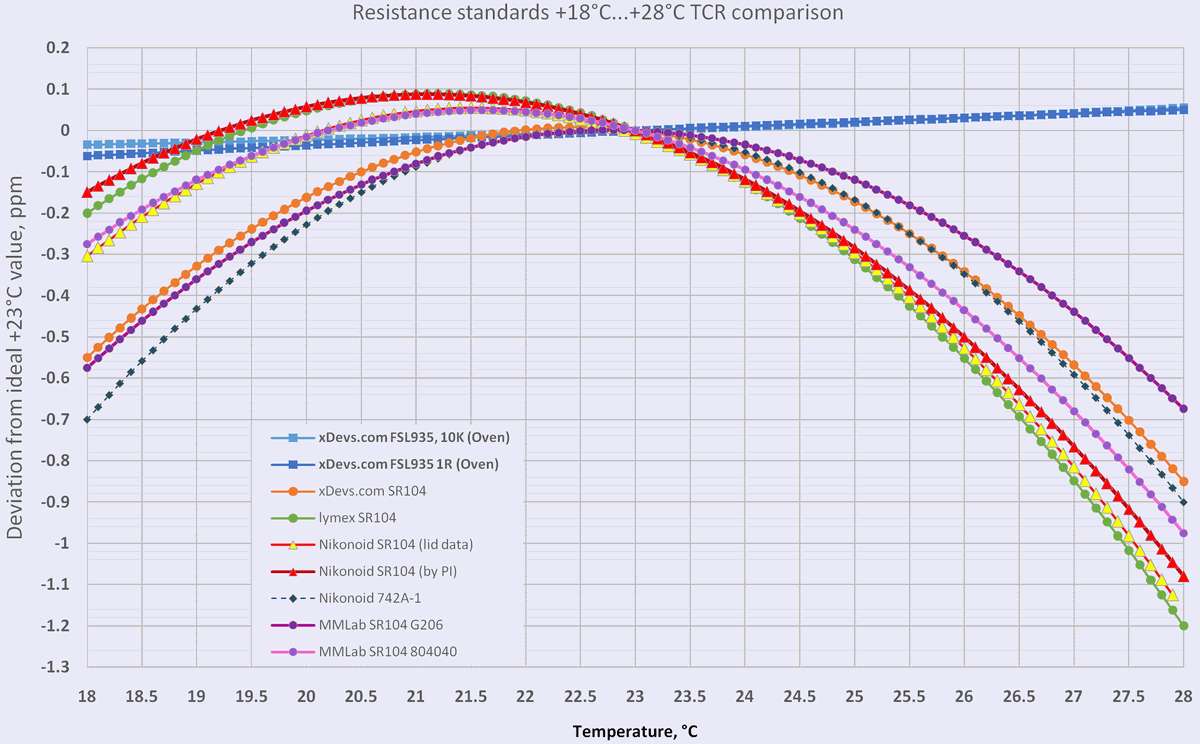
Image 29: ESI SR104 versus ovenized FSL935 in temperature coefficient from +18°C to +28°C. Click for Excel file.
Calibration reports
First calibration was performed by Process Insturments in USA, 28 November 2017.
Fluke SL935 1 Ω and 10 KΩ calibration report, 28 November 2017
Fluke SL935 1 Ω and 10 KΩ calibration report, 31 May 2018
Fluke SL935 1 Ω and 10 KΩ calibration report by Taiwan NML, 12 August 2019
Fluke SL935 1 Ω and 10 KΩ calibration report by Measurements International, 26 March 2023
During PI calibrations in USA standard was shipped to the calibration lab fully charged, with battery life minimum 120 hours. That was enough time for SL935 to receive calibration in “hot” state, without any temperature interruptions. Shipping back from PI was 2-day service, which took just 52 hours from pickup to delivery.
For calibration against Taiwan National Standards by ITRI CMS our Fluke SL935 was handcarried in Pelican 1535 Air protection case, with transport time less than 1 hour.
Our own internal calibration measurement data results, Year 2018
As bonus, we can perform some math acrobatics, to attempt our own meters accuracy, using previously captured data.
Here are my own measurements which I did at home, prior to sending SL935 for calibration + ManateeMafia’s meter:
HP 3458A, meter 2 over 10 KΩ, direct 4-wire, OCOMP ON, DELAY 3, NPLC100 = 9999.971 Ω, +26 °C ambient, 18 May 2017. Error from PI value : -0.37 ppm
HP 3458A, meter 1 over 10 KΩ, direct 4-wire, OCOMP ON, DELAY 3, NPLC100 = 9999.985 Ω, +25 °C ambient, 20 May 2017. Error from PI value : +1.03 ppm
HP 3458A, meter 2 over 10 KΩ, direct 4-wire, OCOMP ON, DELAY 3, NPLC100 = 9999.965 Ω, +24.5 °C ambient, 25 Sept – 28 Sept 2017. Error from PI value : -0.97 ppm
Meter 1 calibrated by using Vishay VHP103 resistor at 10 KΩ as transfer standard, which are in turn measured against 90-hour fresh cal’d ESI SR104 (by PI too) in August 2016. Meter is 24/7 powered. Meter 2 calibrated directly vs same ESI SR104 back in January 2017, shipped to me in Feb and in 24/7 powered use since then.
HP 3458A, ManateeMafia’s meter over 10 KΩ, direct 4 wire, OCOMP ON, DELAY 3, NPLC100 = 9999.966 Ω, +26 °C ambient, 3 Nov – 7 Nov 2017. Error from PI value : -0.87 ppm
Based on this brief data, with adding uncertainties and error factors, I’d have pretty good confidence stating that such transfer path can provide <4 ppm absolute resistance accuracy at 10 KΩ range.
Noise + short-temp variations are usually under ± 1.5 ppm.
Now similar data for 1 Ω.
HP 3458A, meter 1 over 1 Ω, direct 4-wire, OCOMP ON, DELAY 3, NPLC100 = 1.00006111 Ω, +22 °C ambient, 5 May – 25 May 2017. Error from PI value : +2.1 ppm , noise about 30 ppm.
HP 3458A, meter 2 + TE 9823 calibrator sourcing +100mA and -100mA over 1 Ω, direct 4-wire, NPLC 100 = 1.00006657 Ω, +23.5 °C ambient, 13 October 2017. Error from PI value : +7.5 ppm, noise around 2 ppm
HP 3458A, meter 2 + TE 9823 calibrator sourcing +20mA and -20mA over 1 Ω, direct 4-wire, NPLC100 = 1.00006574 Ω, +21 °C ambient, 21 Sept – 22 Sept 2017. Error from PI value : +6.7 ppm , noise around 2 ppm
HP 3458A, ManateeMafia’s meter over 1 Ω, direct 4 wire, OCOMP ON, DELAY 0, NPLC100 = 1.00005831 Ω, +24 °C ambient, 31 Sept – 3 Nov 2017. Error from PI value : -0.7 ppm
SL935 received after two traceable calibrations
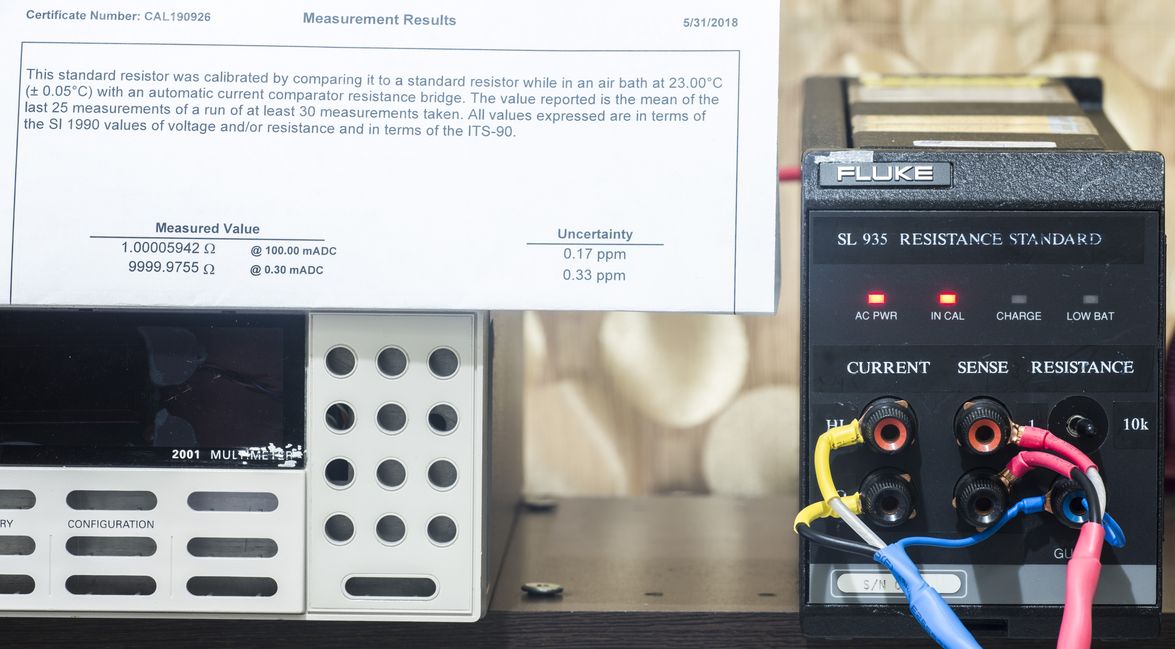
Image 30: Fluke SL935 sitting in lab, as received from Process Instruments calibrations
This unique resistance standard will be used in xDevs.com projects and lab comparisons and future HP/Agilent/Keysight 3458A DMM and Fluke 5700A calibrator performance maintenance.
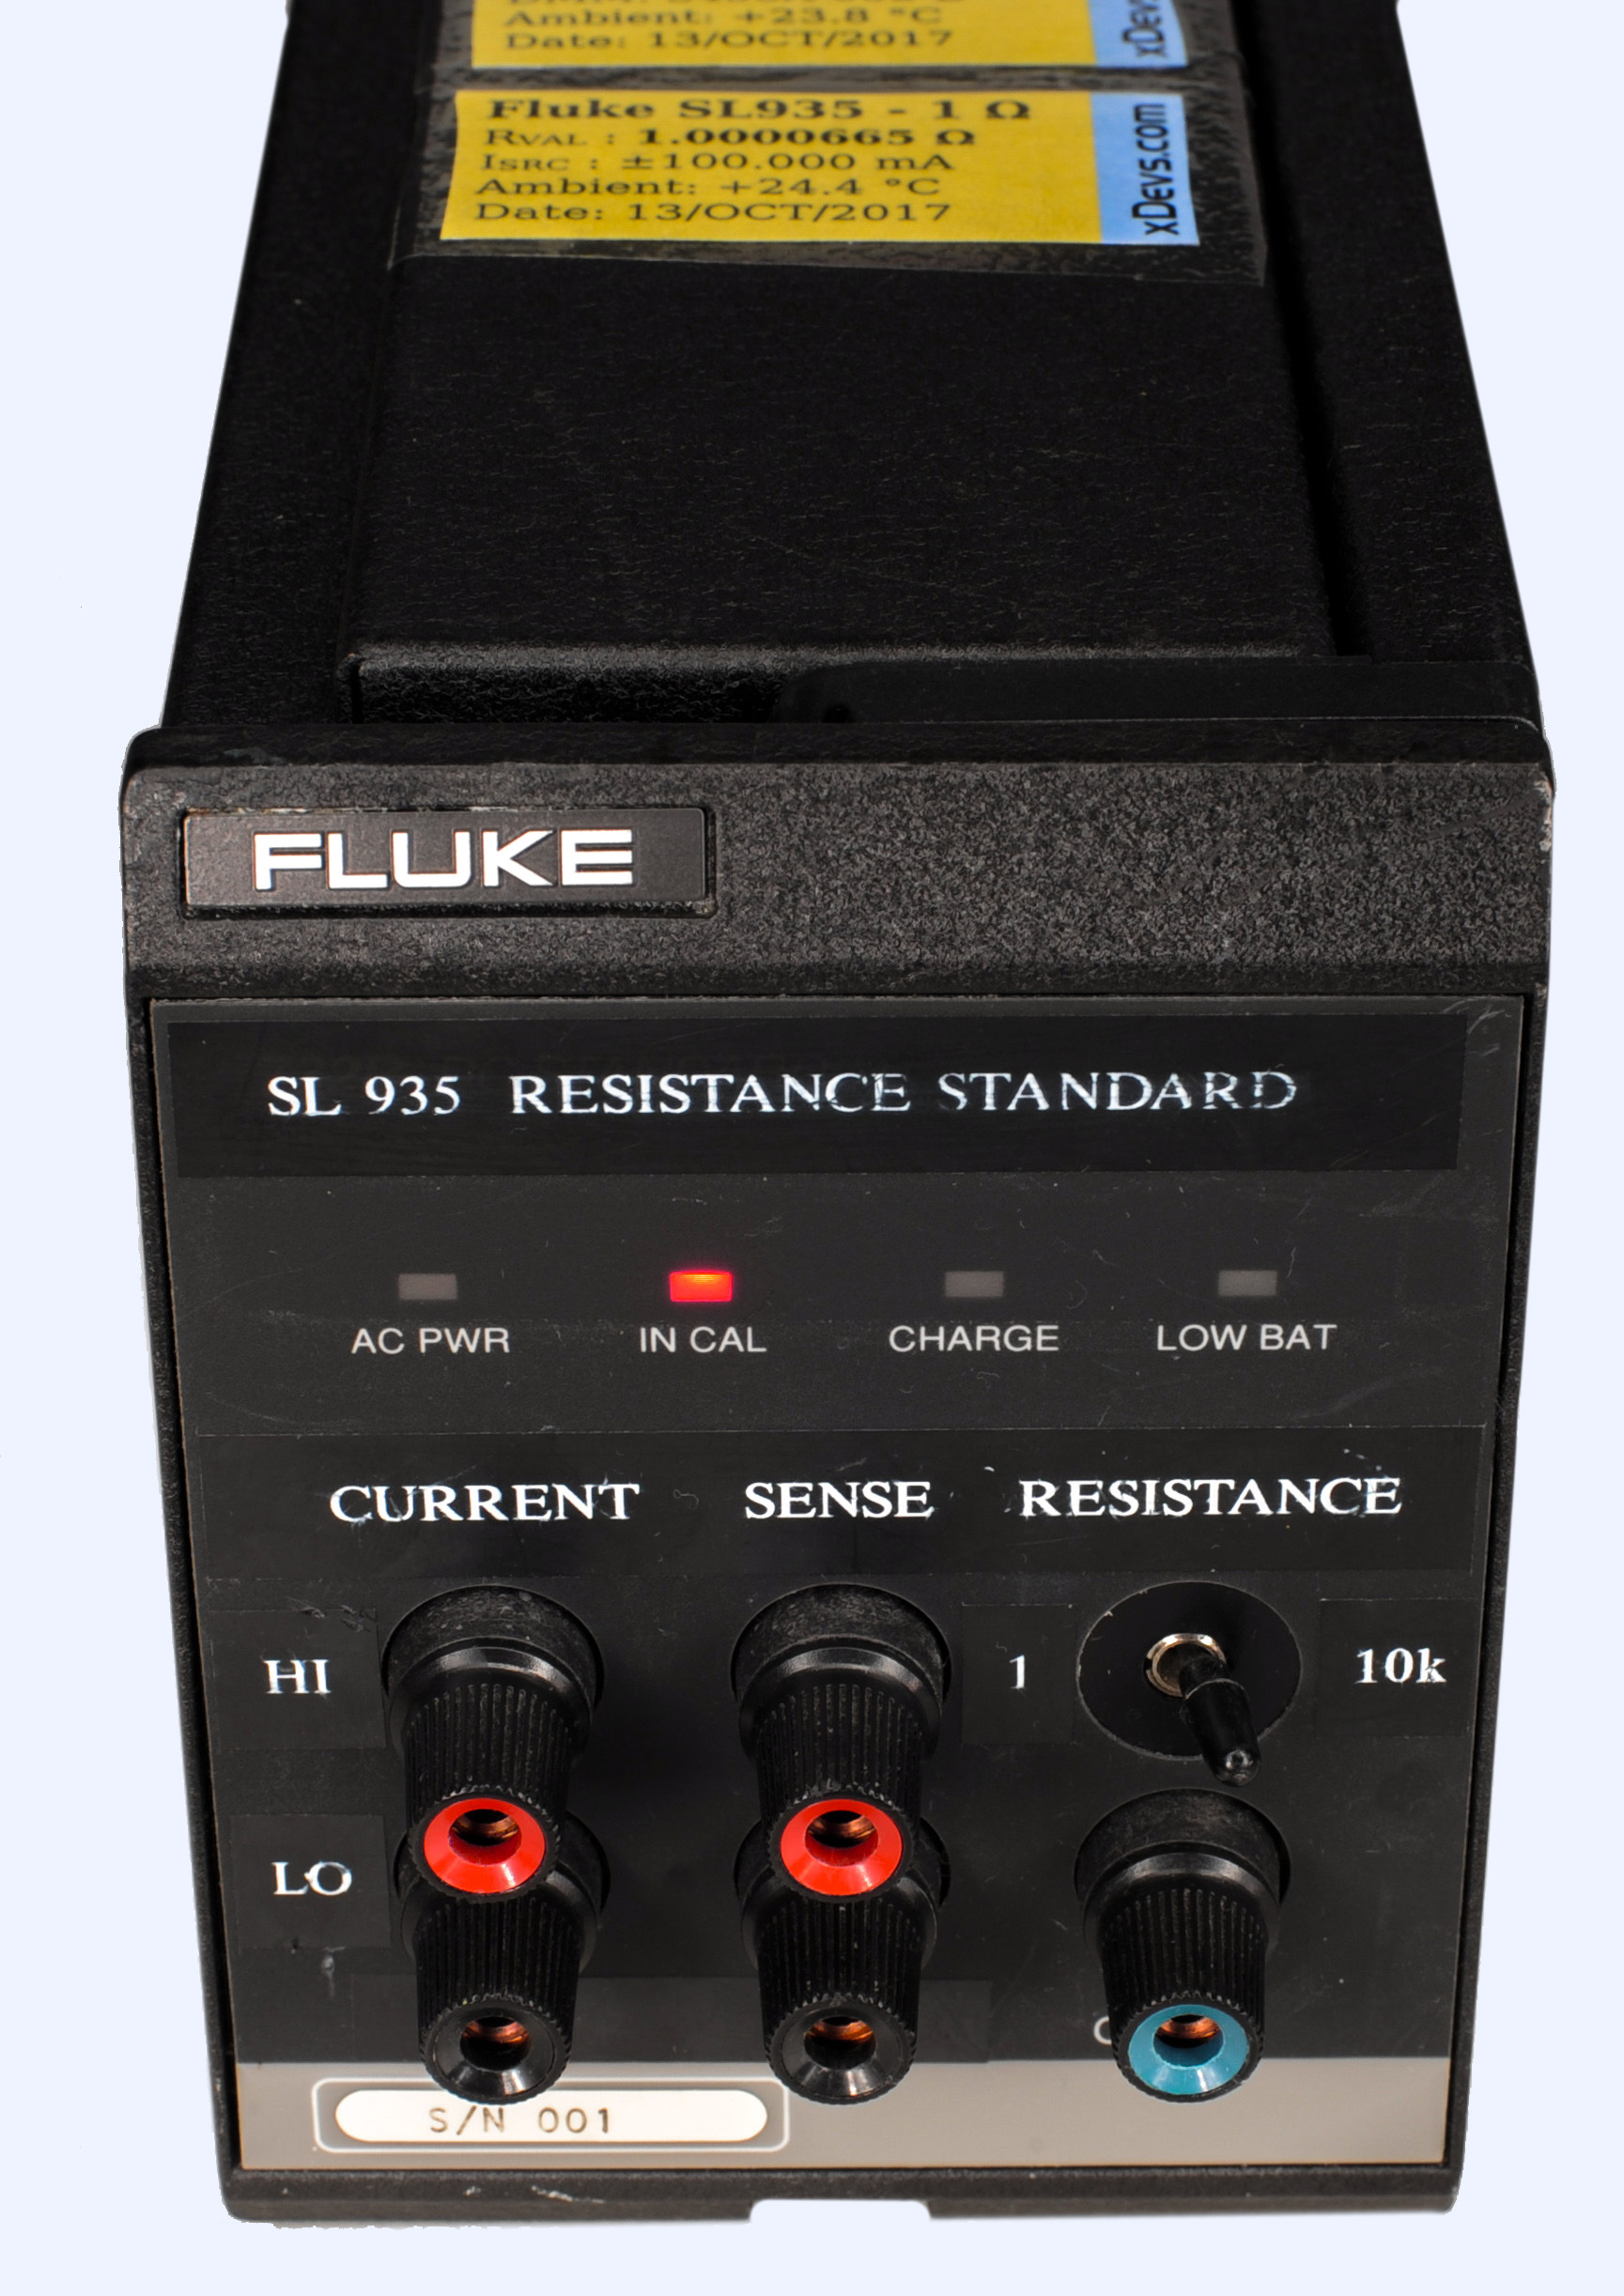
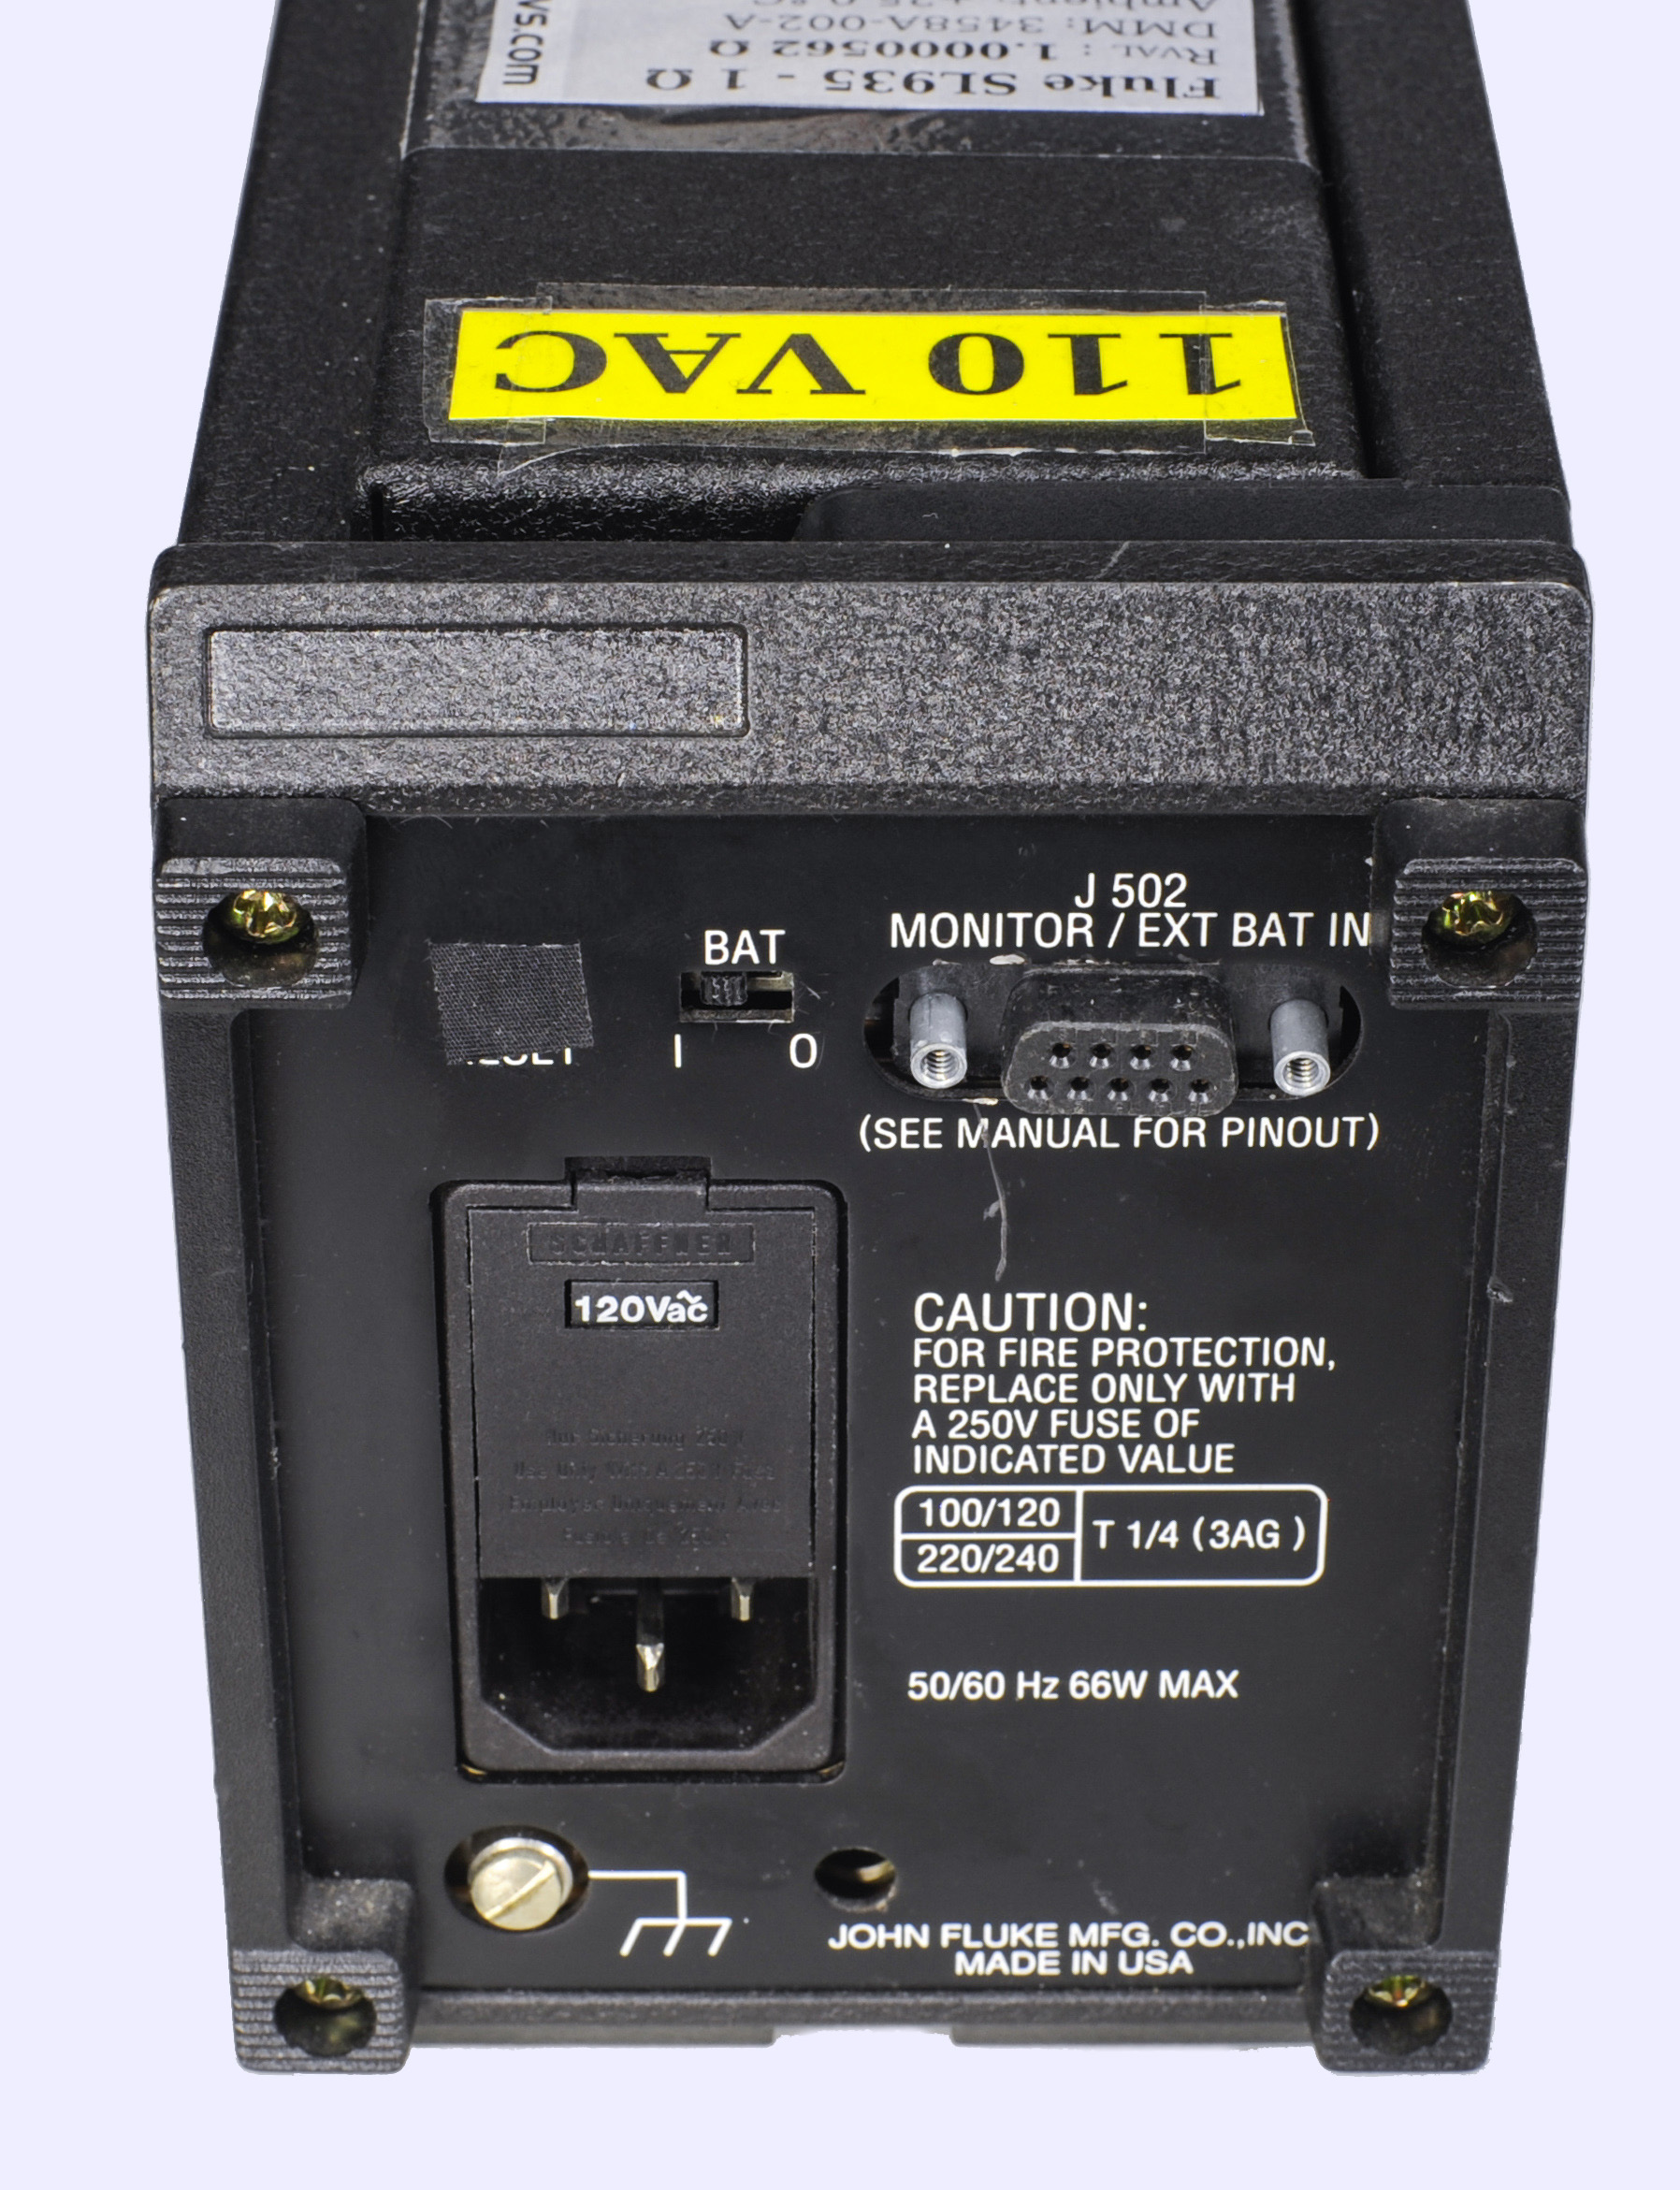
Image 31-32: Fluke SL935 front and rear side after restoration
Now it’s ready to be used in lab.
Long term drift across last 8+ years, performance summary & conclusion
Here I will keep own record for calibration history since the standard acquisition in 2 May 2017. Preliminary results with Keysight 3458A DMM:
| Date | 10 KΩ | 1 Ω | 10K,ppm Δ | 1Ω,ppm Δ | Instrument | 10 KΩ Δ/day 0, ppm | 1 Ω Δ/day 0, ppm | Ambient, °C | Thermistor |
|---|---|---|---|---|---|---|---|---|---|
| 30 April 2017 w/o oven | 9999.988 A | 1.0000575 A | 0 | 0 | 3458A-1 | 0 | +25.6 | DNT | |
| 1 May 2017 w/o oven | 9999.995 A | +0.70 (reference) | 3458A-1 | 0 (reference) | +23.6 | DNT | |||
| 2 May 2017 w/o oven | 9999.985 C | 1.0000605 C | -1.00 | 0 (reference) | 3458A-1 | 0 | 0 (reference) | +26.2 | DNT |
| 7 May 2017 assembled | 9999.9938 | +0.88 | 3458A-1 | +0.12 | +22.8 | 65.02 kΩ | |||
| 8 May 2017 assembled | 9999.9954 | +0.16 | 3458A-1 | +0.04 | +23.3 | 65.xx kΩ | |||
| 9 May 2017 assembled | 1.0000594 | -0.7 (noise) | 3458A-1 | -1.1 | +23.6 | 65.xx kΩ | |||
| 10 May 2017 assembled | 1.0000595 | +0.1 (noise) | 3458A-1 | -1.0 | +22.8 | 65.xx kΩ | |||
| 11 May 2017 assembled | 1.0000601 | +0.6 (noise) | 3458A-1 | -0.4 | +22.0 | 65.xx kΩ |
Table 5. Initial measurement data results
| Date | 10 KΩ | 1 Ω | 10K,ppm Δ | 1Ω,ppm Δ | Instrument | 10 KΩ Δ/day 0, ppm | 1 Ω Δ/day 0, ppm | Ambient, °C | Thermistor |
|---|---|---|---|---|---|---|---|---|---|
| 13 Oct 2017 | 9999.9594 | 3458A-2 | +23.6 | ||||||
| 13 Oct 2017 100mA ISRC | 1.0000665 | 3458A-2/9823 | +24.6 | 64.72 kΩ |
Table 6. Pre-calibration measurement data results
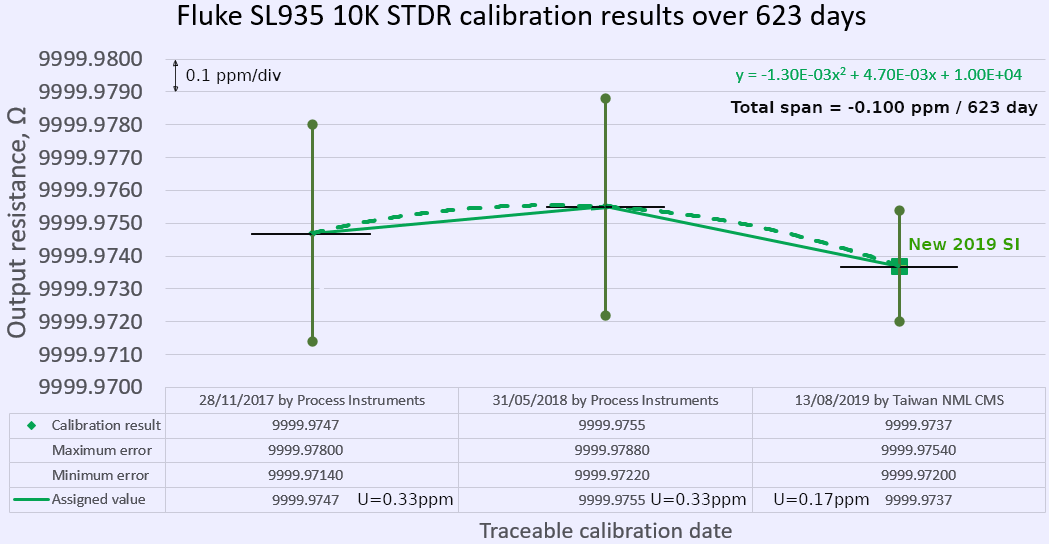
Actual in-service calibrations with traceable links via accredited reference resistance standards, such as ESI SR104, with a link to Quantum Hall Effect system from ITRI CMS calibration in 2019. Table 7 shows results for 10000 Ω with long term drift estimate.
| Date | 10 KΩ at 0.1-1mA | 10K,ppm Δ | Instrument | 10 KΩ Δ/day 0, ppm | Ambient, °C |
|---|---|---|---|---|---|
| 28 Nov 2017 0.3mA PI | 9999.9747 ±0.33 ppm | Reference | MI 6010B + L&N 4210 | Reference | +23.00 ±0.05 |
| 31 May 2018 0.3mA PI | 9999.9755 ±0.33 ppm | +0.08 ppm | MI 6010B + L&N 4210 | +0.000437 ppm/day | +23.00 ±0.05 |
| 10 Jan 2019 predicted | 9999.9764 | +0.17 ppm | Prediction | +0.000437 ppm/day | +23.00 ±0.05 |
| 13 August 2019 ITRI CMS NML 0.1 mA | 9999.9739 | -0.08 ppm | MI 6010D, TW Oilbath STDR | Same | +23.00 ±1.5 |
| 13 August 2019 ITRI CMS NML 0.3 mA | 9999.9737 ±0.17 ppm | -0.10 ppm | MI 6010D, TW Oilbath STDR | Same | +23.00 ±1.5 |
| 15 October 2020 xDevs | 9999.9741 ±0.4 ppm | -0.06 ppm | Datron 1281 ratio mode | Same | +23.0 ±2 |
| 9 September 2021 xDevs | 9999.9757 ±0.3 ppm | +0.23 ppm | Guildline 6675A 1:1 ratio mode from SR104N2 | Same | +23.0 ±2 |
| 30 April 2022 xDevs, 0.5 mA | 9999.9753 ±0.25 ppm | +0.06 ppm | Measurements International 6000A 1:1 ratio mode from SR104 | +23.0 ±2 | |
| 6 March 2023 xDevs, 0.316 mA | 9999.9763 ±0.3 ppm | +0.16 ppm | Measurements International 6010B 1:10 ratio mode from RWS103 | +23.0 ±2 | |
| 26 March 2023 MI, 0.316 mA | 9999.9762 ±0.05 ppm | +0.16 ppm | Measurements International 6010 from MI Ohm reference | +23.0 ±0.05 | |
| 13 January 2024 xDevs, 0.5 mA | 9999.9759 ±0.15 ppm | +0.12 ppm | Measurements International 6000 from ESI SR104 | +23.0 ±0.2 | |
| 8 March 2024 xDevs, 0.5 mA | 9999.97617 ±0.15 ppm | +0.147 ppm | Measurements International 6000 from ESI SR104 | +23.0 ±0.2 | |
| 18 May 2024 xDevs, 0.316 mA | 9999.97642 ±0.2 ppm | +0.172 ppm | Measurements International 6000 from ESI SR104 | +23.0 ±0.2 | |
| 2 Aug 2024 xDevs, 0.316 mA | 9999.9775 ±0.2 ppm | +0.28 ppm | Measurements International 6000 from ESI SR104 | +23.0 ±0.2 | |
| 31 March 2025 xDevs, 0.316 mA | 9999.9766 ±0.3 ppm | +0.19 ppm | Measurements International 6000 from ESI SR104 | +23.0 ±0.1 | |
| 12 October 2025 xDevs, 0.316 mA | 9999.97935 ±0.1 ppm | +0.465 ppm | Measurements International DCC from SR104 | +23.0 ±0.05 | |
| 21 January 2026 xDevs, 0.1 mA | 9999.97906 ±0.1 ppm | +0.436 ppm | Measurements International DCC bridge transfers | +23.0 ±0.05 | |
| 4 June 2026 xDevs, 0.316 mA | 9999.97925 ±0.15 ppm | +0.455 ppm | Measurements International 6000 from SR104 | +24.6 ±0.05 |
Table 7. Calibration data summary and predictions for 10000 Ω element
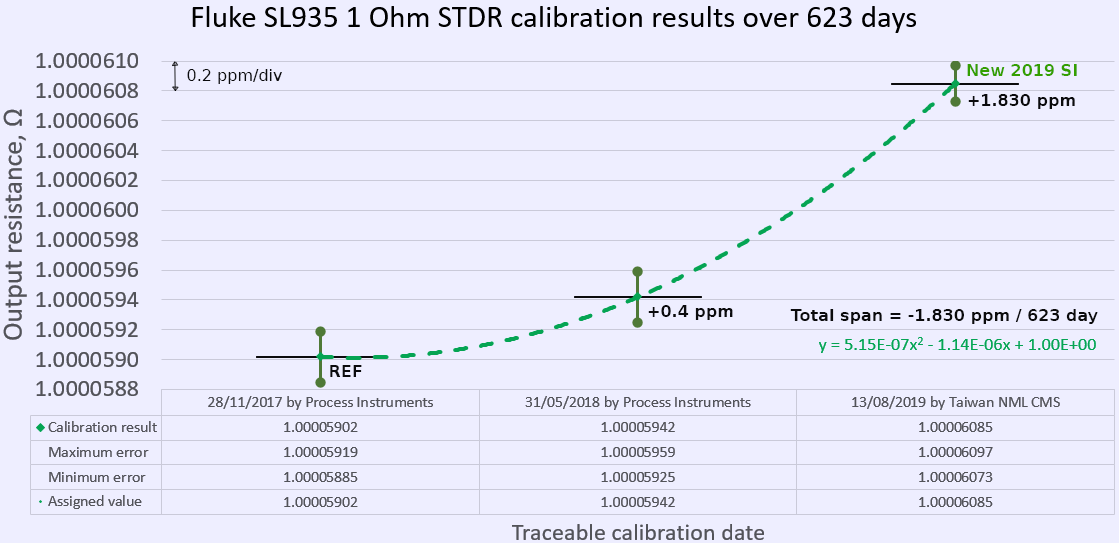
Table 8 shows results for 1 Ω with long term drift estimate. Calibrations usually done at the same time frame period as 10 kΩ, since both standards are available in same instrument.
| Date | 1 Ω at 100 mA | 1 Ω ,ppm Δ | Instrument | 1 Ω Δ/day 0, ppm | Ambient, °C |
|---|---|---|---|---|---|
| 28 Nov 2017 100mA PI | 1.00005902 ±0.17 ppm | Reference | MI 6010B + L&N 4210 | Reference | +23.00 ±0.05 |
| 31 May 2018 100mA PI | 1.00005942 ±0.17 ppm | +0.4 ppm | MI 6010B + L&N 4210 | +0.00218 ppm/day | +23.00 ±0.05 |
| 10 Jan 2019 predicted | 1.00005991 | +0.89 ppm | Prediction | Same | +23.00 ±0.05 |
| 4 August 2019 predicted | 1.00006036 | +1.34 ppm | Prediction | Same | +23.00 ±0.05 |
| 13 August 2019 ITRI CMS NML | 1.00006085 ±0.17 ppm | +1.83 ppm | MI 6010D, TW Oilbath STDR | Same | +23.00 ±1.5 |
| 12 December 2020 xDevs | 1.00006192 ±0.5 ppm | +2.90 ppm | F5720A/H1 + KS34420A DeltaN mode | Same | +23.0 ±2 |
| 18 September 2021, xDevs/NL | 1.00006174 Ω ±0.6 ppm | Guildline 6675A + 742A-1 1.00004374 Ω | +23.00 ±1 | ||
| 12 May 2022, xDevs | 1.00006256 Ω ±0.4 ppm | MIL 6010B + Ohm Labs 200 0.9999985 Ω ±0.3 ppm | +23.00 ±1 | ||
| 12 March 2023, xDevs | 1.00006374 Ω ±0.6 ppm | MIL 6010B + transfer chain from ESI SR104 | +23.00 ±1 °C | ||
| 26 March 2023 MI, 100 mA | 1.00006380 ±0.05 ppm | +0.16 ppm | Measurements International 6010 from MI Ohm reference | +23.0 ±0.05 °C | |
| 30 March 2024, prediction | 1.00006463 ±0.3 ppm | prediction | +23.0 ±1 °C | ||
| 4 August 2024, xDevs | 1.00006384 Ω ±0.5 ppm | MIL 6010B + transfer chain from ESI SR104 | +23.00 ±0.5 °C | ||
| 8 March 2025, xDevs | 1.00006495 Ω ±0.6 ppm | MIL 6010B + transfer chain from ESI SR104 | +23.00 ±0.5 °C | ||
| 4 January 2026, xDevs, 50 mA | 1.00006516 Ω ±0.4 ppm | MIL 6010B + transfer chain from ESI SR104 | +23.00 ±0.5 °C | ||
| 21 January 2026, xDevs, 50 mA | 1.00006537 Ω ±0.3 ppm | DCC transfer chain from FSL935-10k | +23.00 ±0.5 °C |
Table 8. Calibration data summary and predictions for 1 Ω element
All this data and intermediate transfers with calculated uncertainty budgets allow to estimate long term drift of resistance standard with decent confidence. Summary of such calculations and analysis on this Fluke SL935 unit over a duration of 3077 days (8.4 years!) are presented below in detail.
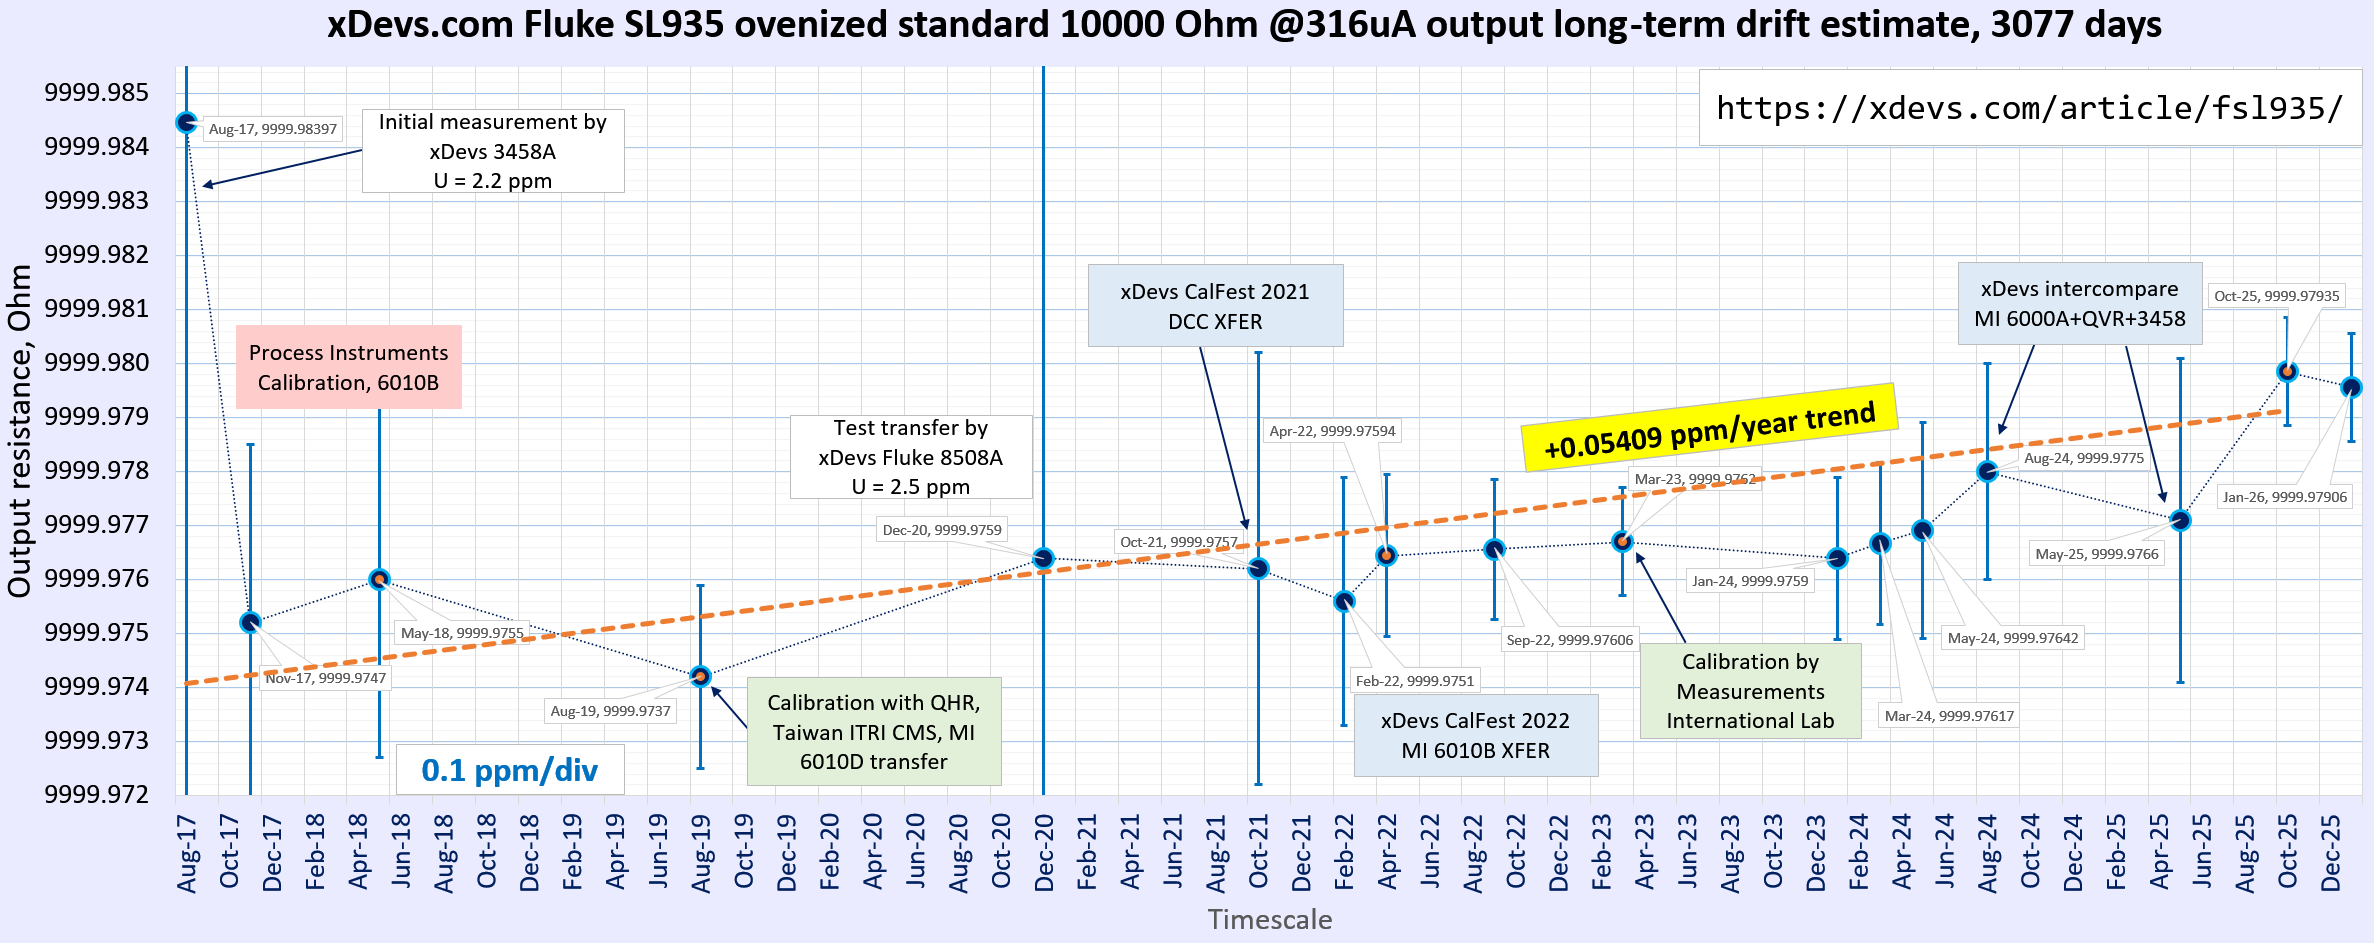
Image 33: Fluke SL935 long term drift calculation, 10000 Ω output
Long term drift estimate of 10000 Ω output is very impressive +0.054 ppm/year and already presents a challenge for accurate estimation, requiring very good uncertainty points. This drift trend was calculated using key accredited calibration points in 2019 from Taiwan’s NMI Lab, 2022 from Measurements International and other laboratory calibrations. Our own measurements with in-house bridges also fall well around the trend line providing additional confidence in quality of such prediction.
Our primary ESI SR104 is only marginally better for long-term drift but unlike SL935 does not have thermal stabilization feature. Annual stability of SL935 will be further evaluated in coming years using both BVD and DCC bridge systems from Measurements International as well as bi-annual external calibrations with external labs.
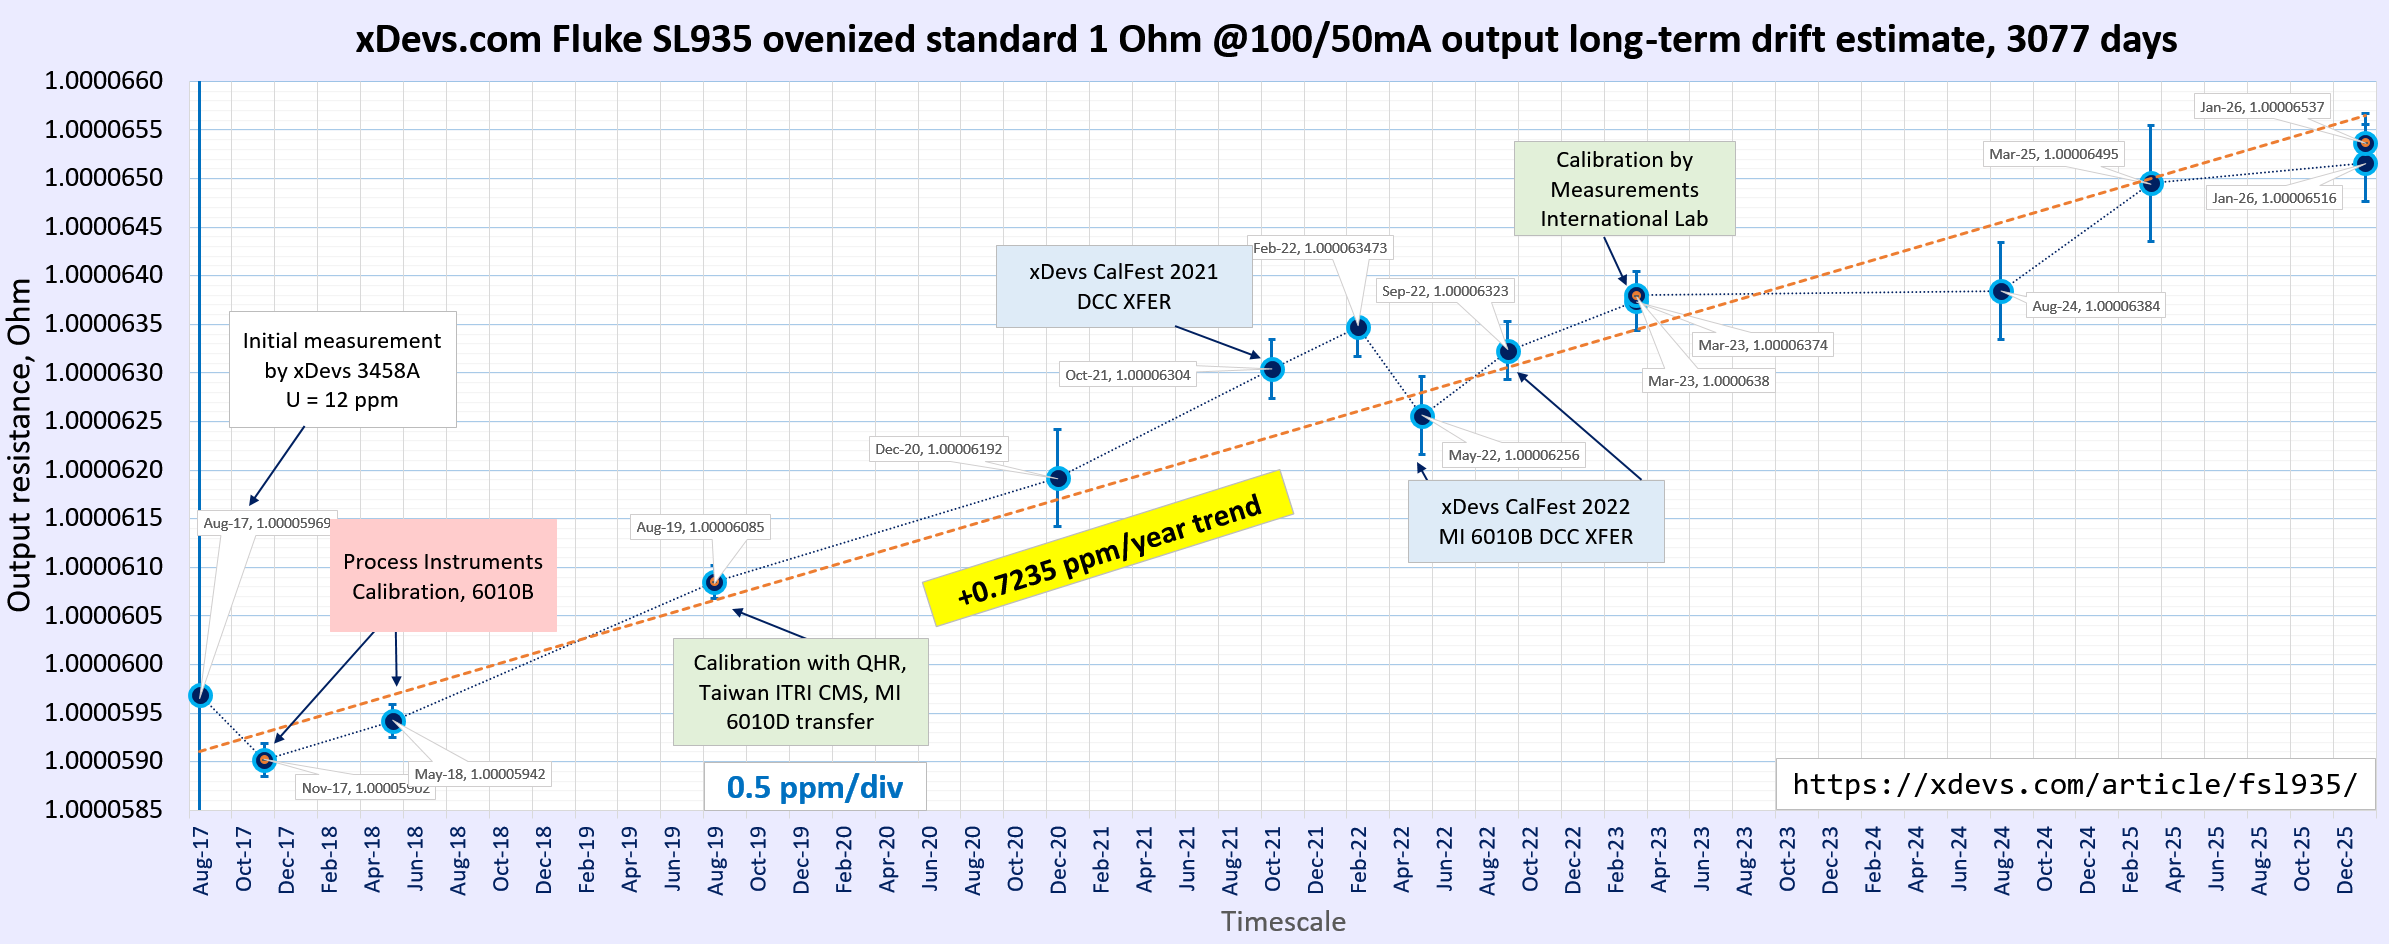
Image 34: Fluke SL935 long term drift calculation, 1 Ω output
Drift estimate of SL935’s 1 Ω output is not as impressive at +0.7235 ppm/year level but still well better than specifications of other commercial standards, such as our backup Fluke 742A-1. Same as with 10000 Ω data I’ve used same temporal reference points to provide with this trend estimate. This larger drift is significant enough that using trend prediction and in-house checks against 10 kΩ reference is needed to perform good confidence sub-ppm transfers at 1 Ω level. Verification could be further provided via chain of accurate transfers by using intermediate 10, 100 and 1000 Ω transfer standards using much more stable reference 10000 Ω such as ESI SR104.
To conclude the results, performance and level of this resistance standard, project total cost and efforts spent are reasonable investment in improving xDevs resistance capabilities. Even single Fluke 742A-10k resistance standard on secondary market usually have higher cost than this core, let alone brand new 742A from Fluke Calibration. Only time and periodic measurements would tell how stable is this SL935 resistance box, and even then stability measurement would be questionable due to measurement instrument own long-term stability and drift. Next external calibration for SL935 is slated for autumn 2026.
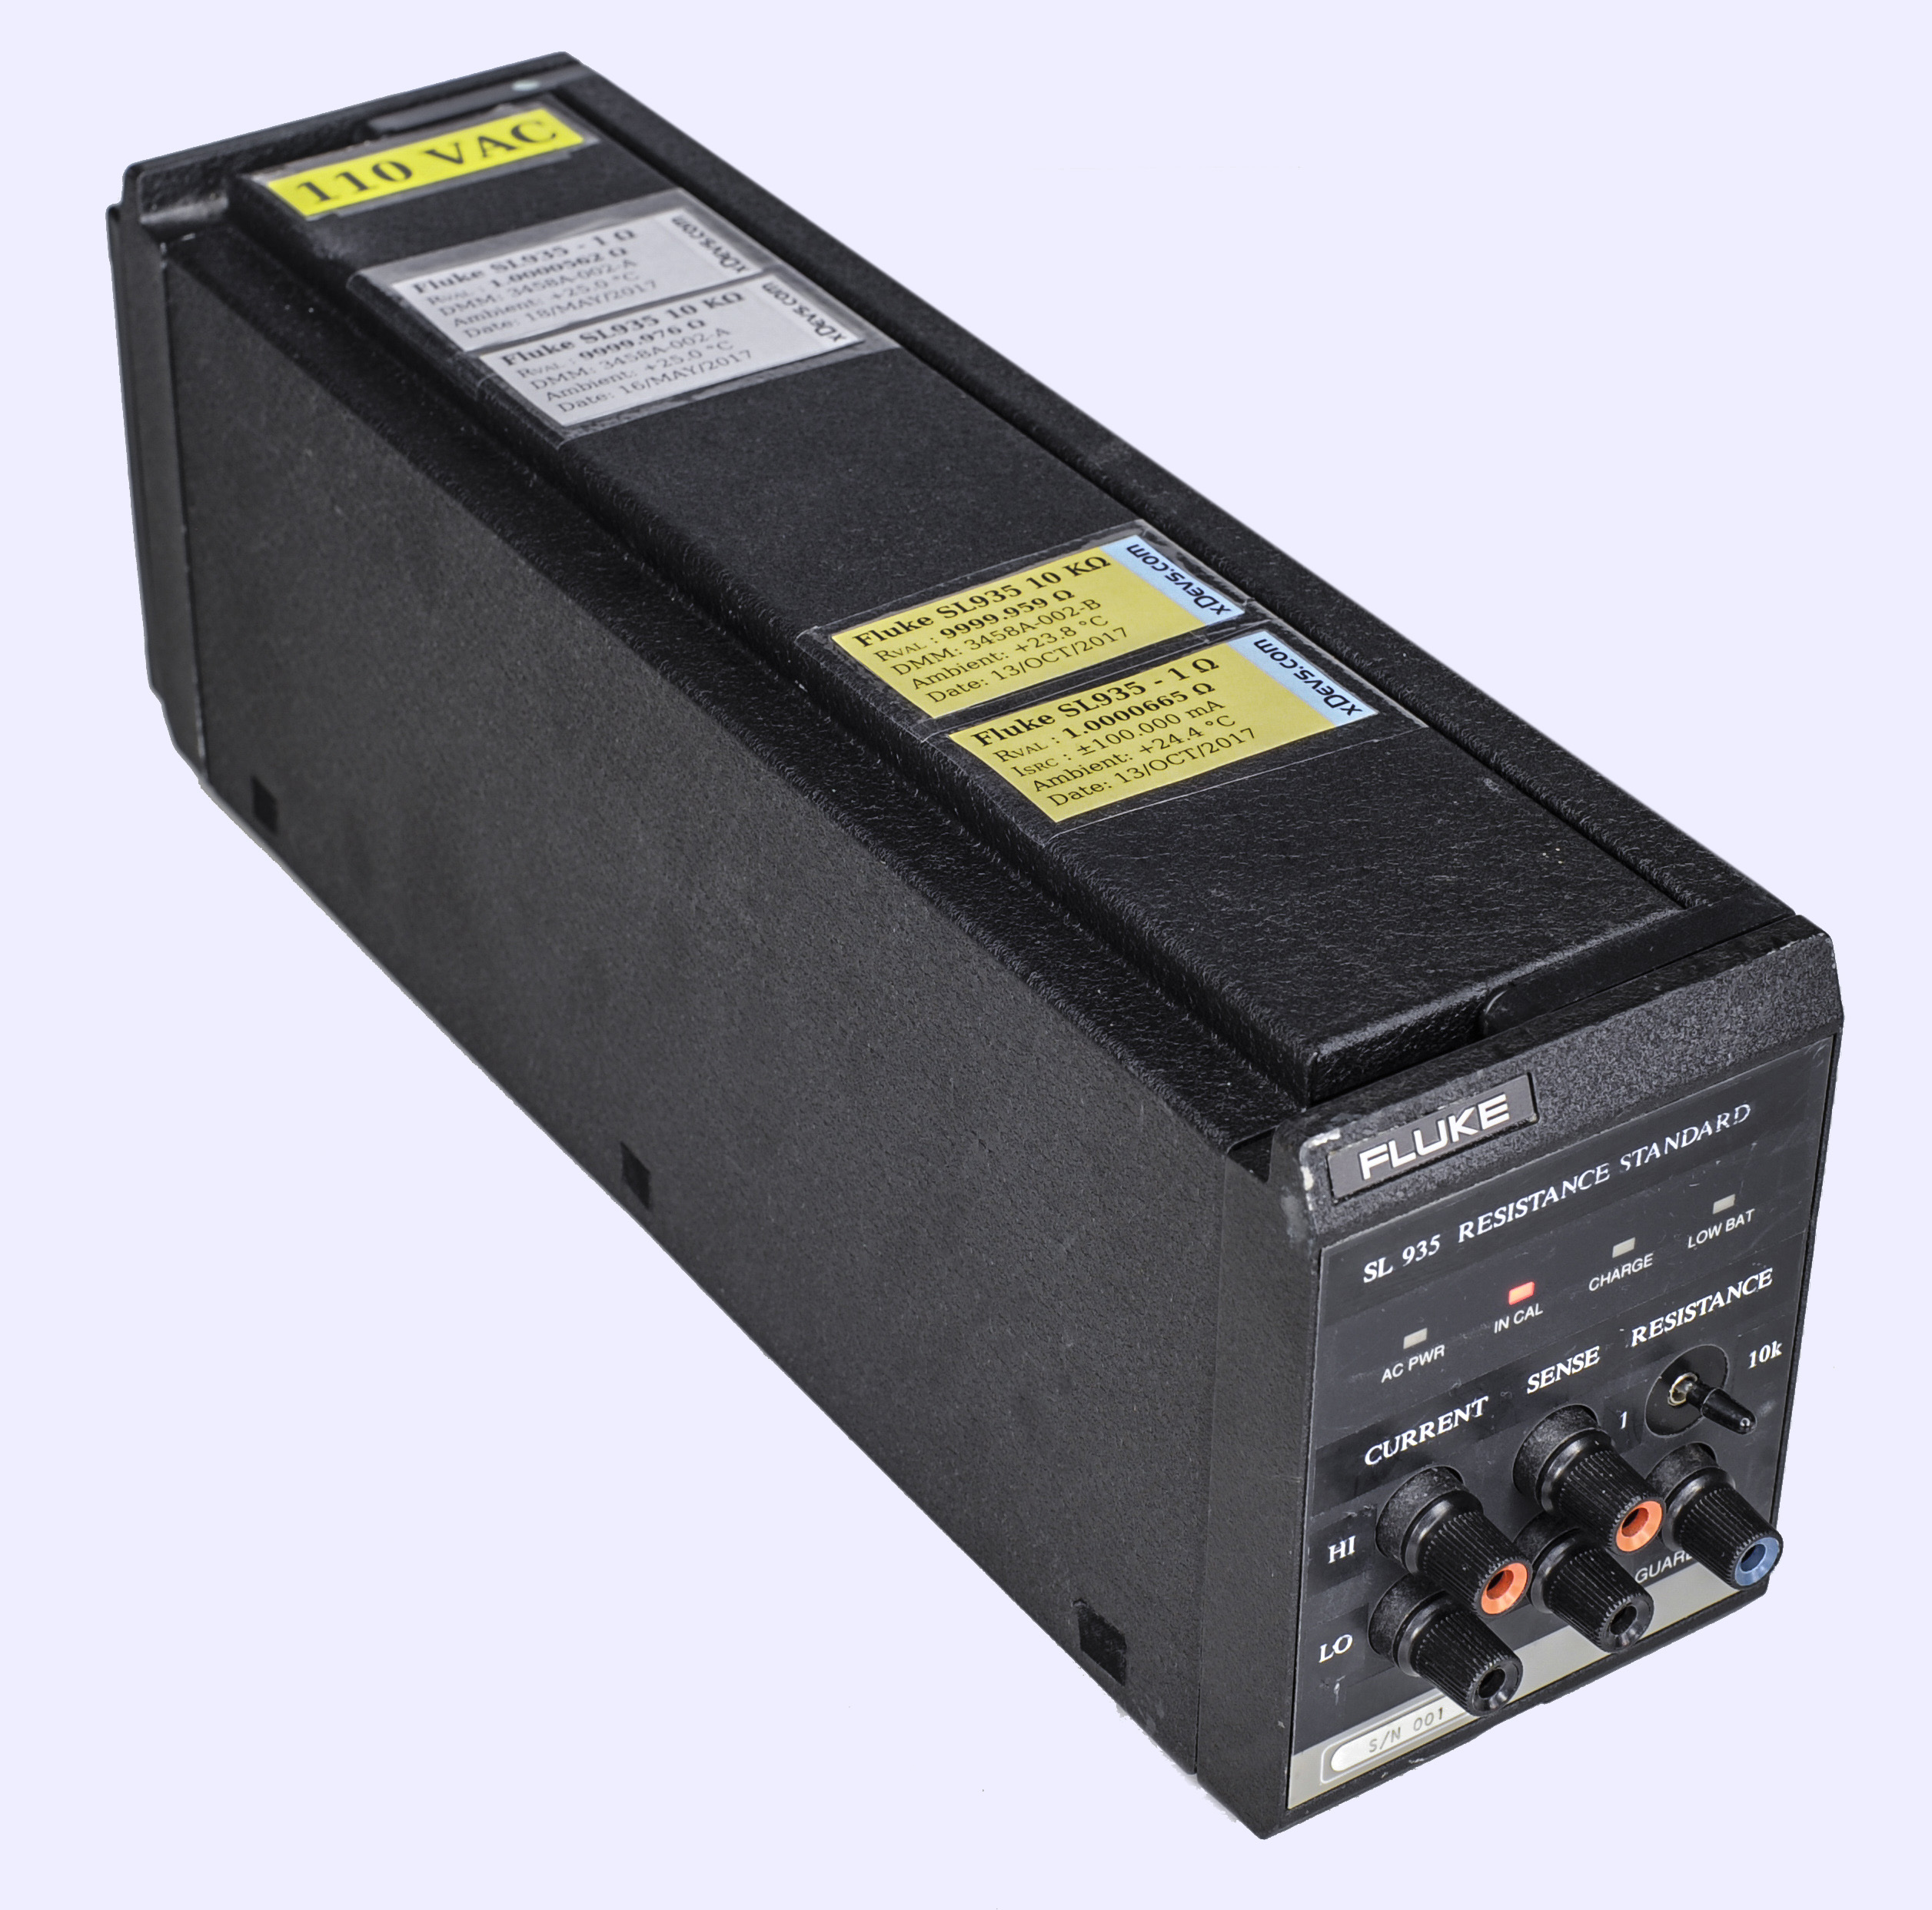
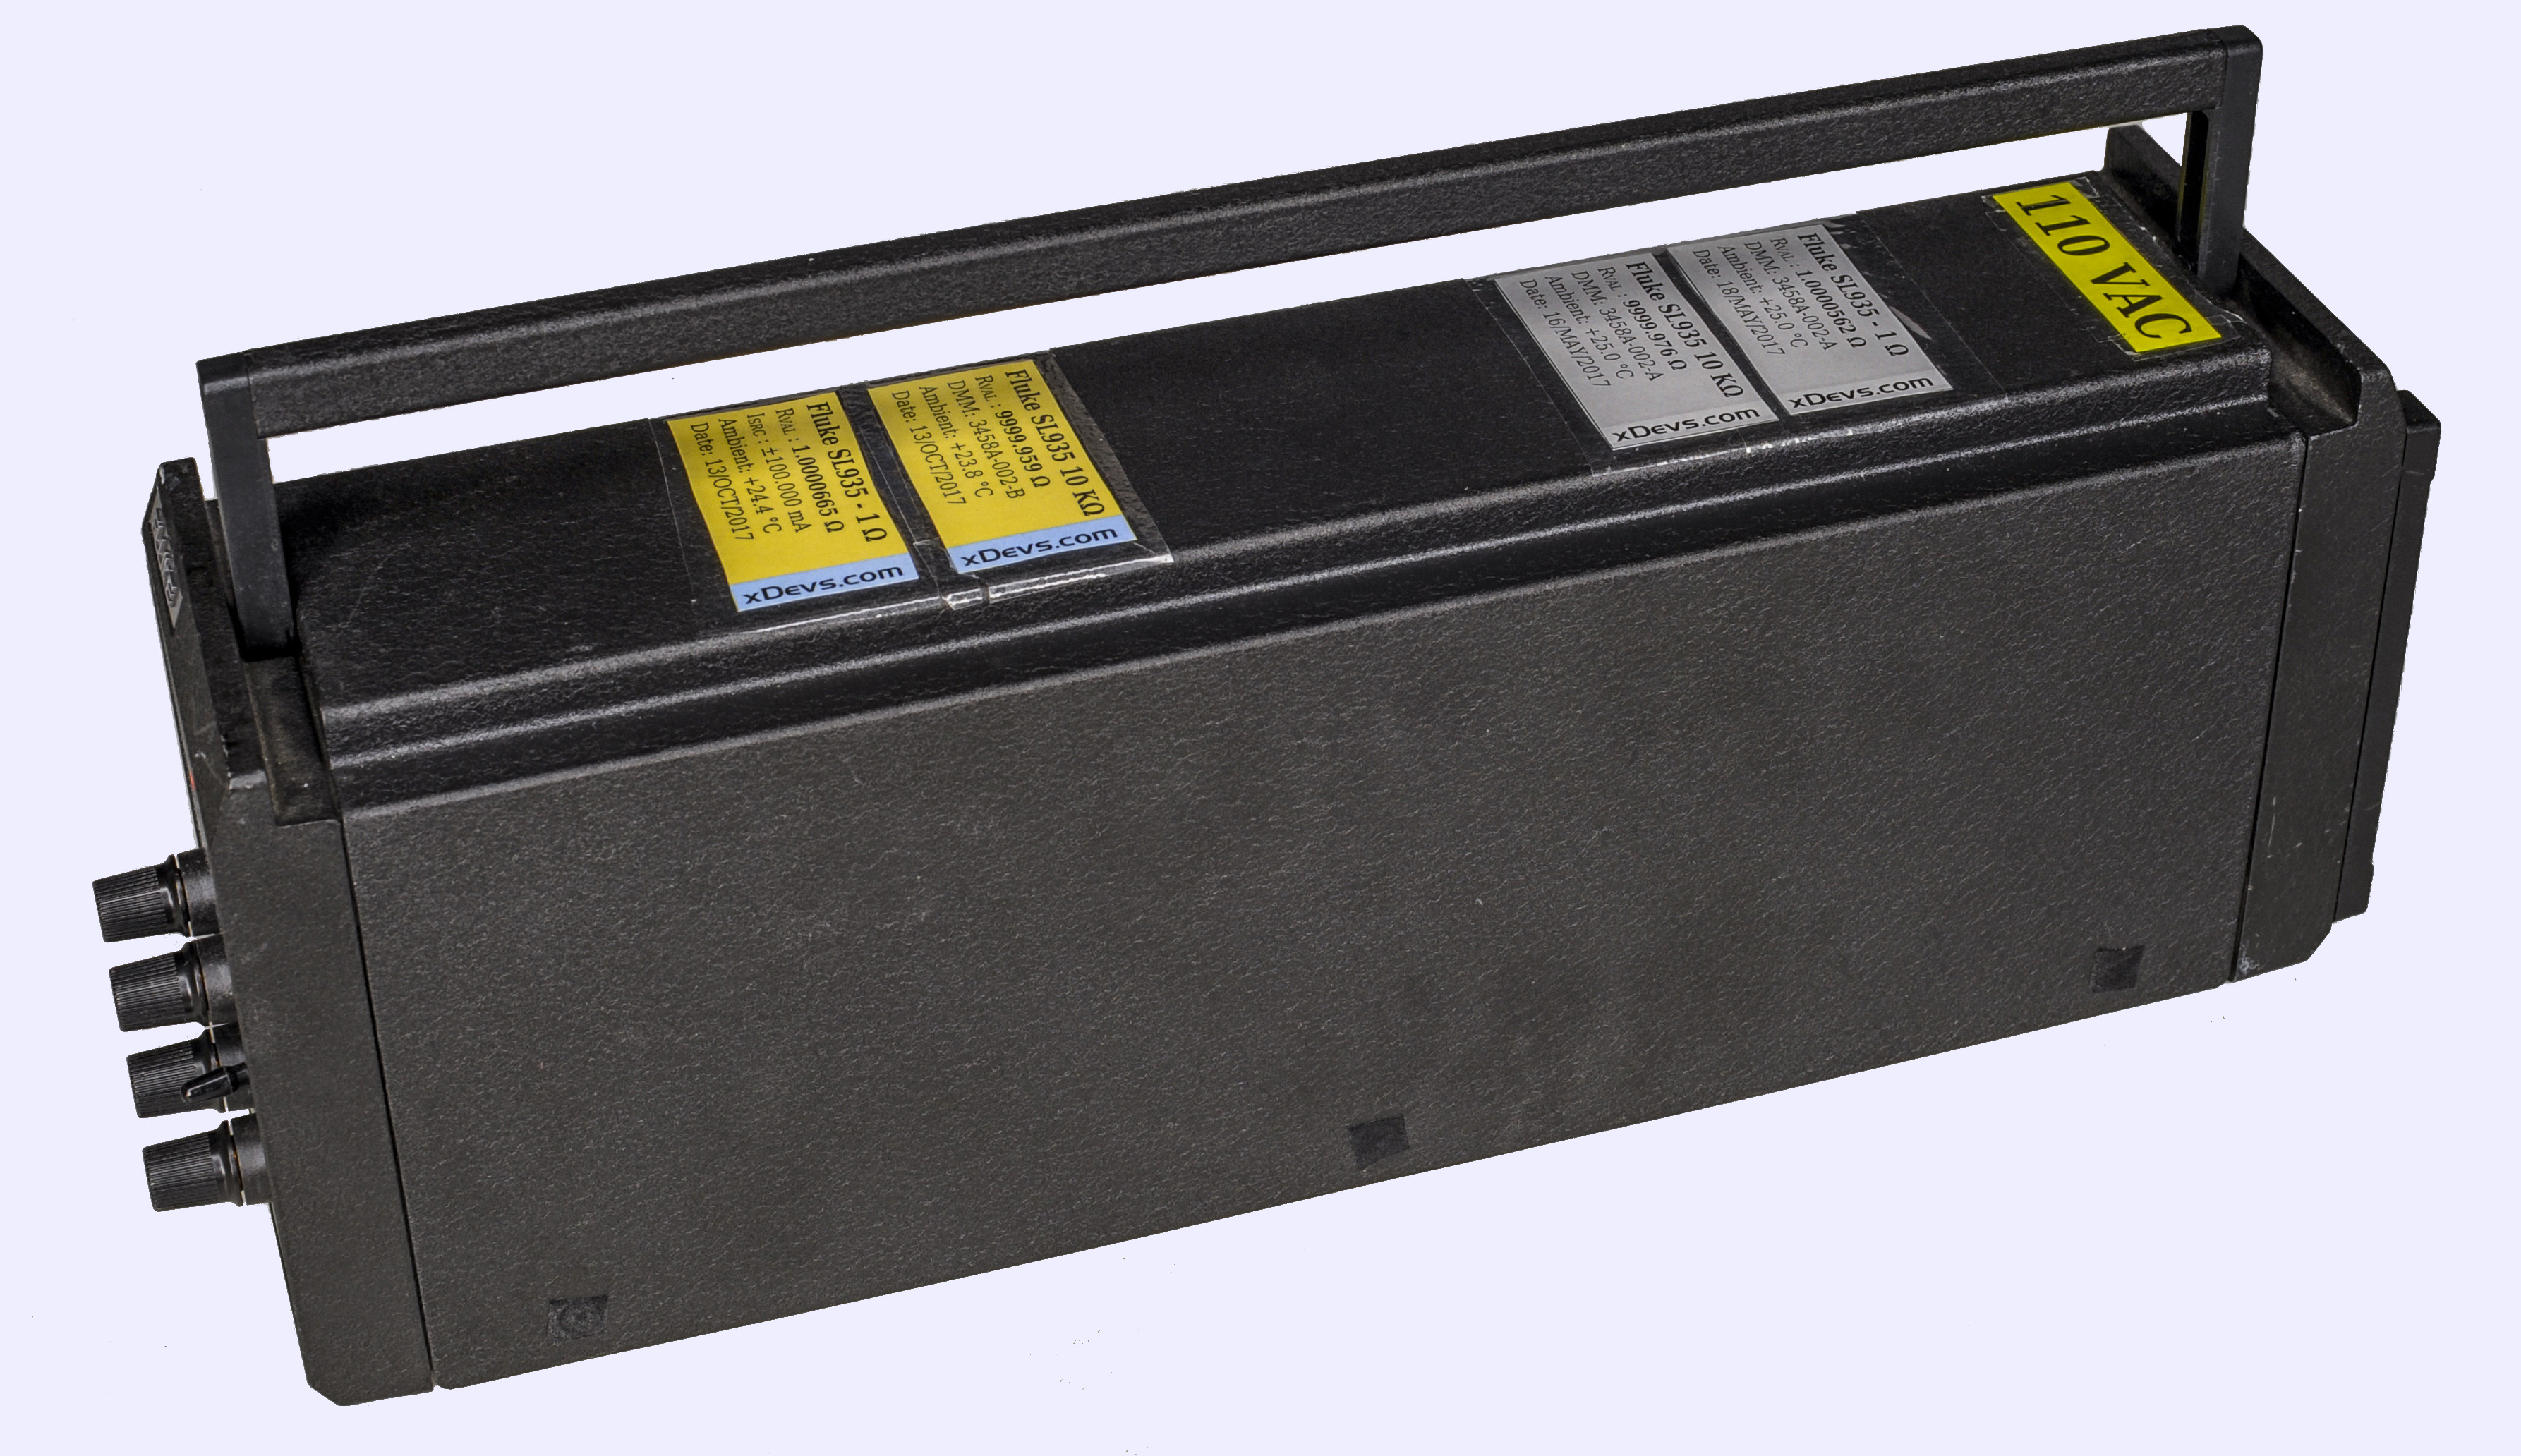
Image 35-36: Fluke SL935 front and rear side after restoration
Long-scale DMM even great HP 3458A or Datron 1281 is not good enough to perform resistance measurements at ppm-level accuracy. After initial data after assembly this Fluke SL935 is routinely sent for external calibration labs to have low uncertainty reference and better predictions. After doing this procedure for some years, we will eventually come up with even better confidence for annual stability/drift figurues.
| Item | Cost | Shipping | Supplier |
|---|---|---|---|
| Fluke SL935 prototype | $630 | $30 | bbs.38hot.net forum |
| Fluke 732B-7001 charger | $360 | $50 | eBay |
| VRLA 12V 7.0Ah | $20 | N/A | Local electronics store |
| Shipment for calibration | $490 | Priority shipping | |
| Calibration from Process Instruments 2017 | $825 | Both 1 Ω and 10 KΩ DCCT cal + tempco measurement 18°C-28°C | |
| Calibration from Process Instruments 2018 | $572 | Both 1 Ω and 10 KΩ DCCT cal | |
| Calibration from Taiwan National ITRI CMS 2019 | $790 | Both 1 Ω and 10 KΩ DCCT cal | |
| VRLA 12V 7.0Ah Panasonic | $50 | N/A | Digikey |
| Process calibration from ESI SR104 & NF742A-1 2020 | $500 | Both outputs | |
| Calibration from Measurements International | :) | $120 | Both outputs |
| Total | $5700 USD | ||
Table 9. Costs summary
And of course SL935 looks happy with it’s production brother, DC Voltage standard Fluke 732B:
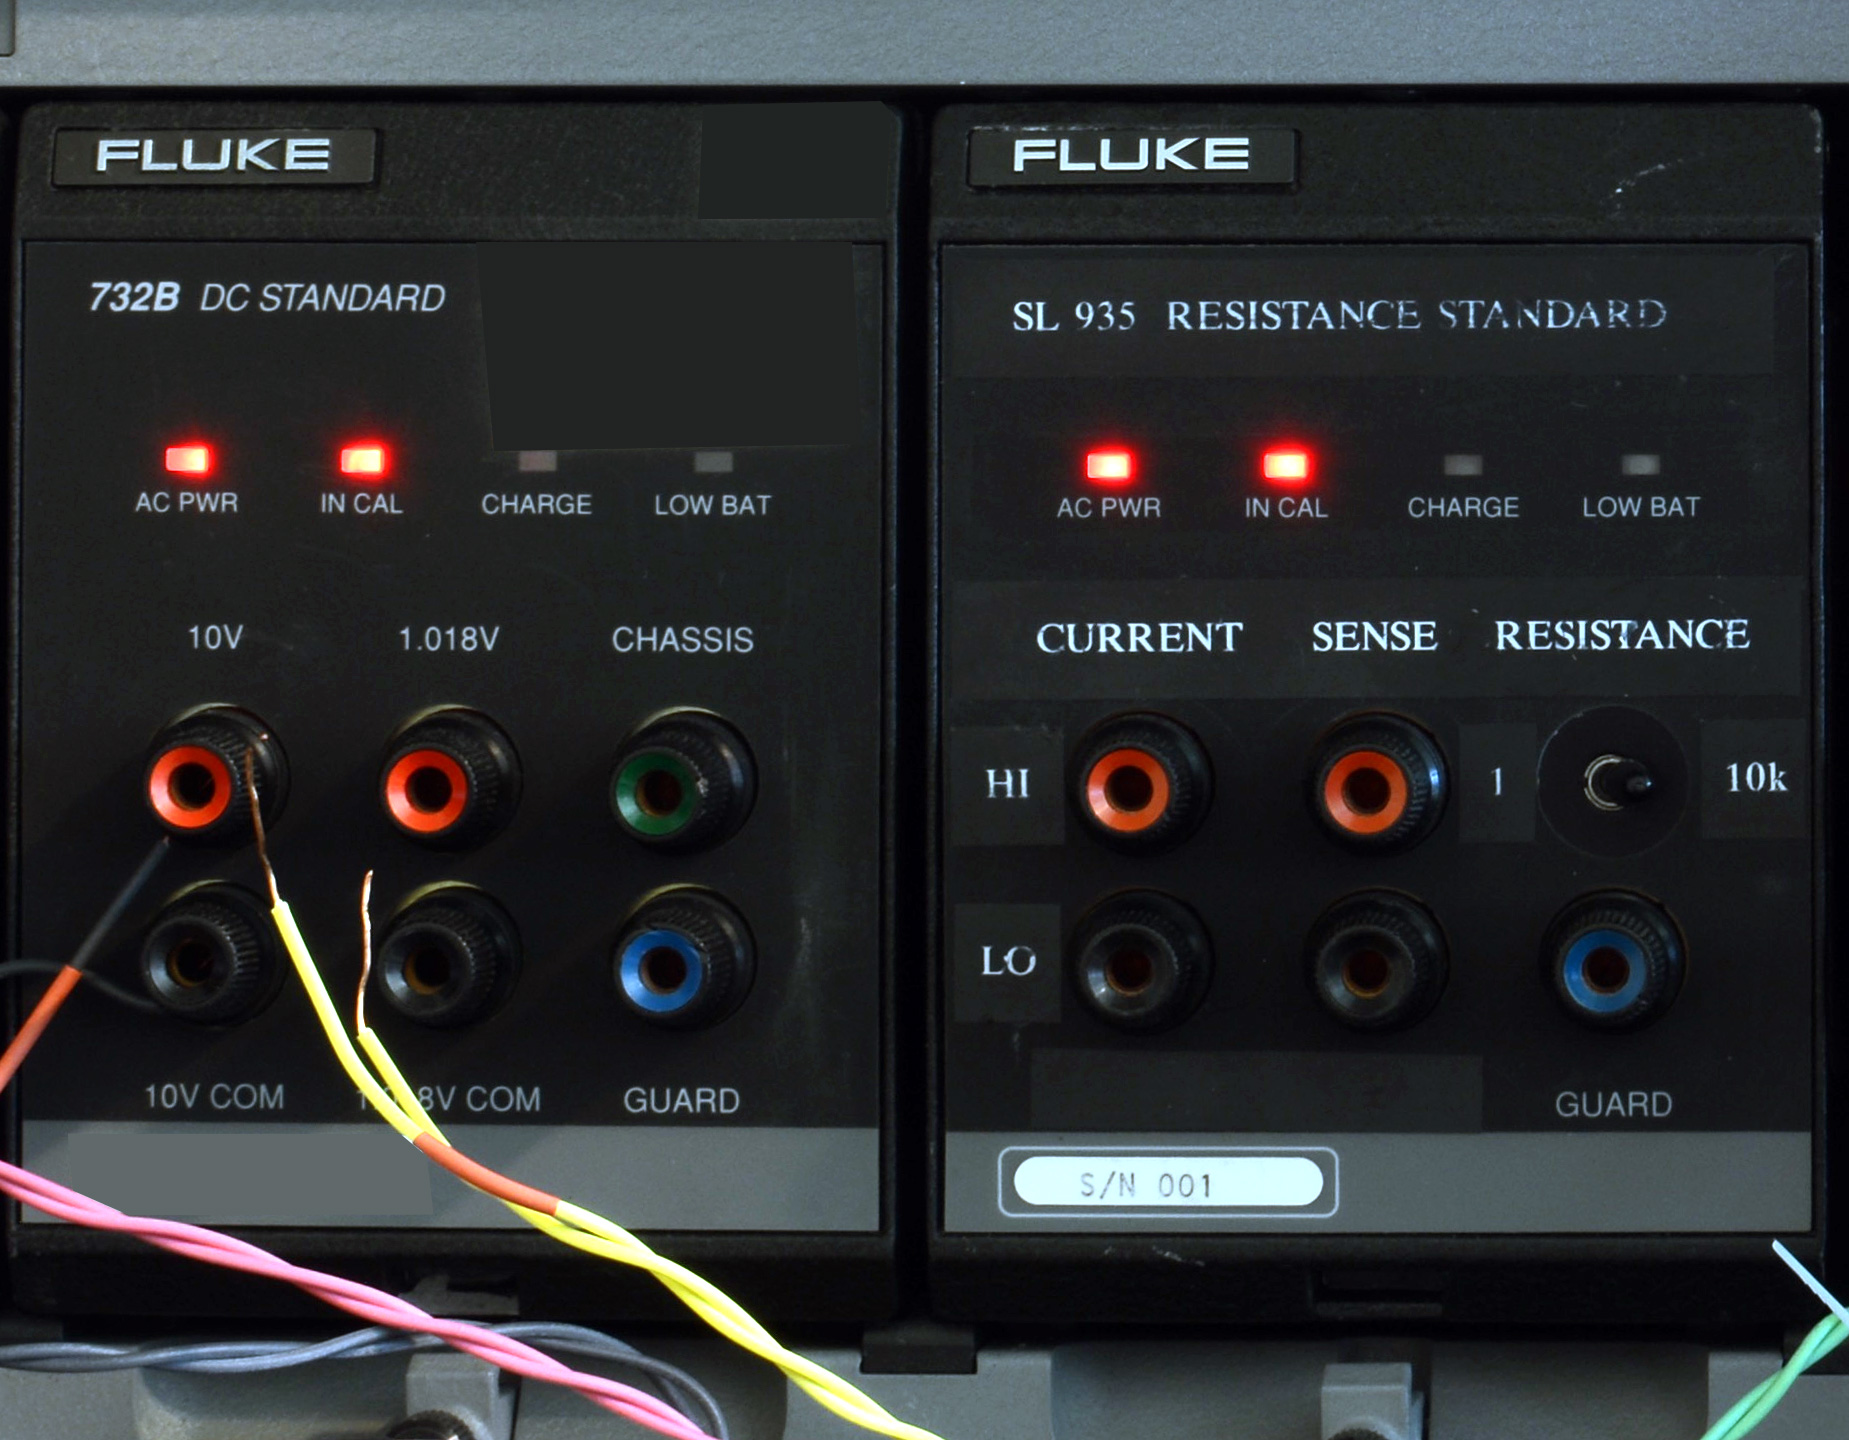
Image 37: Fluke 732B and SL935 standards.
Until then, stay tuned and let us know your feedback! Discussion about this article and related stuff is welcome in comment section or at our own IRC chat server: irc.xdevs.com (port 4808, channel: #xDevs.com).
Projects like this are born from passion and a desire to share how things work. Education is the foundation of a healthy society - especially important in today's volatile world. xDevs began as a personal project notepad in Kherson, Ukraine back in 2008 and has grown with support of passionate readers just like you. There are no (and never will be) any ads, sponsors or shareholders behind xDevs.com, just a commitment to inspire and help learning. If you are in a position to help others like us, please consider supporting xDevs.com’s home-country Ukraine in its defense of freedom to speak, freedom to live in peace and freedom to choose their way. You can use official site to support Ukraine – United24 or Help99. Every cent counts.
Modified: June 28, 2026, 12:03 a.m.