Contents
- Intro
- Disclaimer
- Manuals
- S/N G0202088930104 SR104 Design and construction
- Cleaning
- Initial measurements
- Live temperature corrected standard resistance calculator
- Calibration certificates and transfer results
- Overheat event, July 15 2026
- ESI SR104 temperature stability measurements
- ESI SR104 standard, S/N G206098830104
- S/N 632003 performance benchmarks
- S/N 824001 performance benchmarks
- S/N 851029 performance benchmarks
- S/N 342022 performance benchmarks
- S/N 734010 performance benchmarks
- S/N 948019 performance benchmarks
- Stability study of SR104 and other resistance standards
- Handle replacement
- Summary & Conclusion
![]()
![]()
![]()
![]()
![]()
![]()
![]()
![]()
![]()
![]()
![]()
![]()
![]()
![]()
Intro
After promising results from 1 Ω and 10 kΩ prototype lab resistance standard Fluke SL935, we had to have a test versus famous industry proven ESI (today IET) SR104. So here it is, right from eBay, ultimate resistance standard for the 10000 Ω. Every serious lab who care about accurate resistance measurement has one of these cute white boxes, due to high accuracy, excellent long-term stability and low temperature coefficients.
Disclaimer
Redistribution and use of this article or any images or files referenced in it, in source and binary forms, with or without modification, are permitted provided that the following conditions are met:
- Redistributions of article must retain the above copyright notice, this list of conditions, link to this page (https://xdevs.com/review/sr104/) and the following disclaimer.
- Redistributions of files in binary form must reproduce the above copyright notice, this list of conditions, link to this page (https://xdevs.com/review/sr104/), and the following disclaimer in the documentation and/or other materials provided with the distribution, for example Readme file.
All information posted here is hosted just for education purposes and provided AS IS. In no event shall the author, xDevs.com site, or IET or any other 3rd party be liable for any special, direct, indirect, or consequential damages or any damages whatsoever resulting from loss of use, data or profits, whether in an action of contract, negligence or other tortuous action, arising out of or in connection with the use or performance of information published here.
If you willing to contribute or have interesting documentation to share regarding pressure measurements or metrology and electronics in general, you can do so by following these simple instructions.
Certain commercial organizations, equipment, or materials may be identified in this article in order to describe an experimental procedures or the concepts adequately. Such identification is not intended to imply recommendation or endorsement by xDevs.com or author, nor is it intended to imply that the materials, or equipment are necessarily the best available for the purpose.
Manuals and comparison to production standards
IET (ESI) SR104 10KΩ Resistance Standard instruction manual, July 2014
Comparison for known specifications of other resistance standards:
| Specification | Fluke SL935 | Fluke 742A-1 | Fluke 742A-10K | ESI/IET SR104 | IET SRL-1 |
|---|---|---|---|---|---|
| Output resistance | 1 Ω and 10 KΩ | 1 Ω | 10 KΩ | 10 KΩ | 1 Ω |
| Accuracy (1y) | 60 µΩ/Ω, 3 µΩ/Ω | ±2 µΩ/Ω | ±2 µΩ/Ω | ±1 µΩ/Ω | ±2 µΩ/Ω |
| Temperature coefficient, linear | <0.05 µΩ/Ω/°C, <0.05 µΩ/Ω/°C | ±3 µΩ/Ω | ±1.5 µΩ/Ω | <±1 µΩ/Ω/°C | ±3 µΩ/Ω max (18-28°C) |
| Long term 1 year stability | +0.82 µΩ/Ω/y , +0.07 µΩ/Ω/y meas | ±8 µΩ/Ω/y spec | ±4 µΩ/Ω/y spec | ±0.5 µΩ/Ω/y spec, ±+0.04 µΩ/Ω/y meas | ±2 µΩ/Ω/y spec |
| Load current, maximum | 100mA, 500µA | 200 mA | 600 µA | 1 mA, 1 W | 418 mA |
| Construction type | Hermetic Fluke film networks | Precision wire-wound | Wirewound resistor in oil tank | Precision wire-wound | |
| Active thermal compensation | Yes, +35 °C oven assembly | None | Thermistor in oil tank | None | |
| Temperature sensor | Yes, 100 KΩ thermistor | No | No | Yes, 10 KΩ thermistor | No |
| Power requirements | AC mains or +12VDC 300mA | Not required, passive device | |||
| Backup/offline power supply | Internal 7.0 Ah +12V VRLA | Not required, passive device | |||
| Dimensions, weight | 86 × 105 × 127 mm, 910g | 254 × 206 × 311 mm, 4.8kg | 86 × 105 × 127 mm, 730g | ||
| MSRP | N/A, Prototype | $3600 USD | $3600 USD | $7728-8851 USD ($7147 – 2018) | $1974 USD |
Table 1. Comparison of primary resistance standards specifications.
There are also other versions of SR10x resistors with other values. Special order SP5120 and SP5121 were made by ESI/Tegam to national measurements laboratories for the applications with QHR and CCC comparisons. Their nominal values were matched to RK value at n=2 and n=4 plateau.
| Model | Nominal value | Accuracy | Max voltage | Recommended power |
|---|---|---|---|---|
| SR100 | 1 Ω | ±10 µΩ/Ω | 0.100 V | 10 mW |
| SR102 | 100 Ω | ±1 µΩ/Ω | 1.000 V | 10 mW |
| SR103 | 1000 Ω | ±1 µΩ/Ω | 3.160 V | 10 mW |
| SR104 | 10000 Ω | ±1 µΩ/Ω | 10 V | 10 mW |
| SP5120 | 6453.2 Ω | ±1 µΩ/Ω | 10 V | 10 mW |
| SP5121 | 12906.4 Ω | ±1 µΩ/Ω | 10 V | 10 mW |
Table 2. SR10x series of resistance standards from IET.
Option Deleted Case (DC), such as SR-100/DC,SR-102/DC, SR-103/DC, SR-104/DC The deleted case (DC) option available from IET to allow use of SR10x-series for full immersion oil-bath operation. This version comes without the external case, but it retains the five-terminal connection to the resistor. When the standards are used in an oil bath, the resistance elements maintain a constant temperature, providing outstanding short-term stability, which is especially important when making Quantum Hall Effect measurements.
SR104 Design and construction
ESI SR10x series resistance standards are essentially box with ultra-stable resistive element, temperature sensor, all enclosed in sealed oil-filled metal can. Everything is embedded in nice wooden box (there is option from IET without wooden enclosure as well).
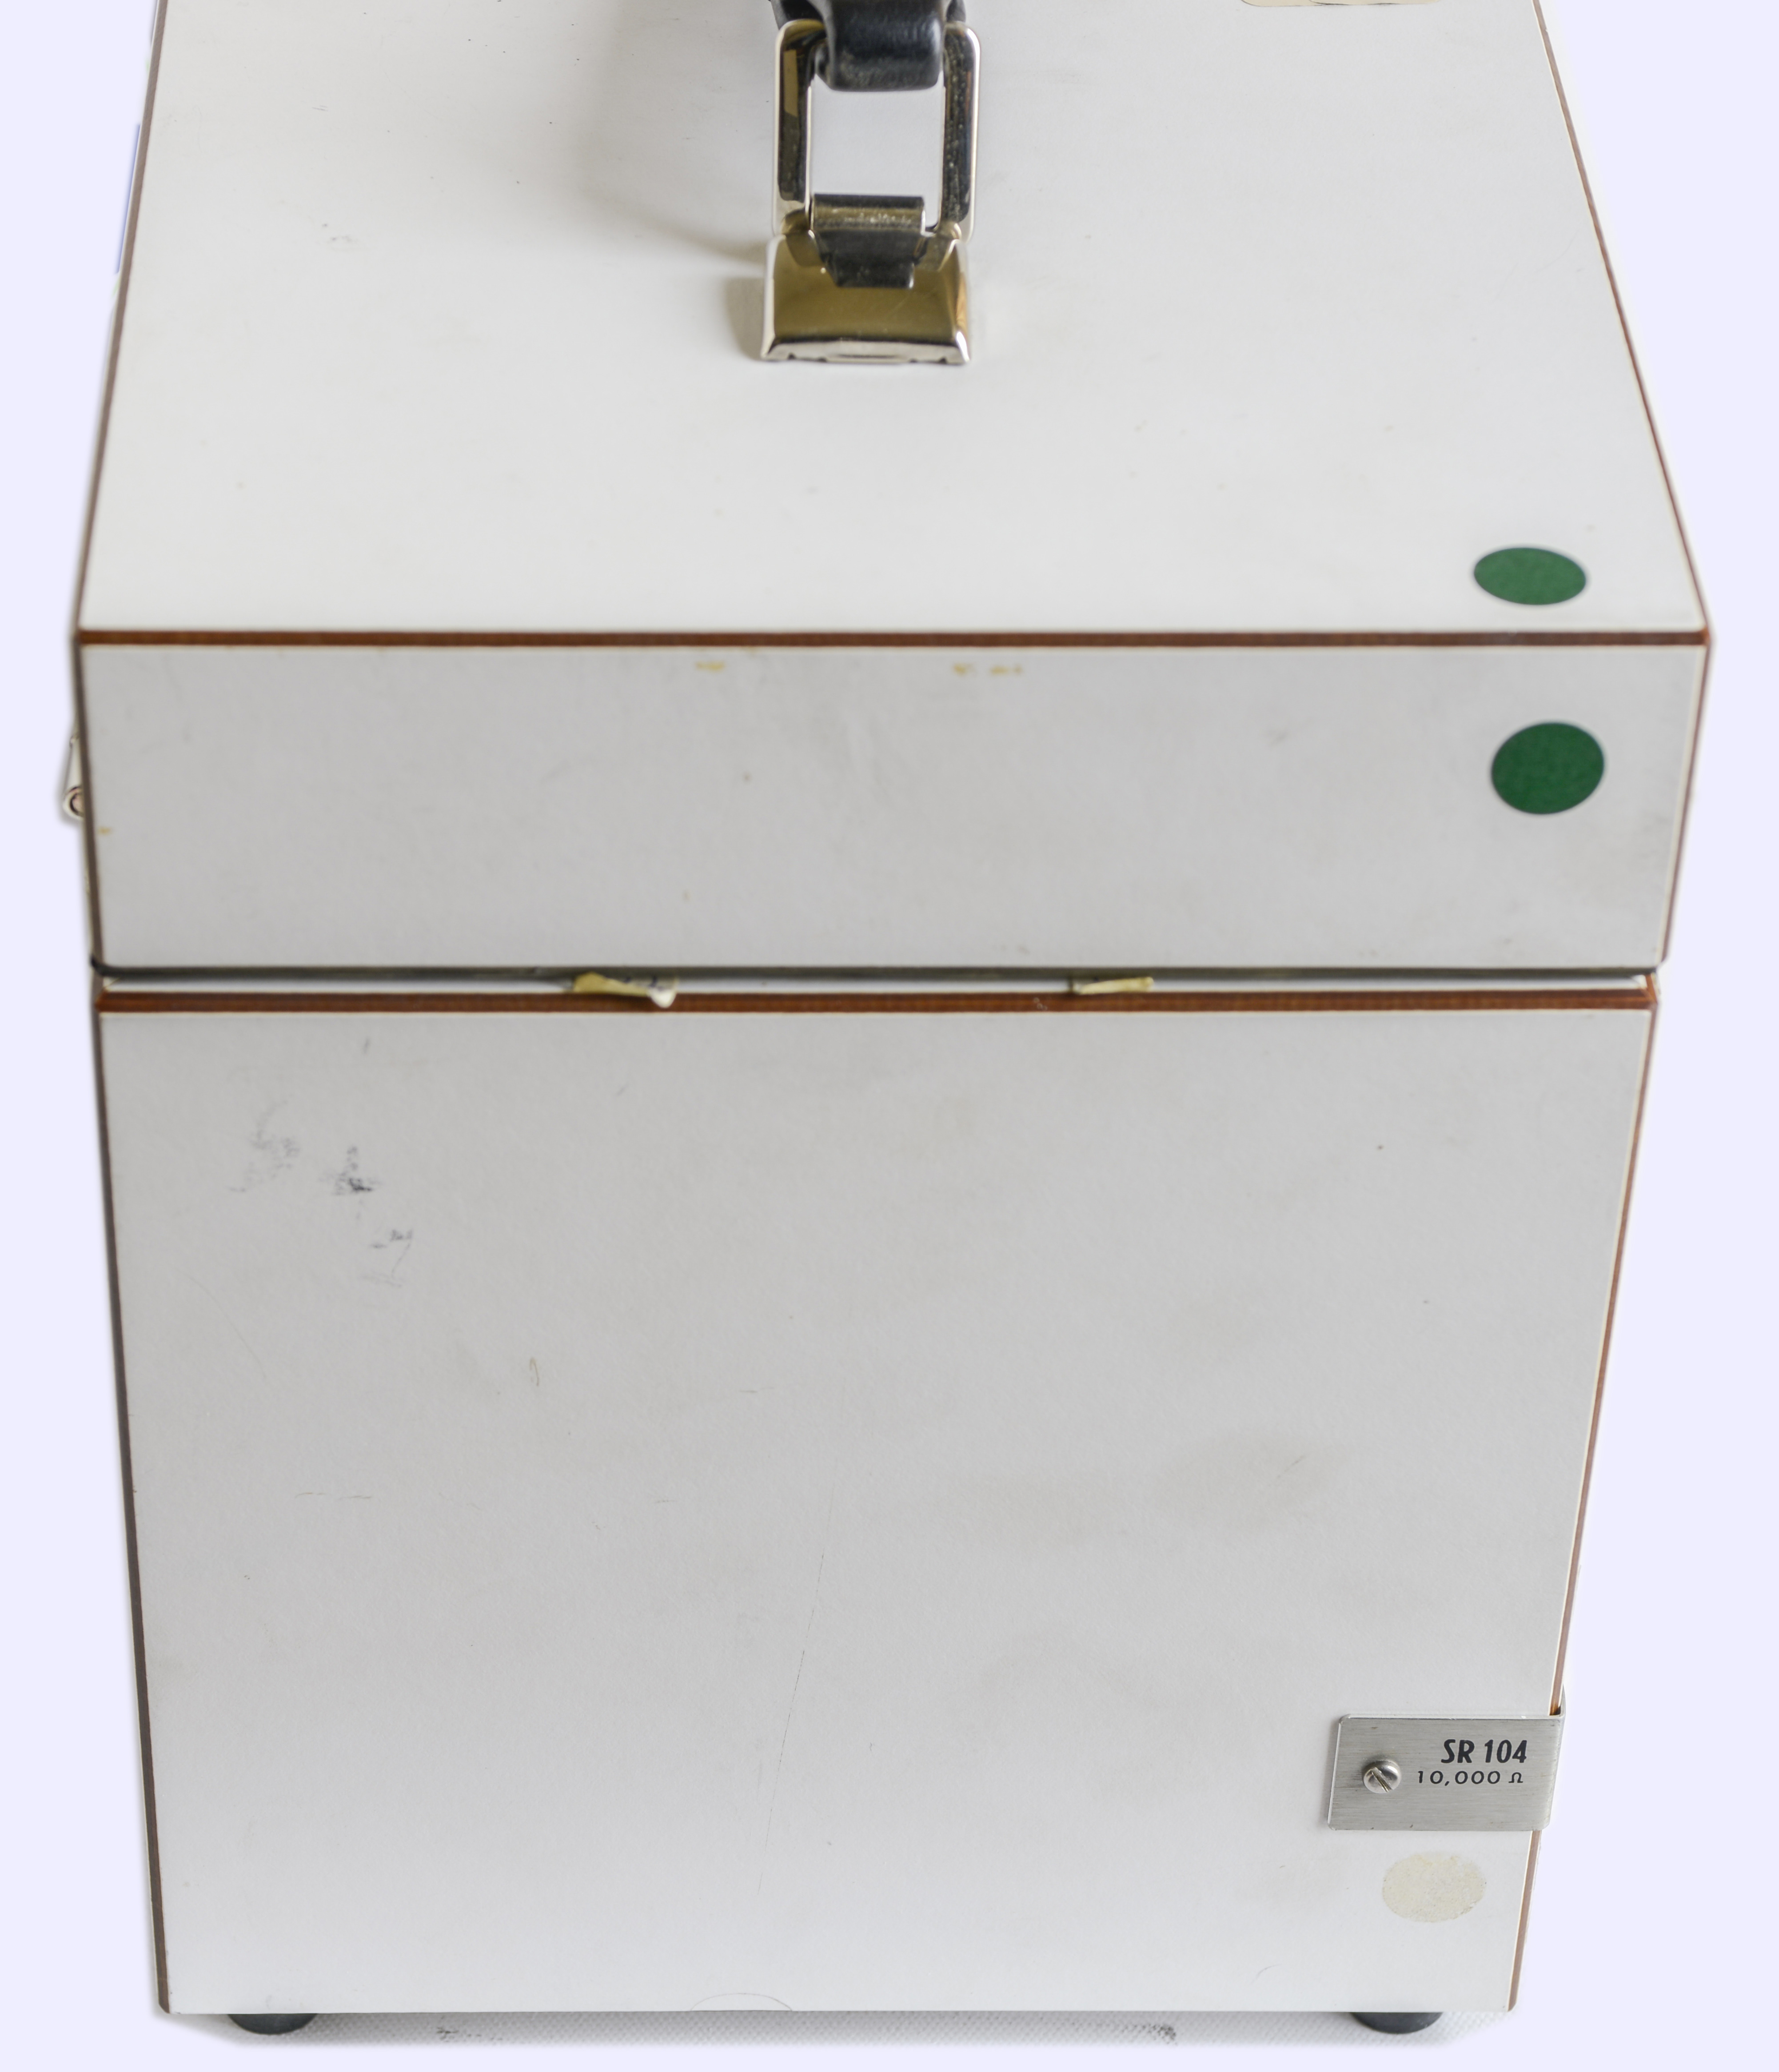
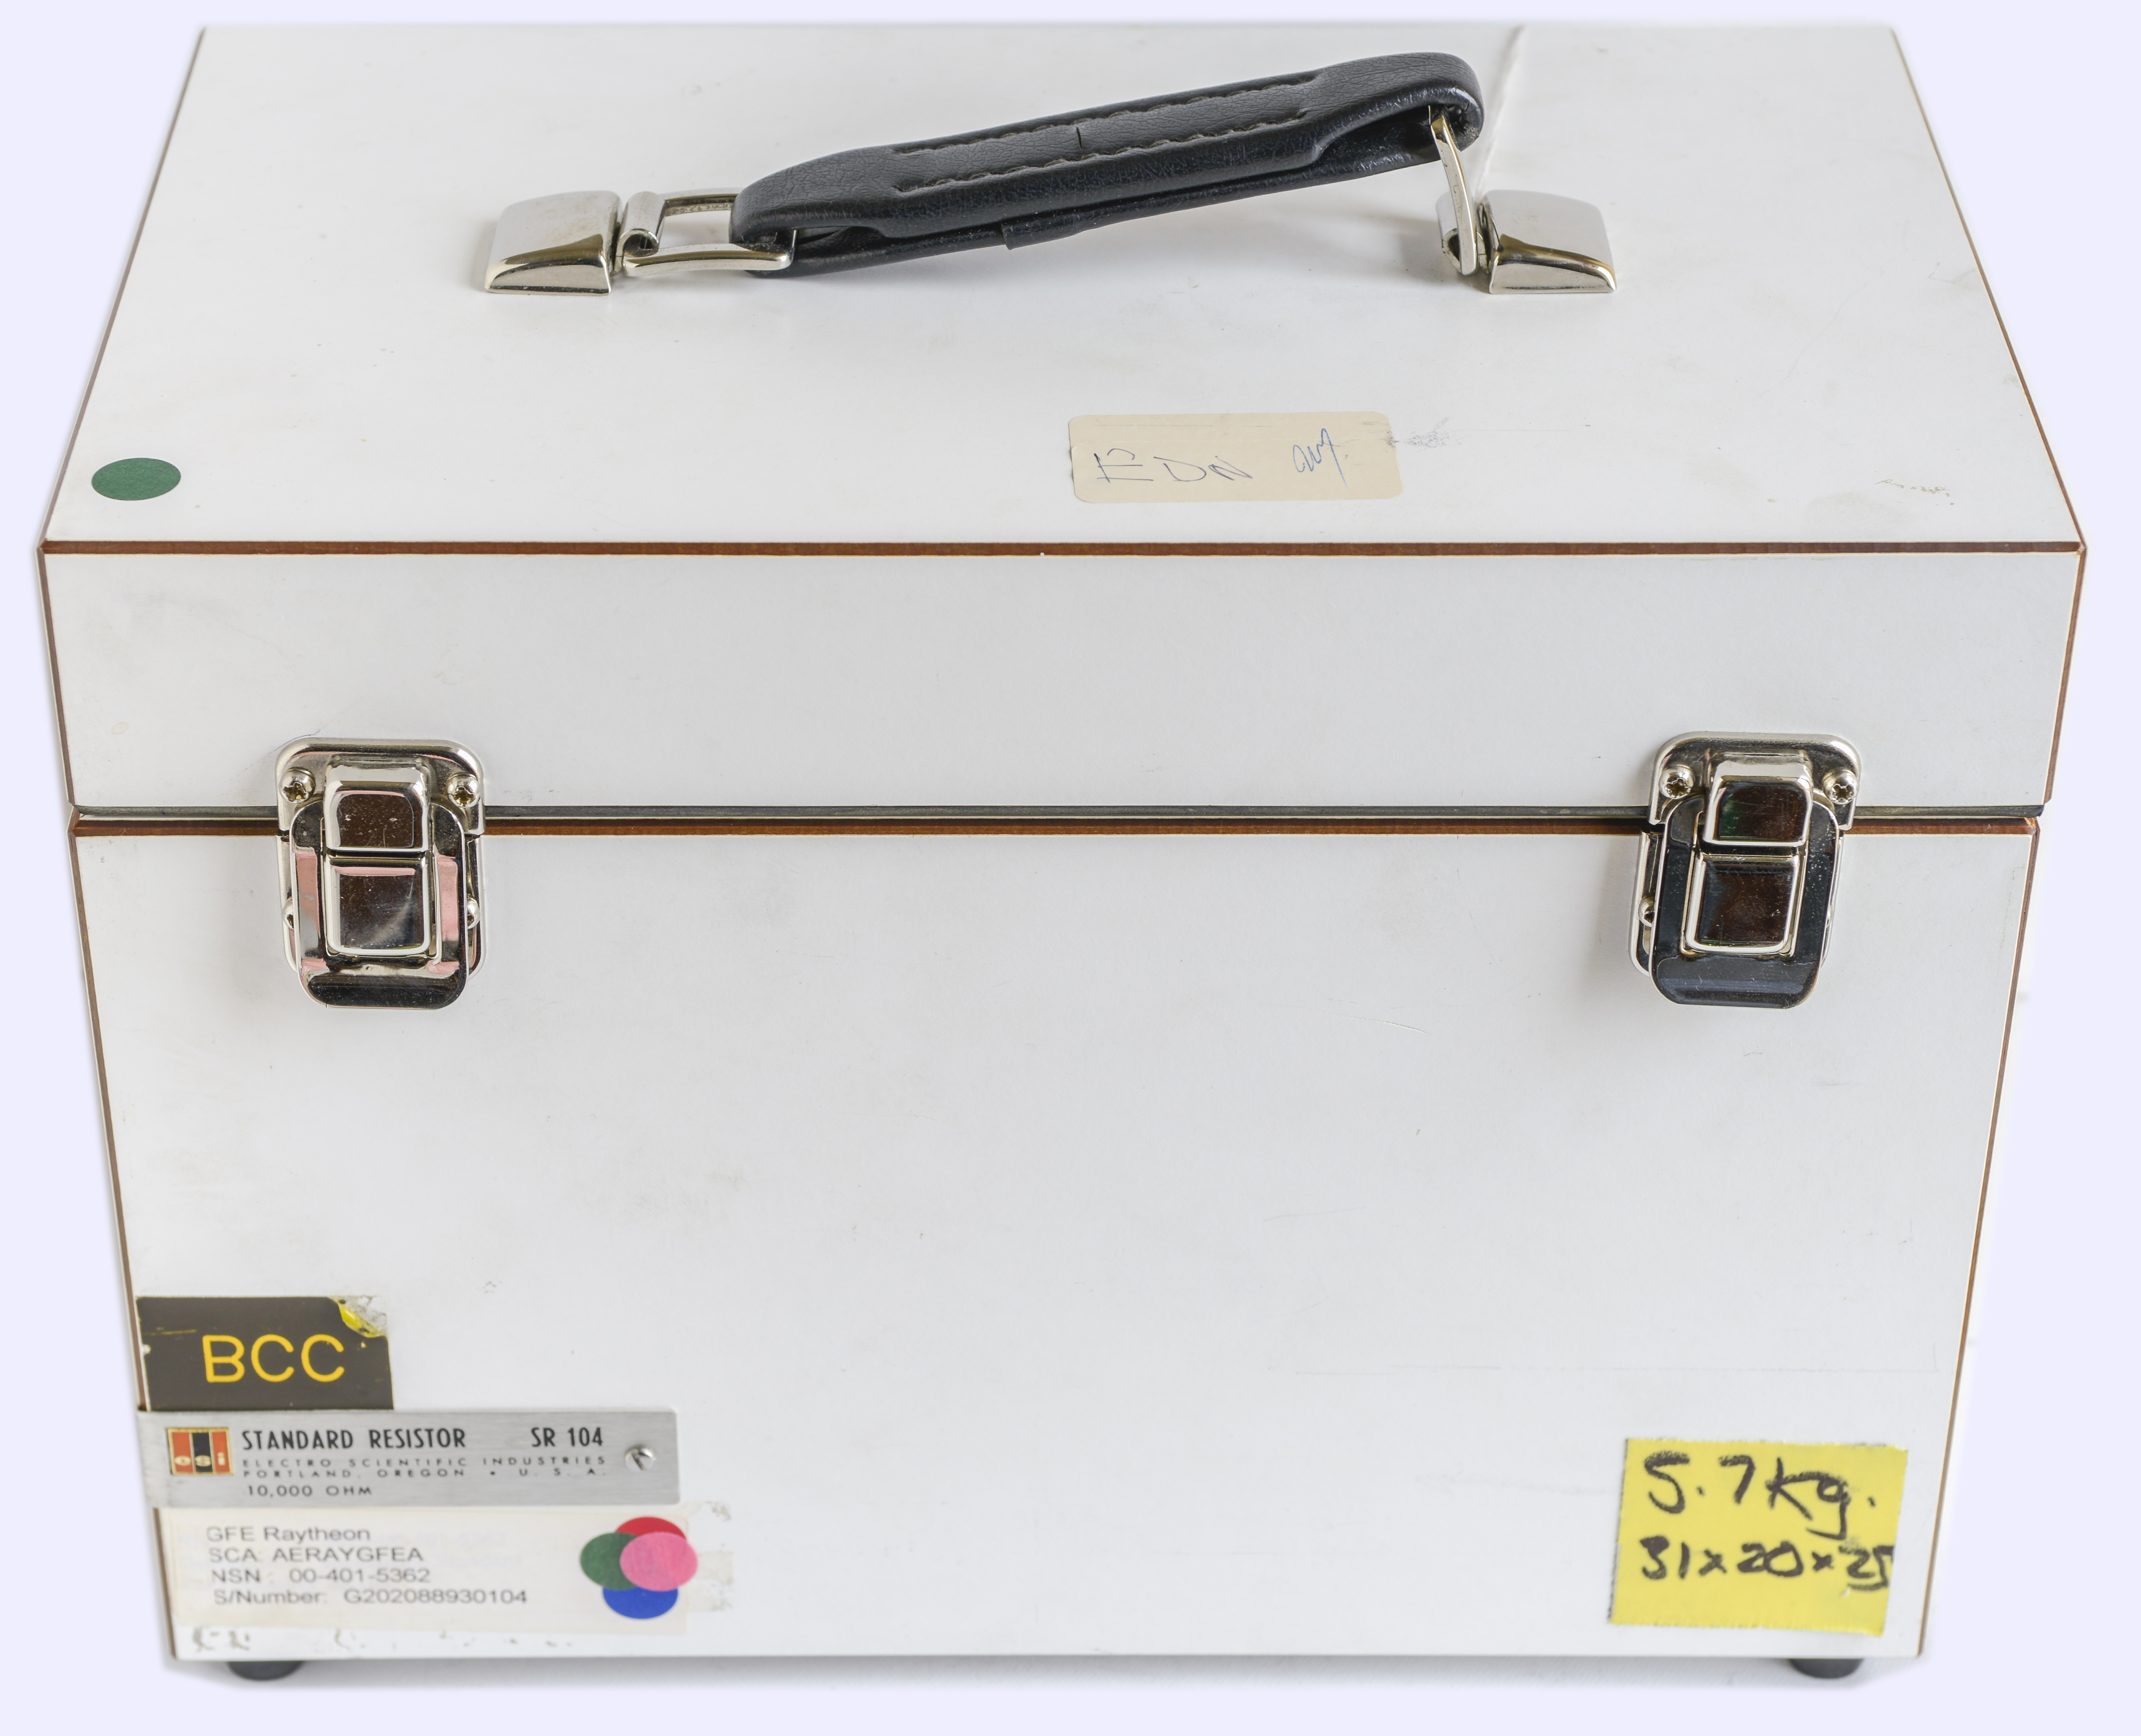

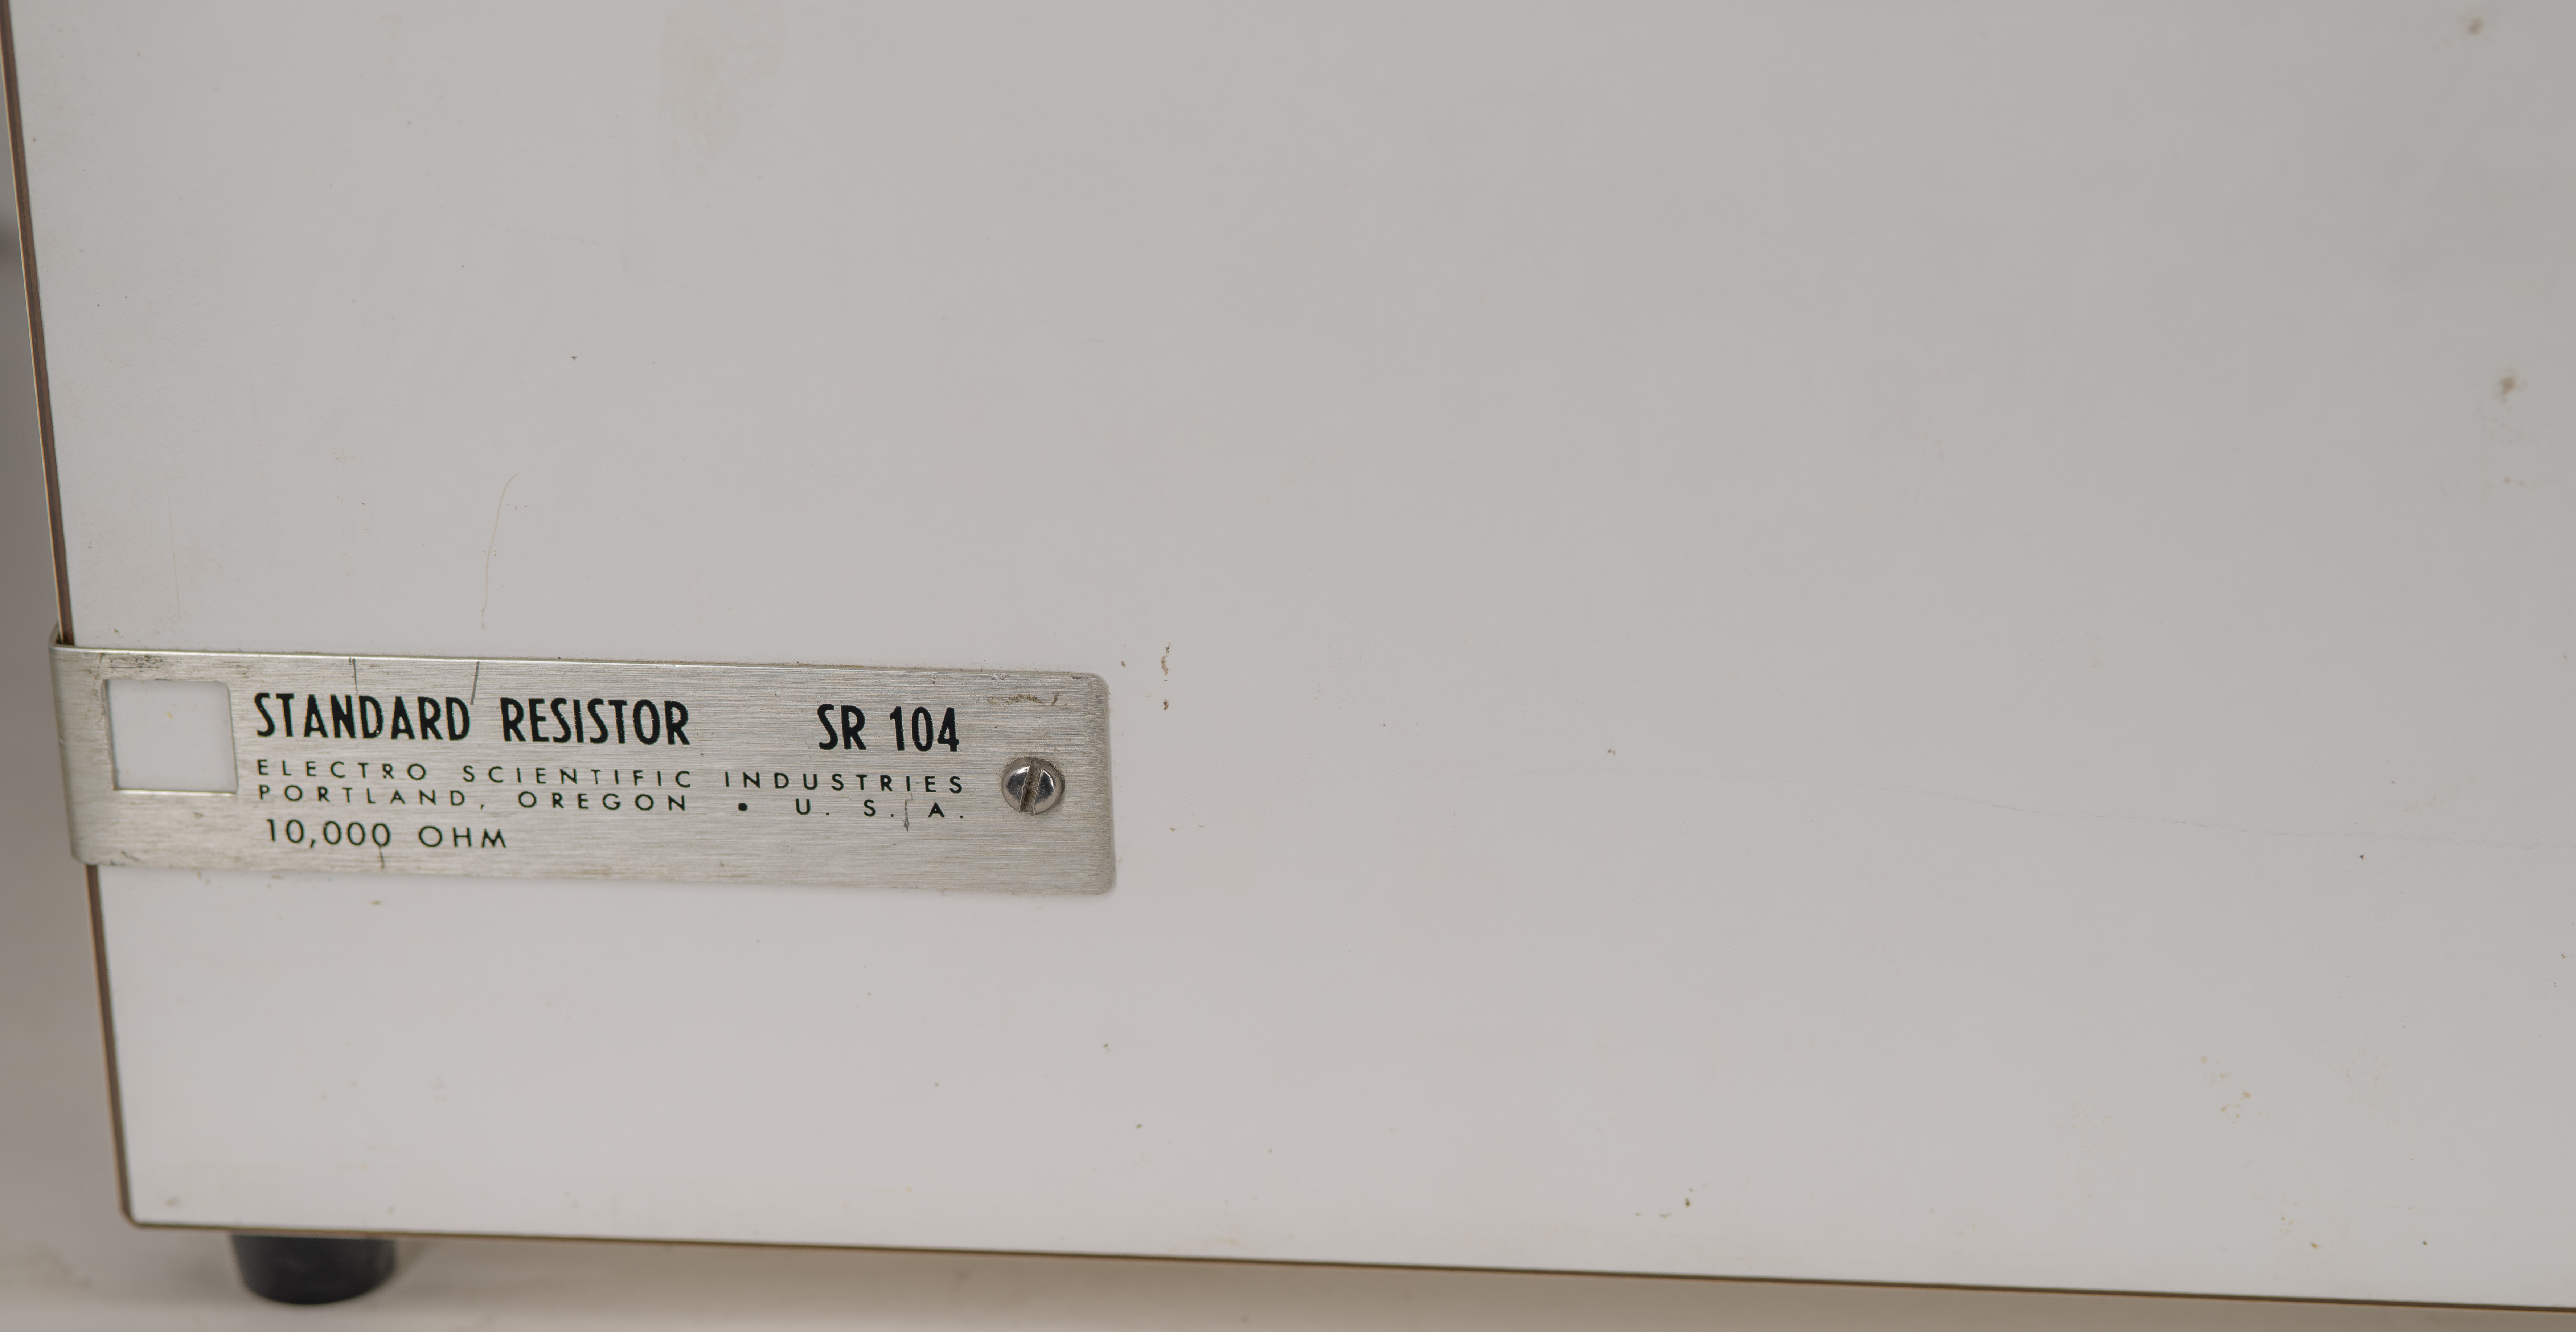
Image 1-3: ESI SR104 in condition as received.
It’s little dirty and peppered with stickers, but nothing criminal outside. ESI SR10x are mounted in a nice white wooden case, with a removable lid and carrying handle. Calibration and other standard data is attached to the inside of the lid, specific to each particular sample.
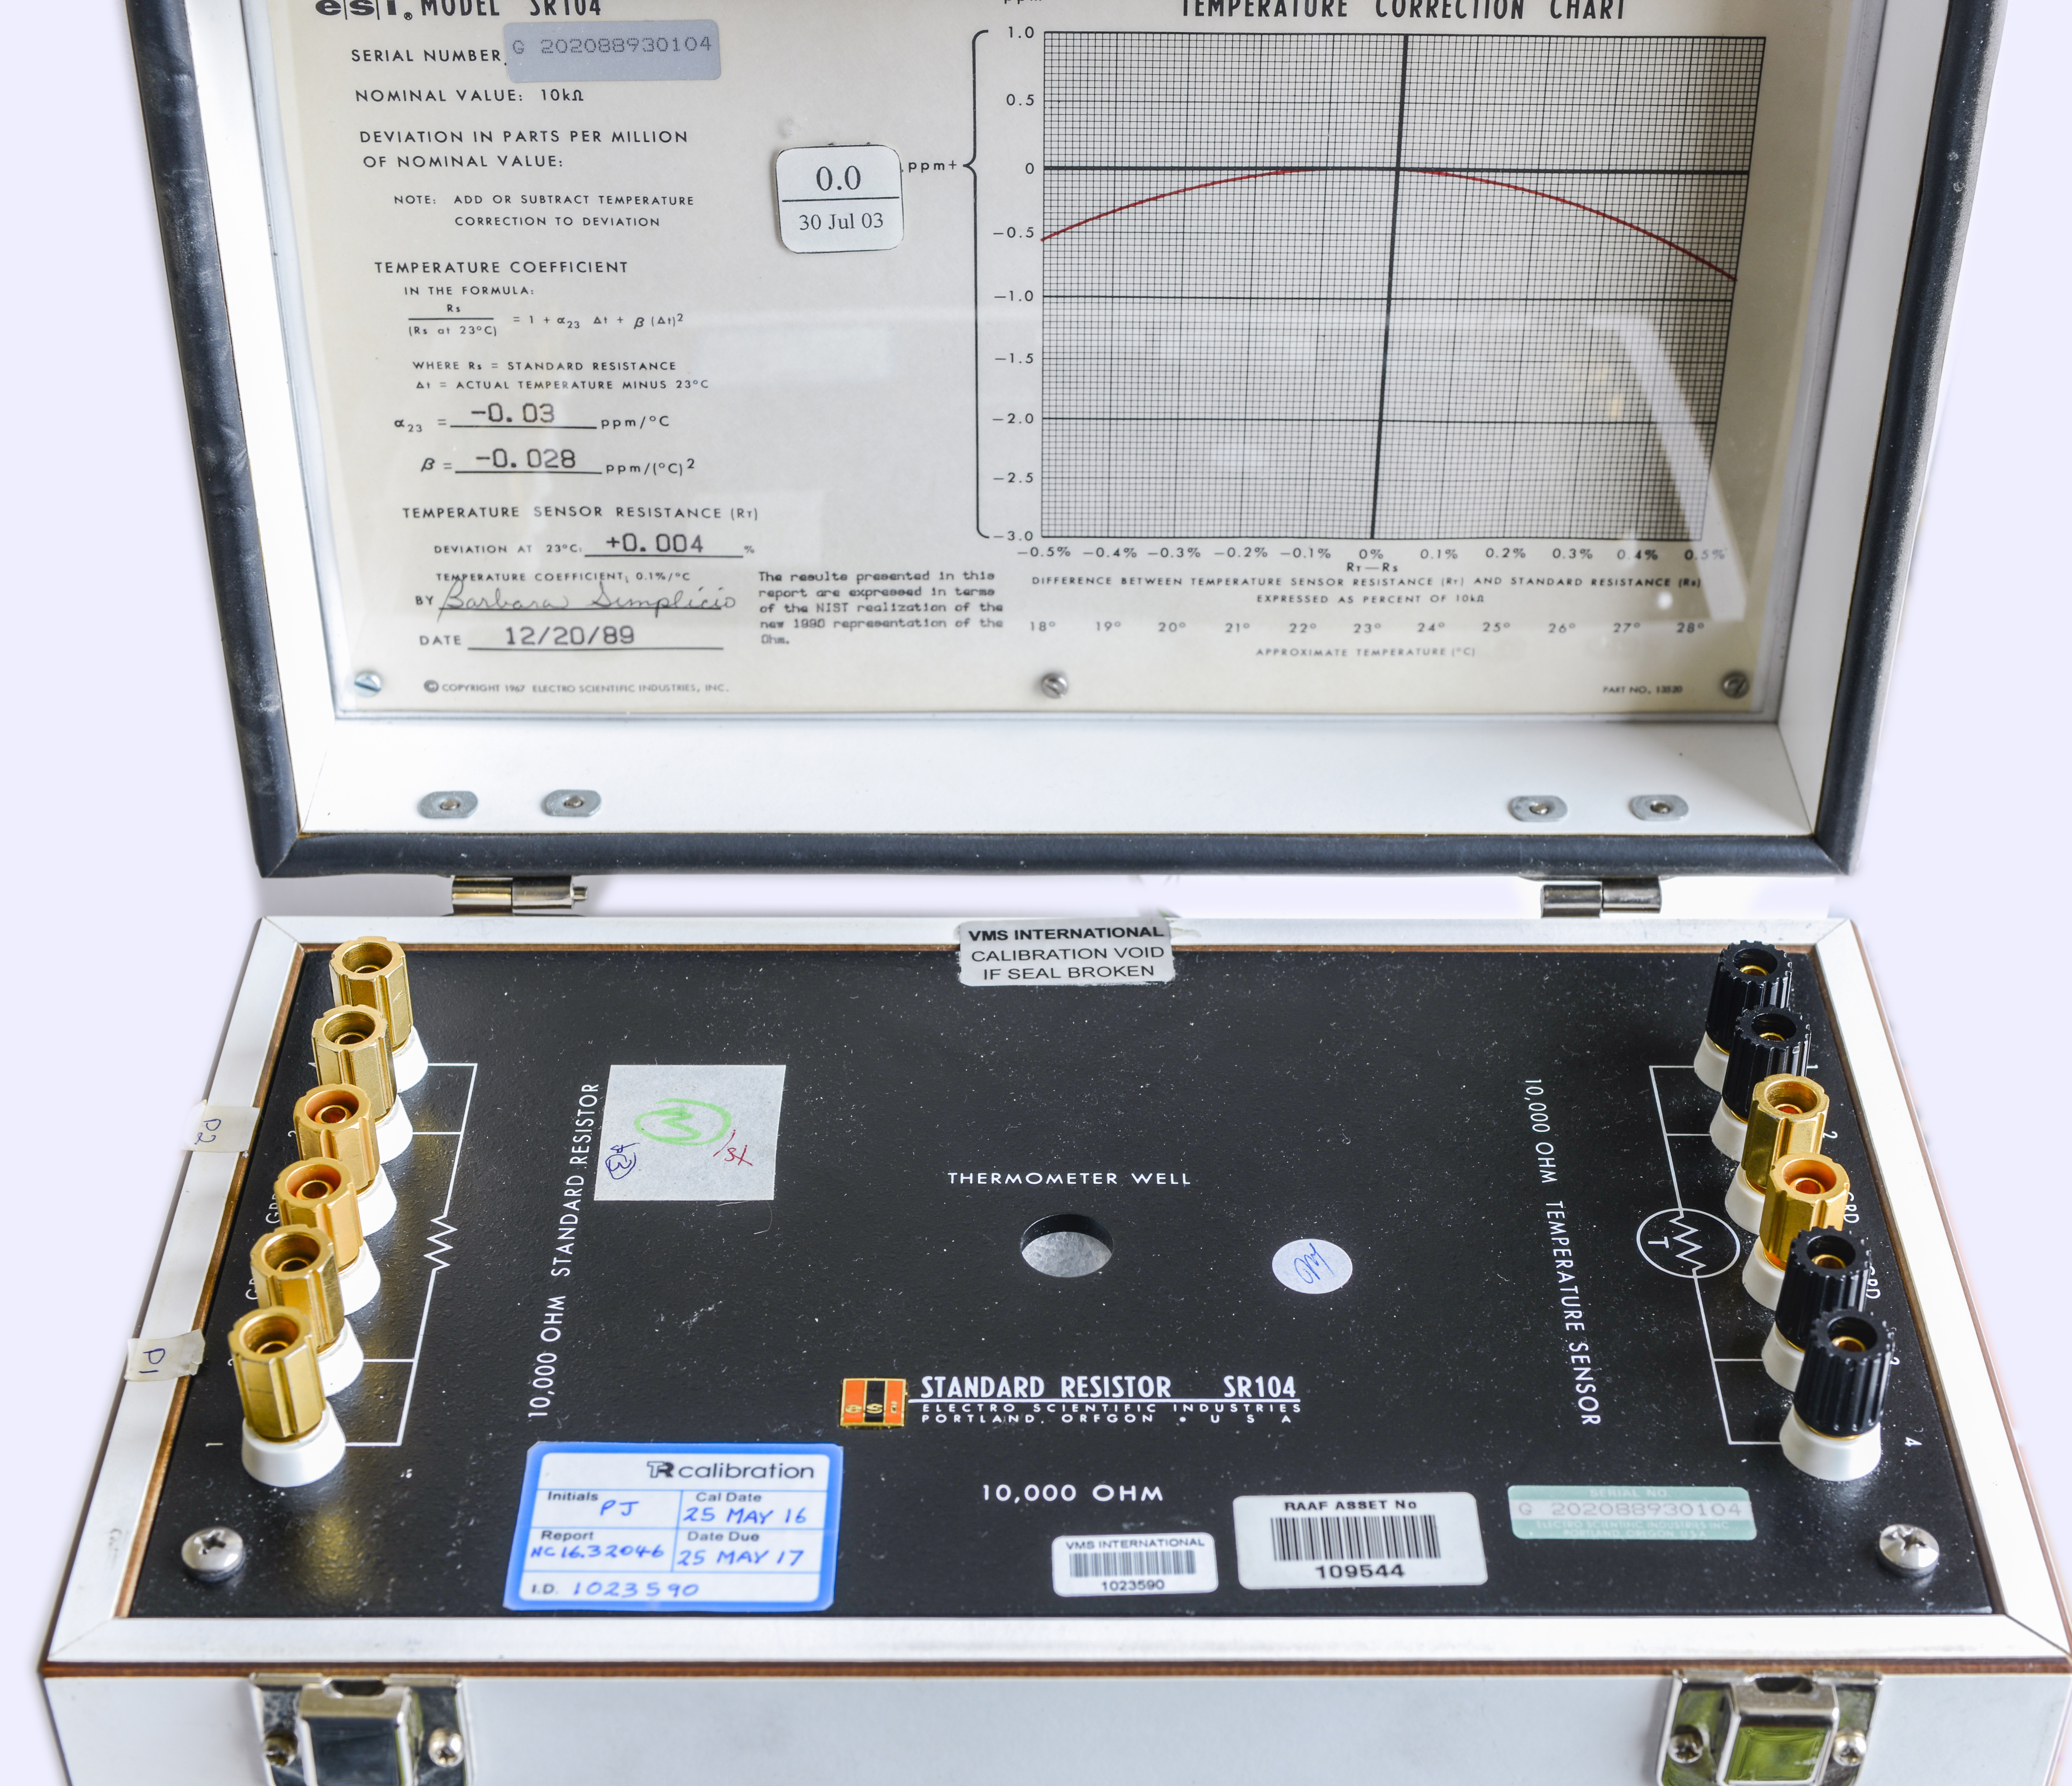
Image 4: ESI SR104 lid open. Lot of RAAF stickers and TR calibration sticker from 25 May 2016.
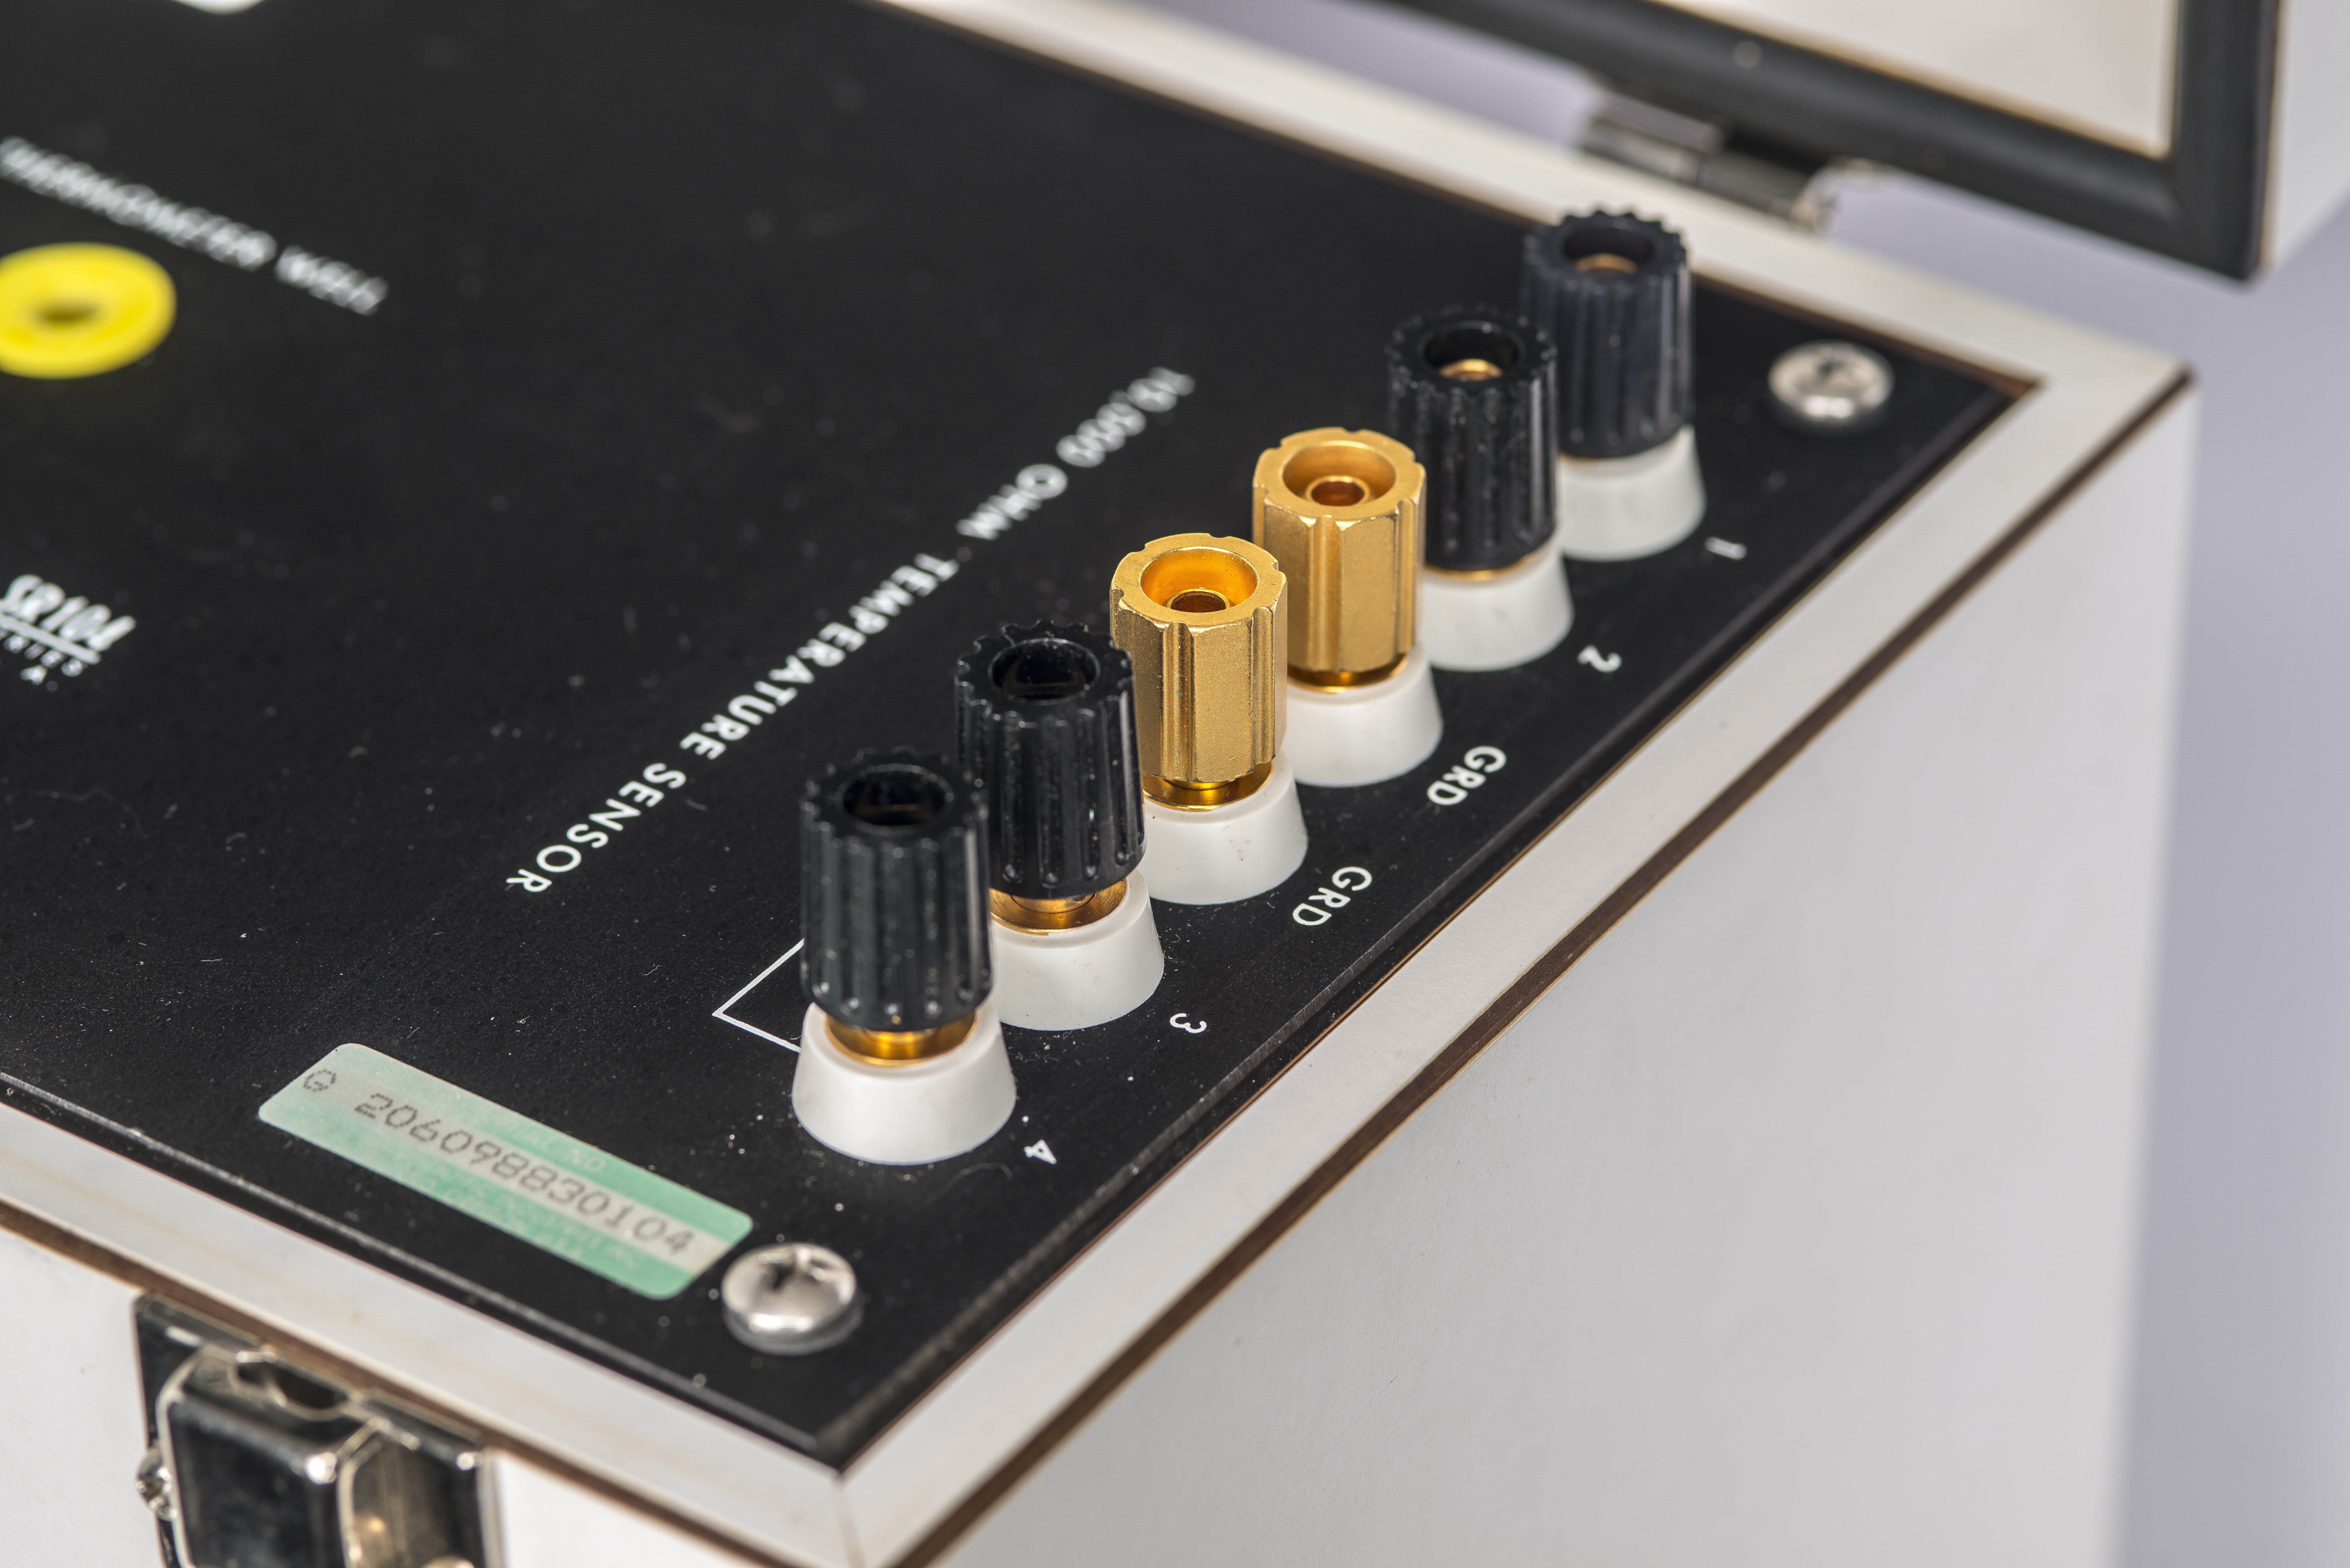
Open the removable lid, and we see earlier ESI metal faceplate with six 5-way binding post terminals for each standard resistor and precision RTD temperature sensor. The temperature sensor is mounted in the same oil-filled can as the special Evanohm wirewound standard resistor, and thus is at the same temperature.
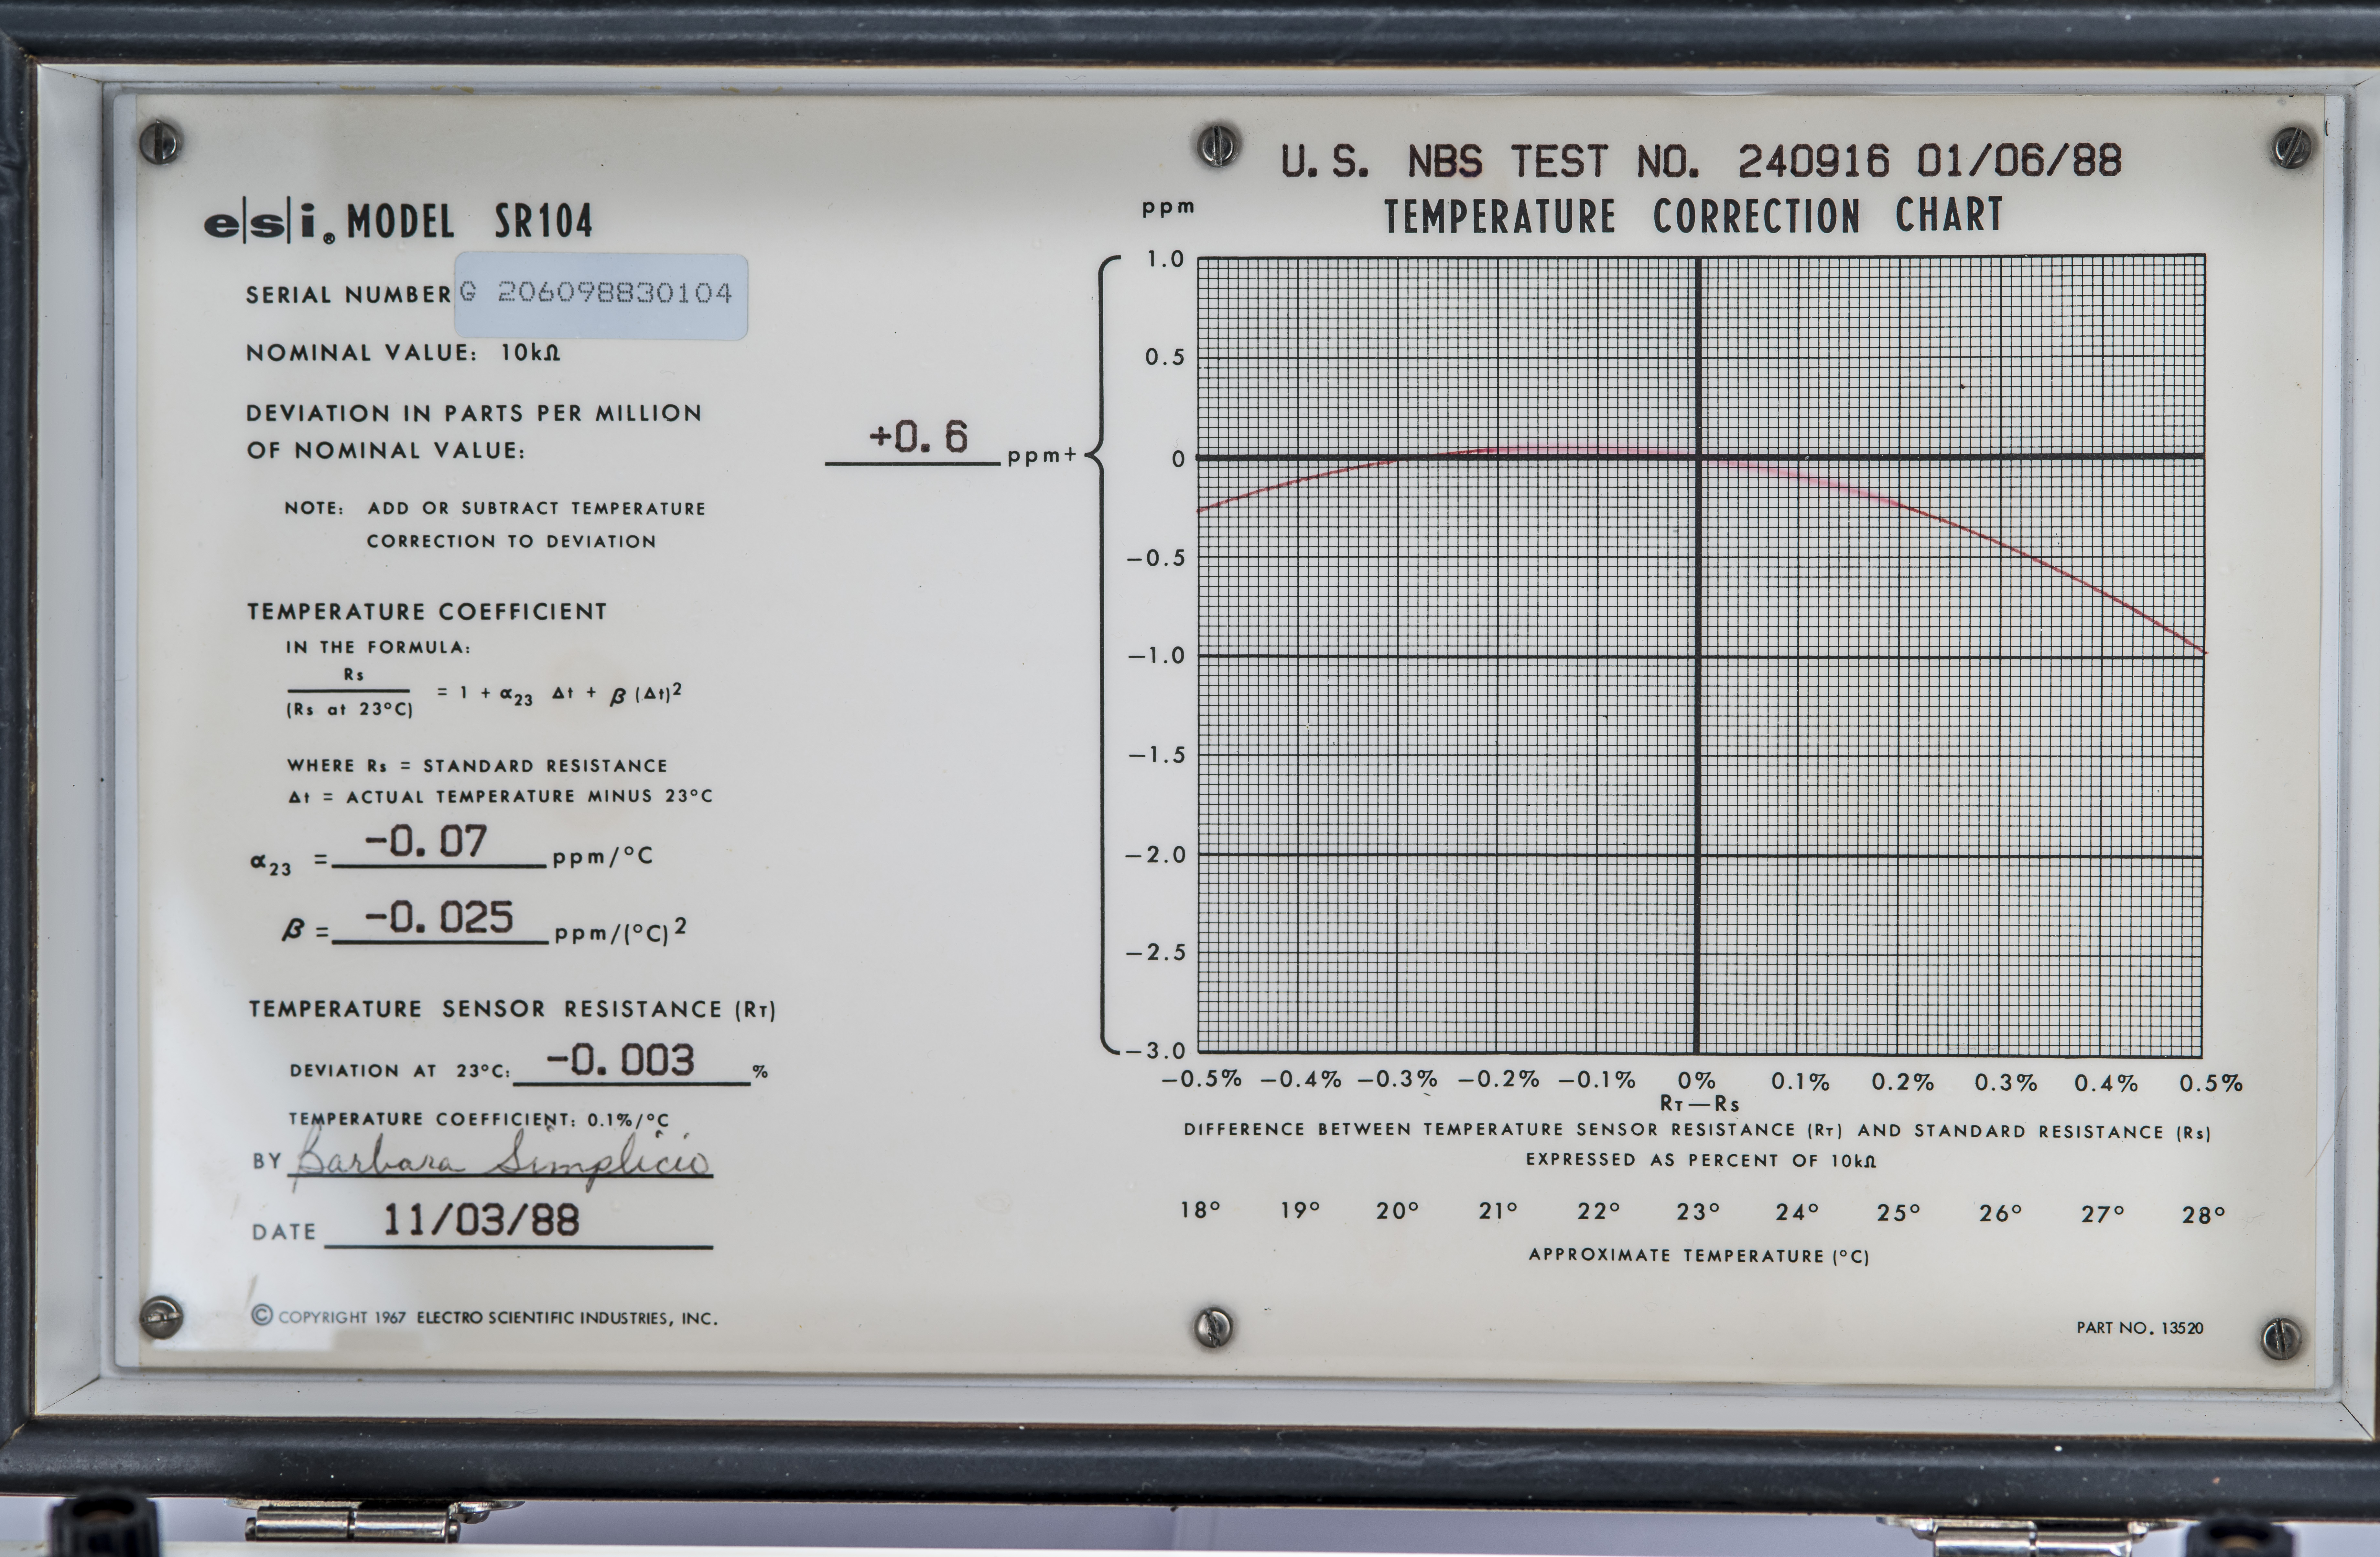
There is additional thermometer well in the center to allow external calibration of RTD and standard. Each SR104 has also calibration report with measured data right on the lid. There is a temperature correction chart for traditional metrology scale +18 °C to +28 °C, as well the calibration value and correction calculation formula.
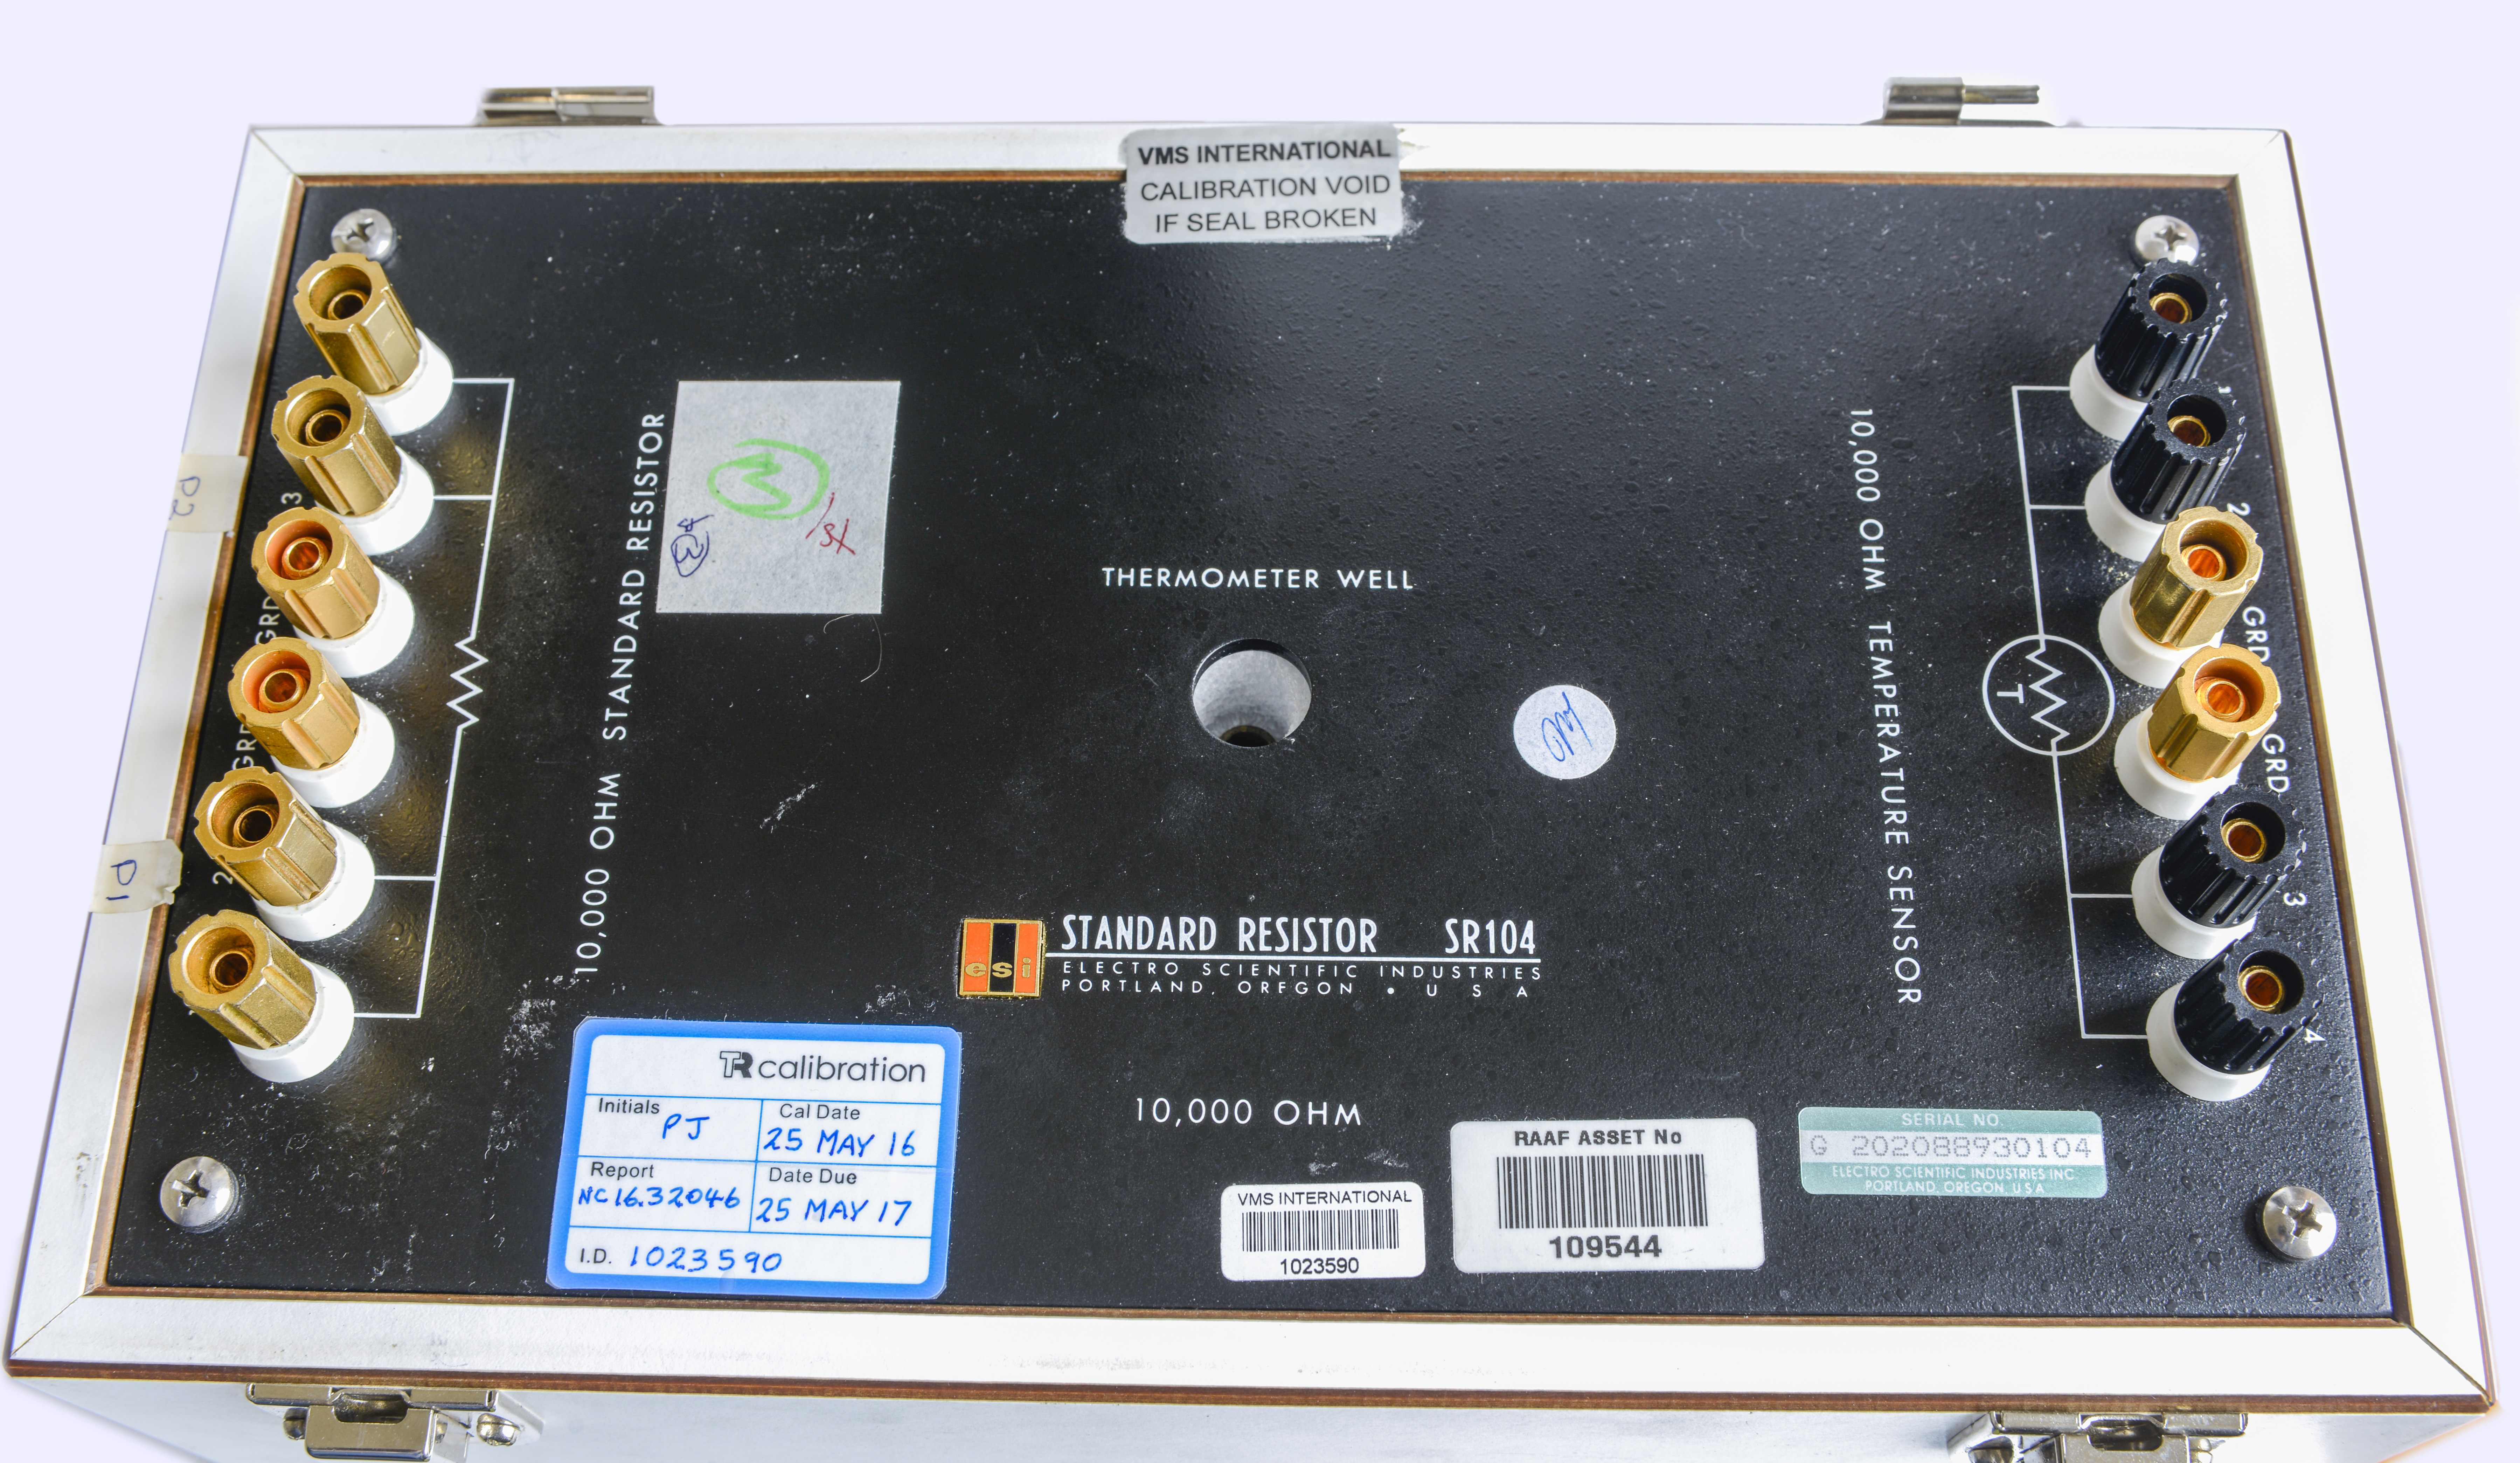

Image 5-6: Standard with lid removed. Rubber seal on the lid walls.
Lid have nice rubber gasket to keep inner volume sealed during the shipping. Overall build quality is very good, with attention to little detail like labels, wooden box finish. Whole thing feels quality, as expected for the money.
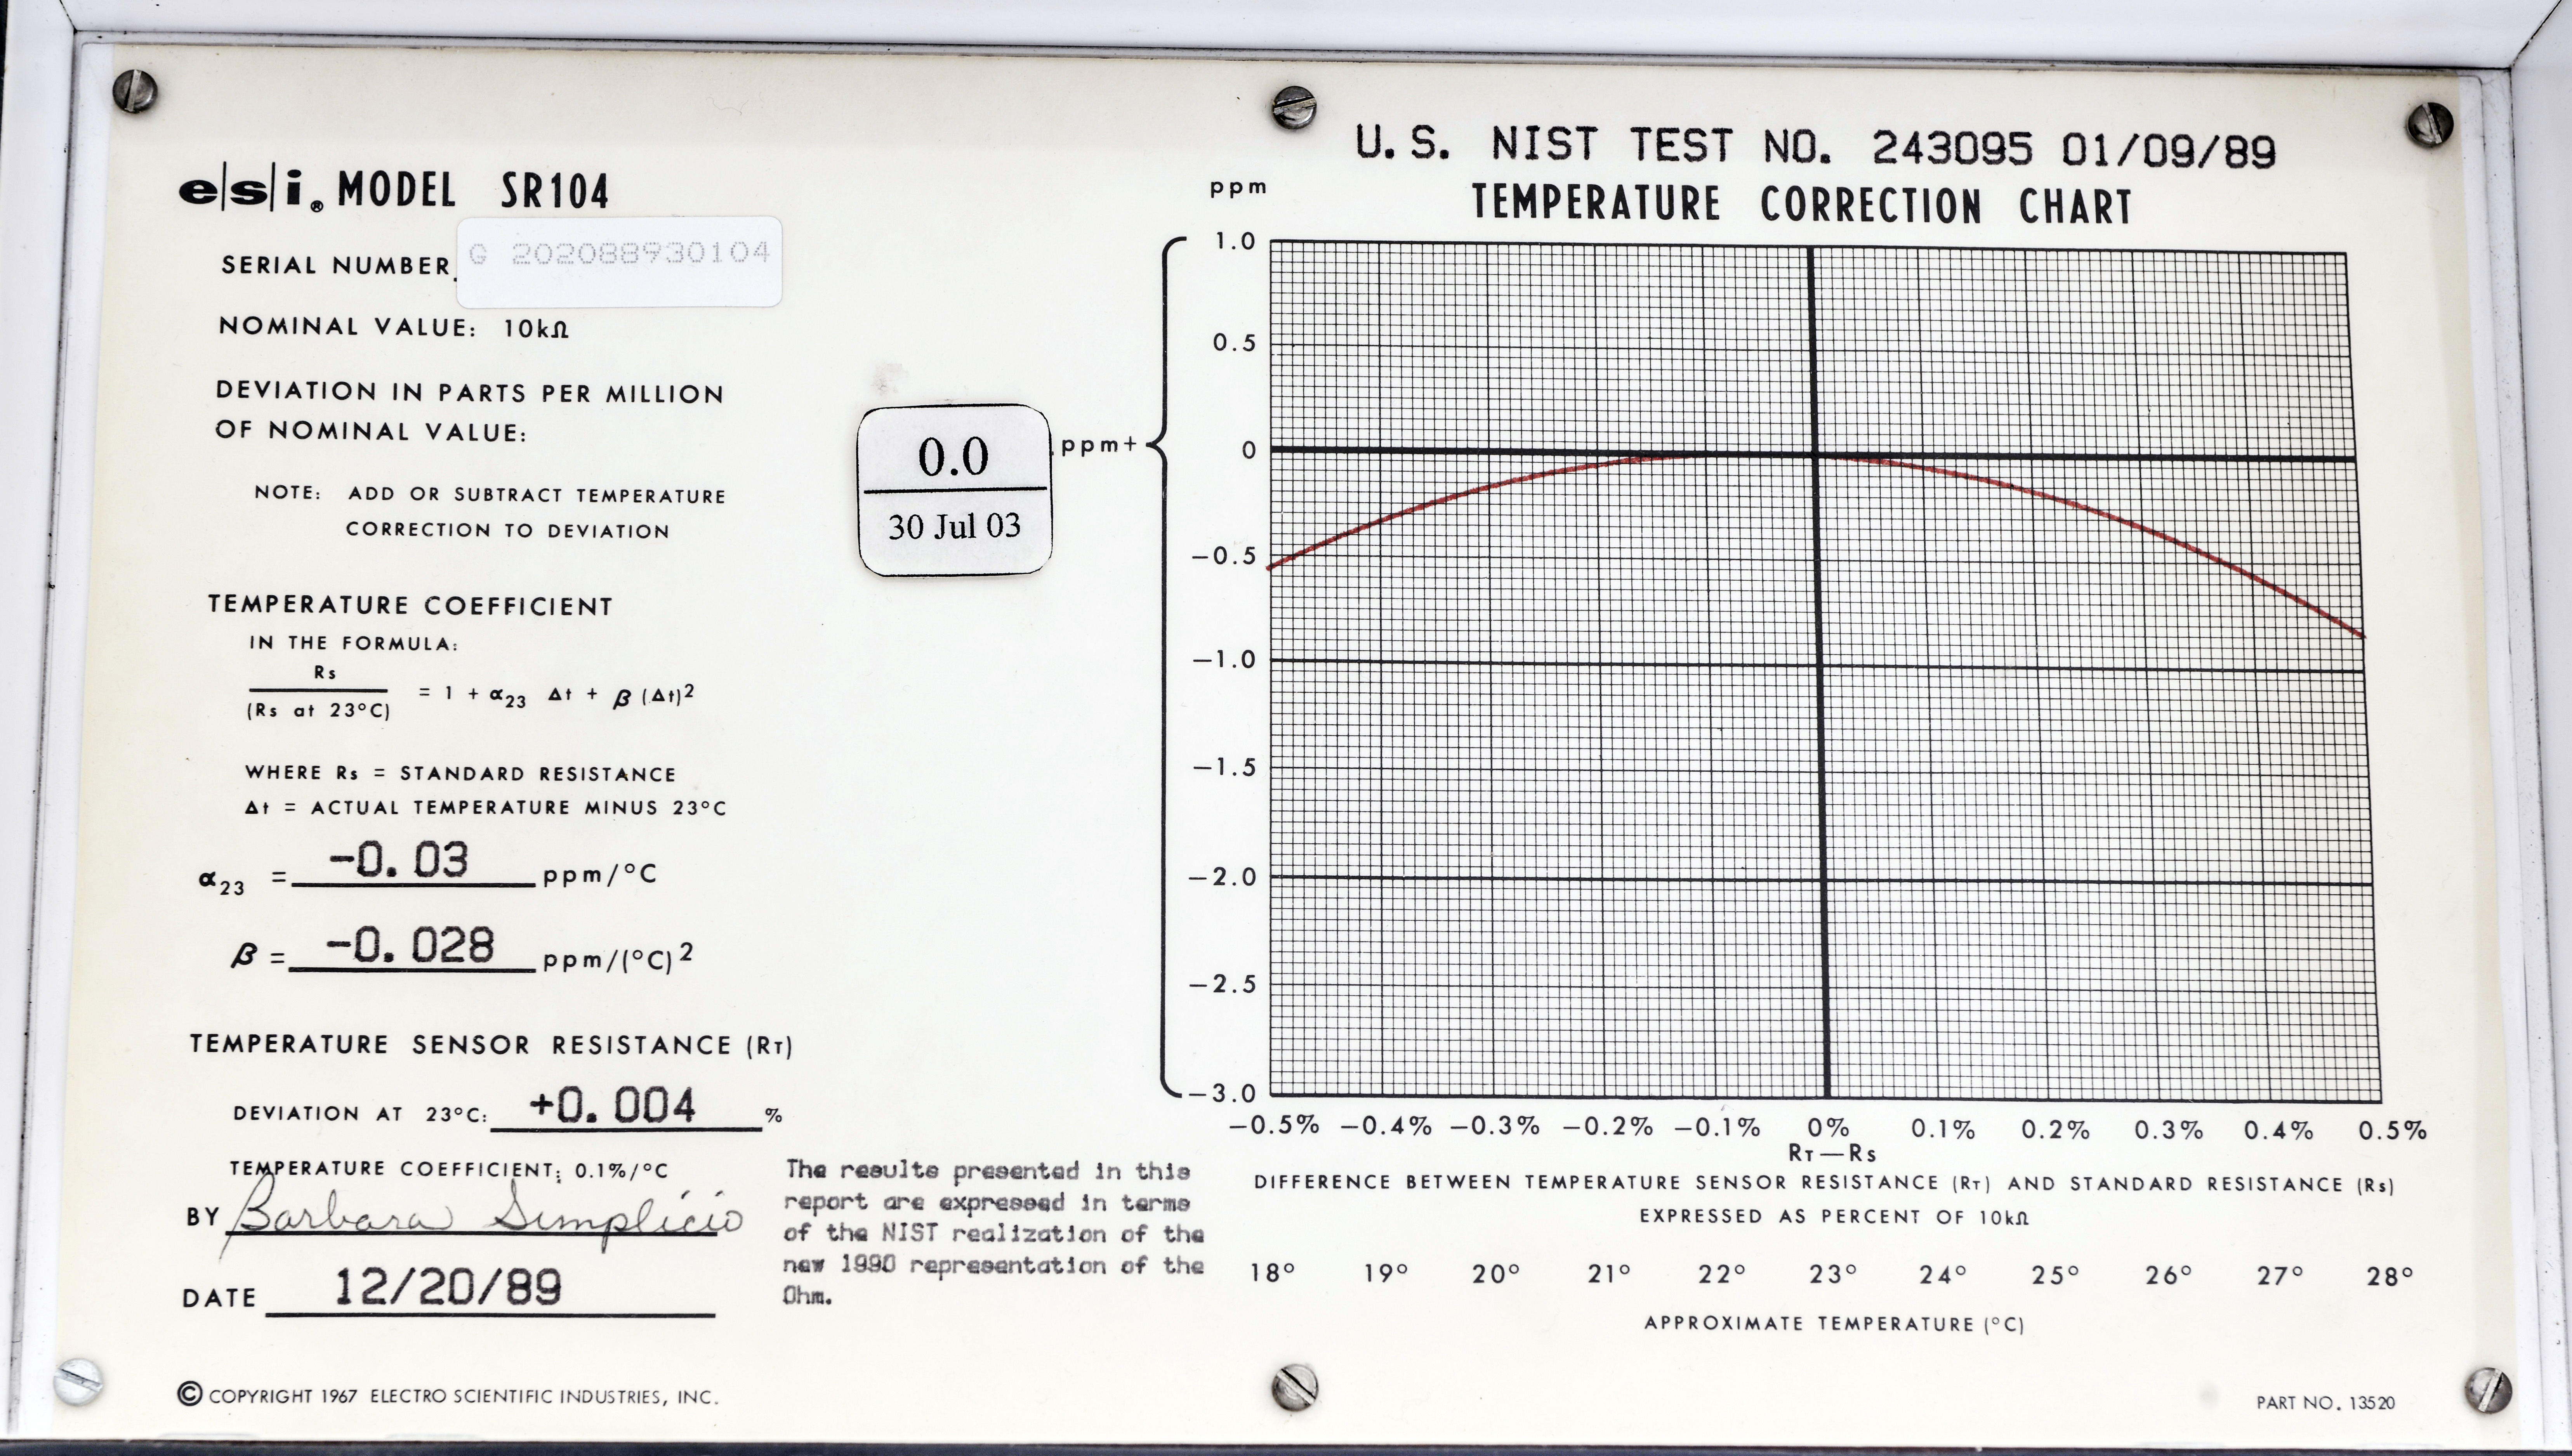
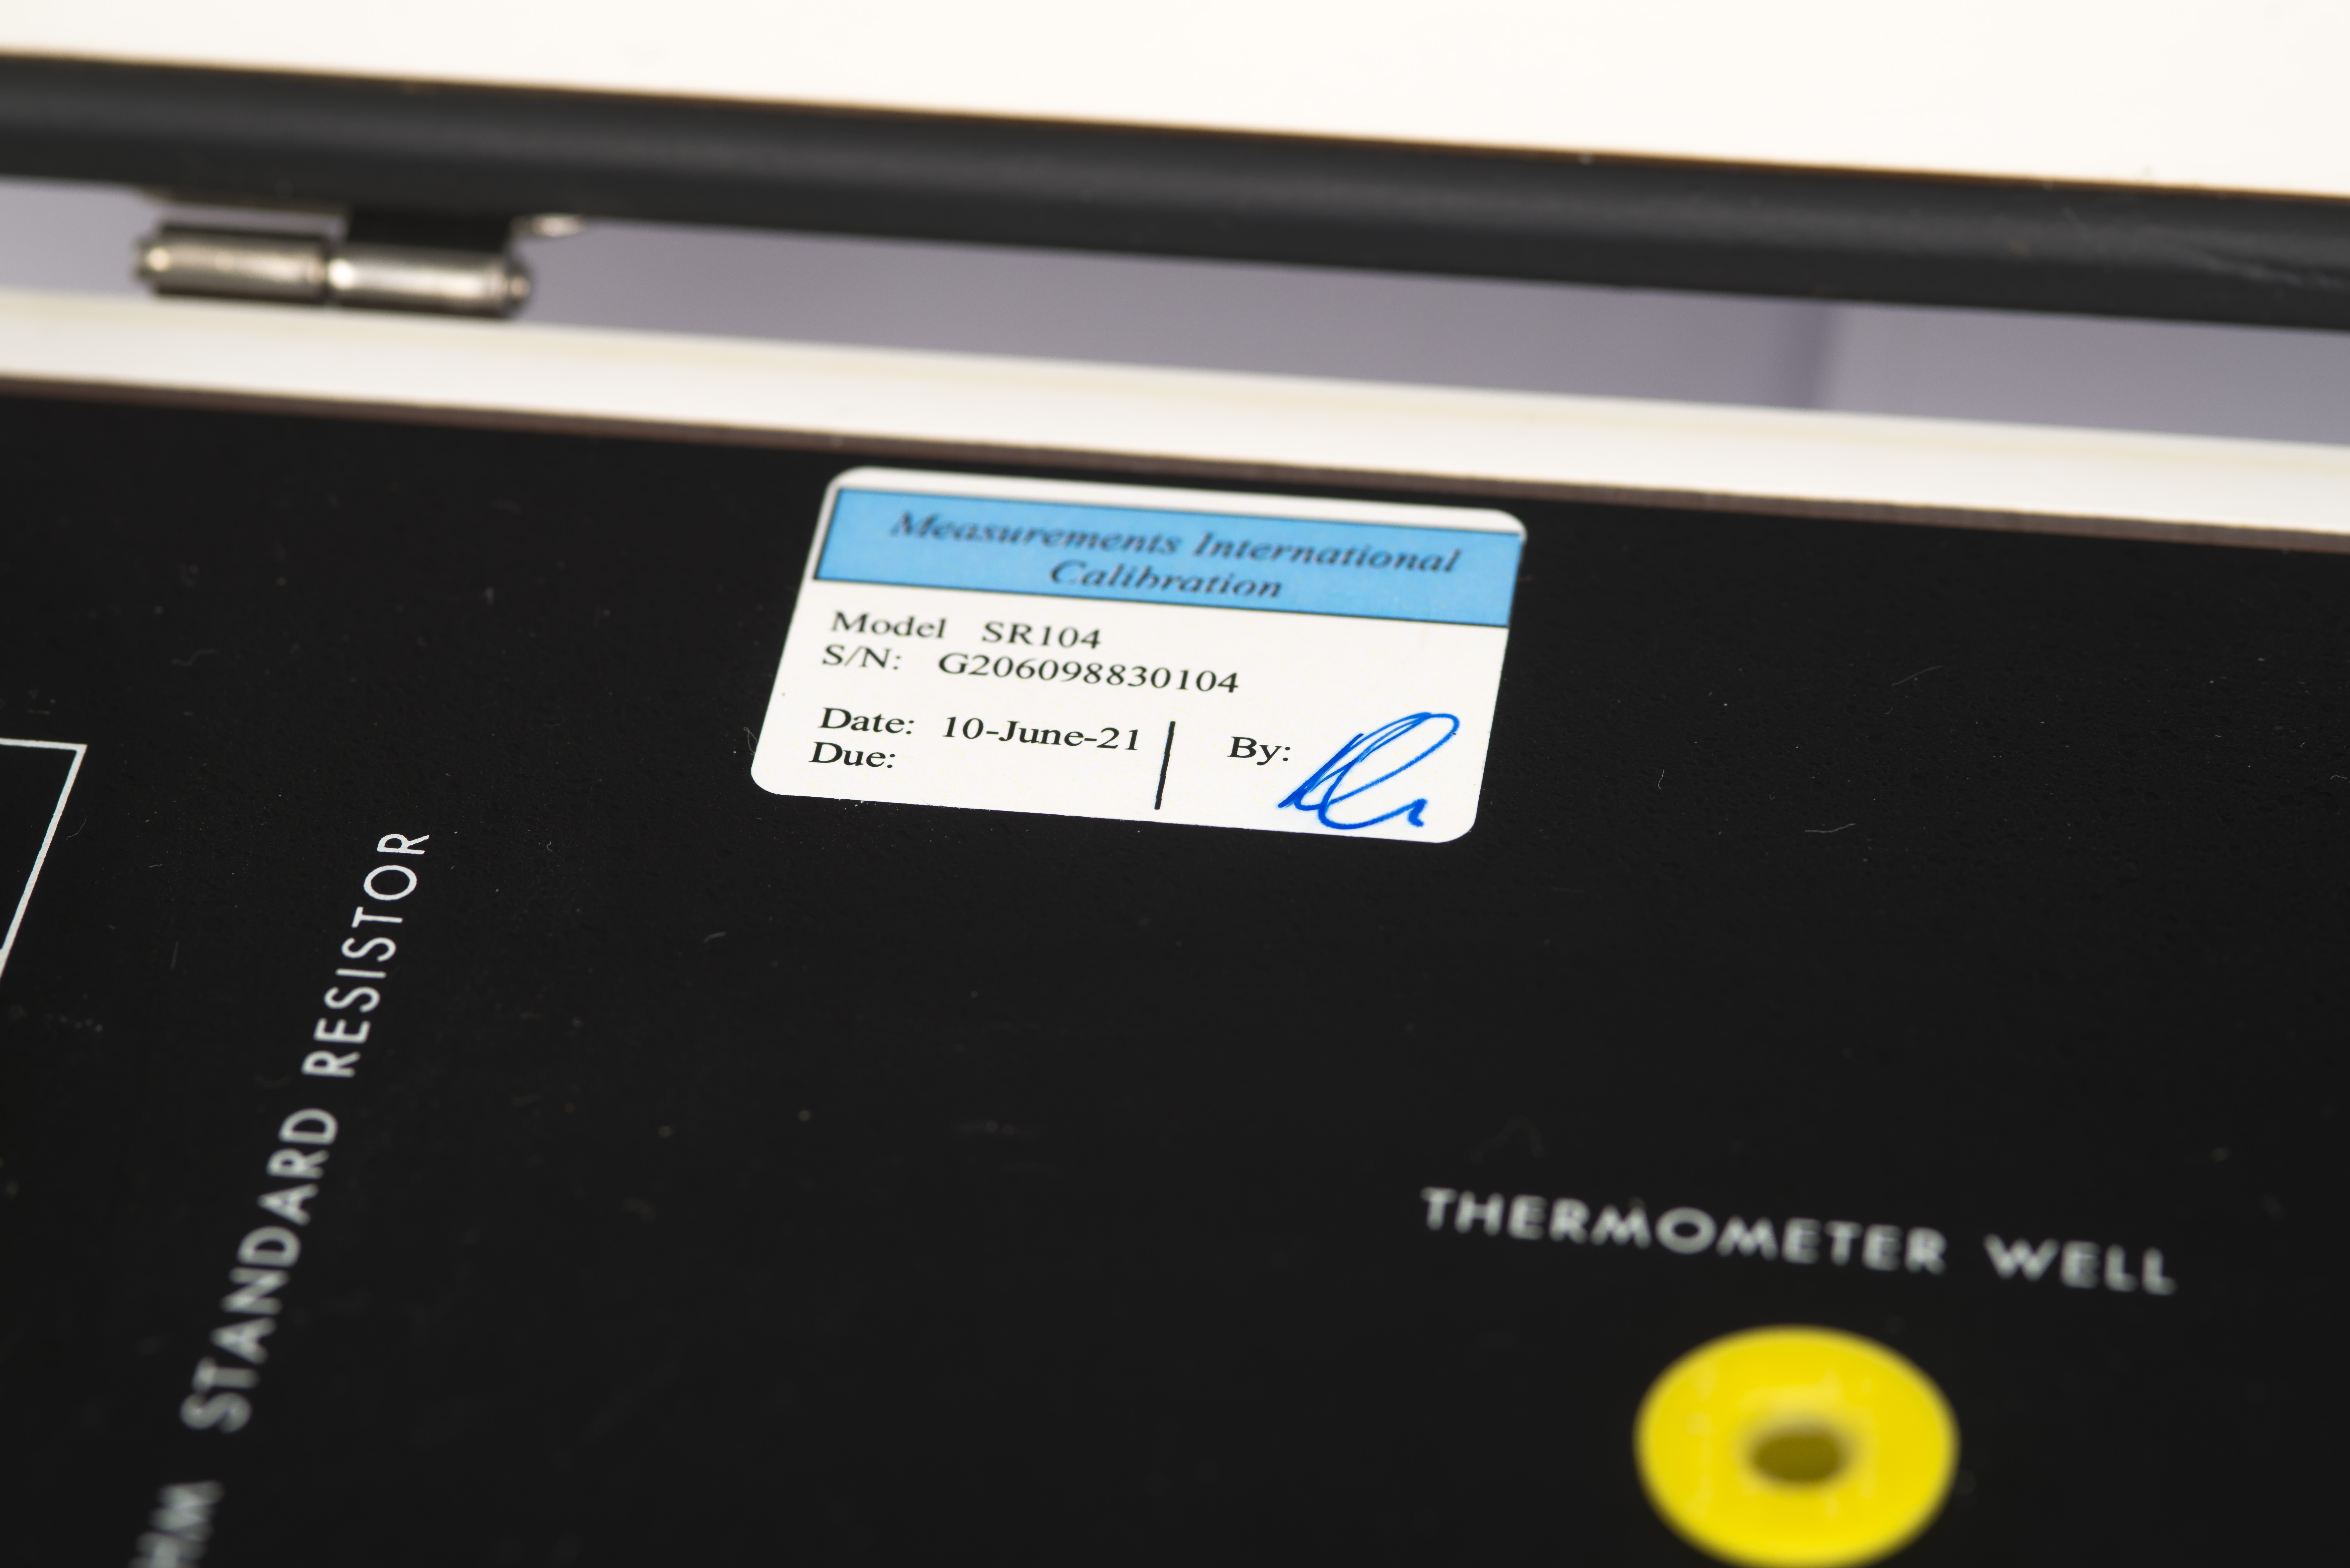
Image 7: ESI SR104 characterization label on the lid.
Deviation of this particular sample on sticker is 0.0 ppm, while actual certificate report from May 2016 reported value as 10000.0011 Ω, but uncertainty of that reading is mere ±1.0 µΩ/Ω due to use Fluke 8508A-001 and other ESI SR104 as standard. We can only tell that it’s very close to labelled value, IF resistor stayed stable after shipping and unknown since last calibration.
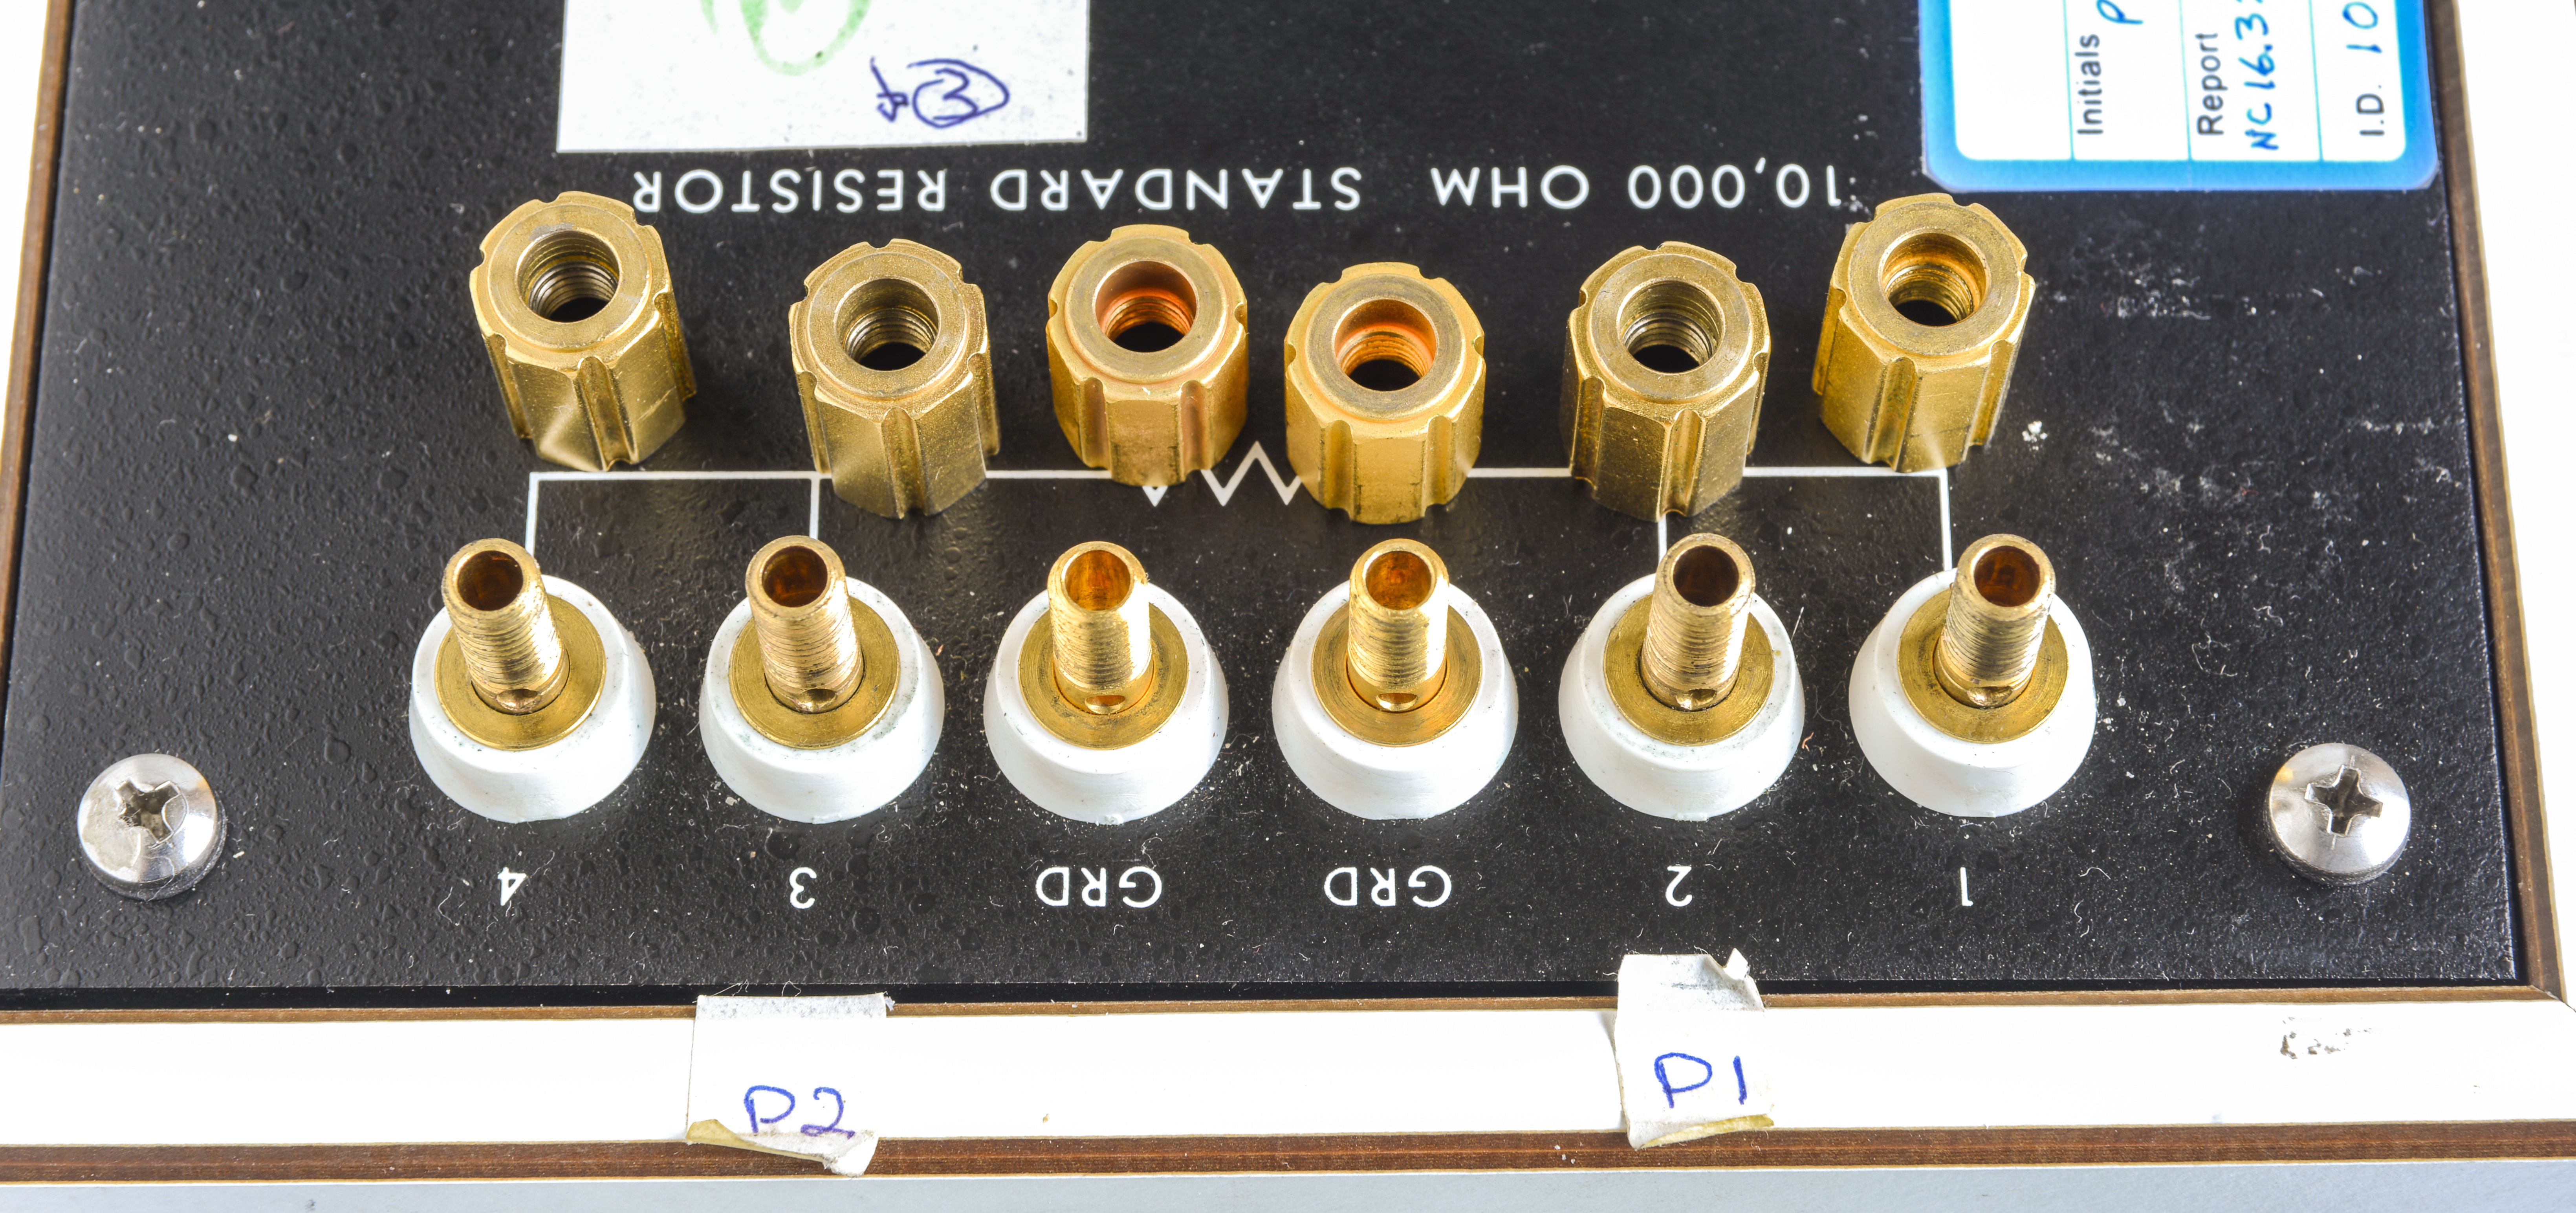
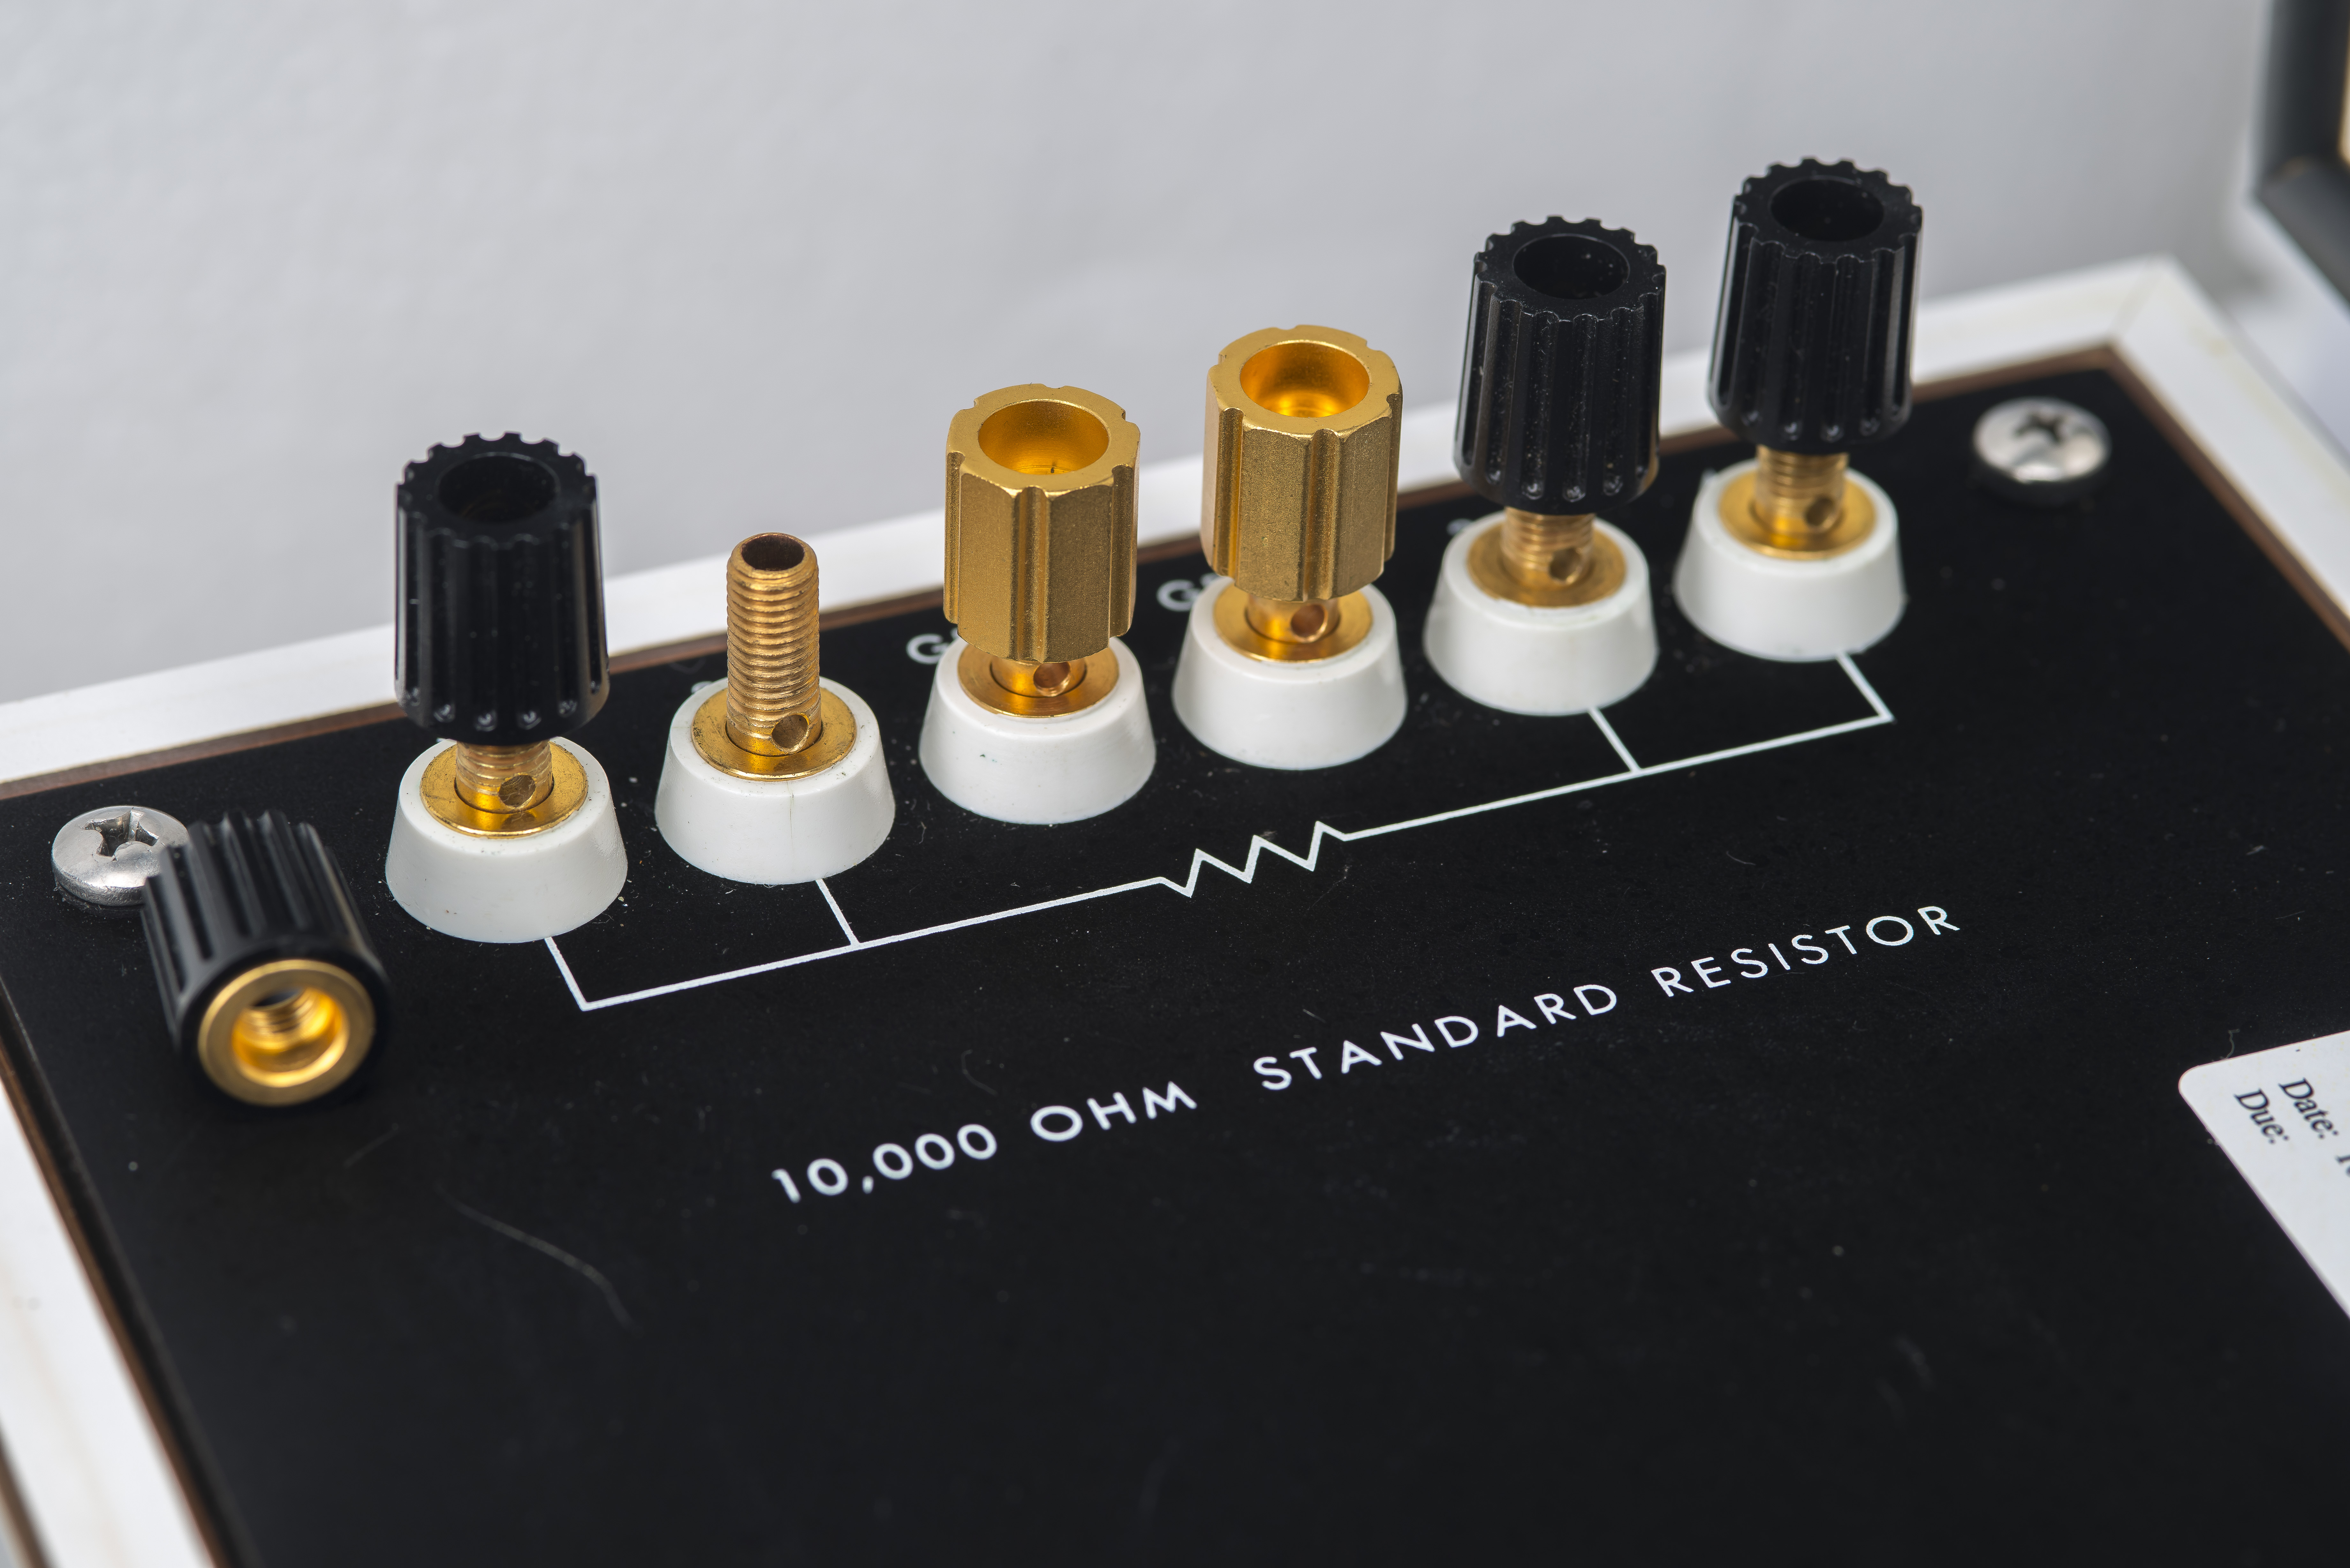
Image 8: 5-way binding gold-plated tellurium-copper posts and metal nuts.
This resistor also have metal nuts for standard binding posts, as original ESI plastic nuts are very fragile and easy to break.
But I know what you come here for, a teardown. Well, not much of that will happen this time, as it is too pricey to sacrifice for simple curiosity. So teardown is just limited to removing top plate to take inner build concept, and no further.
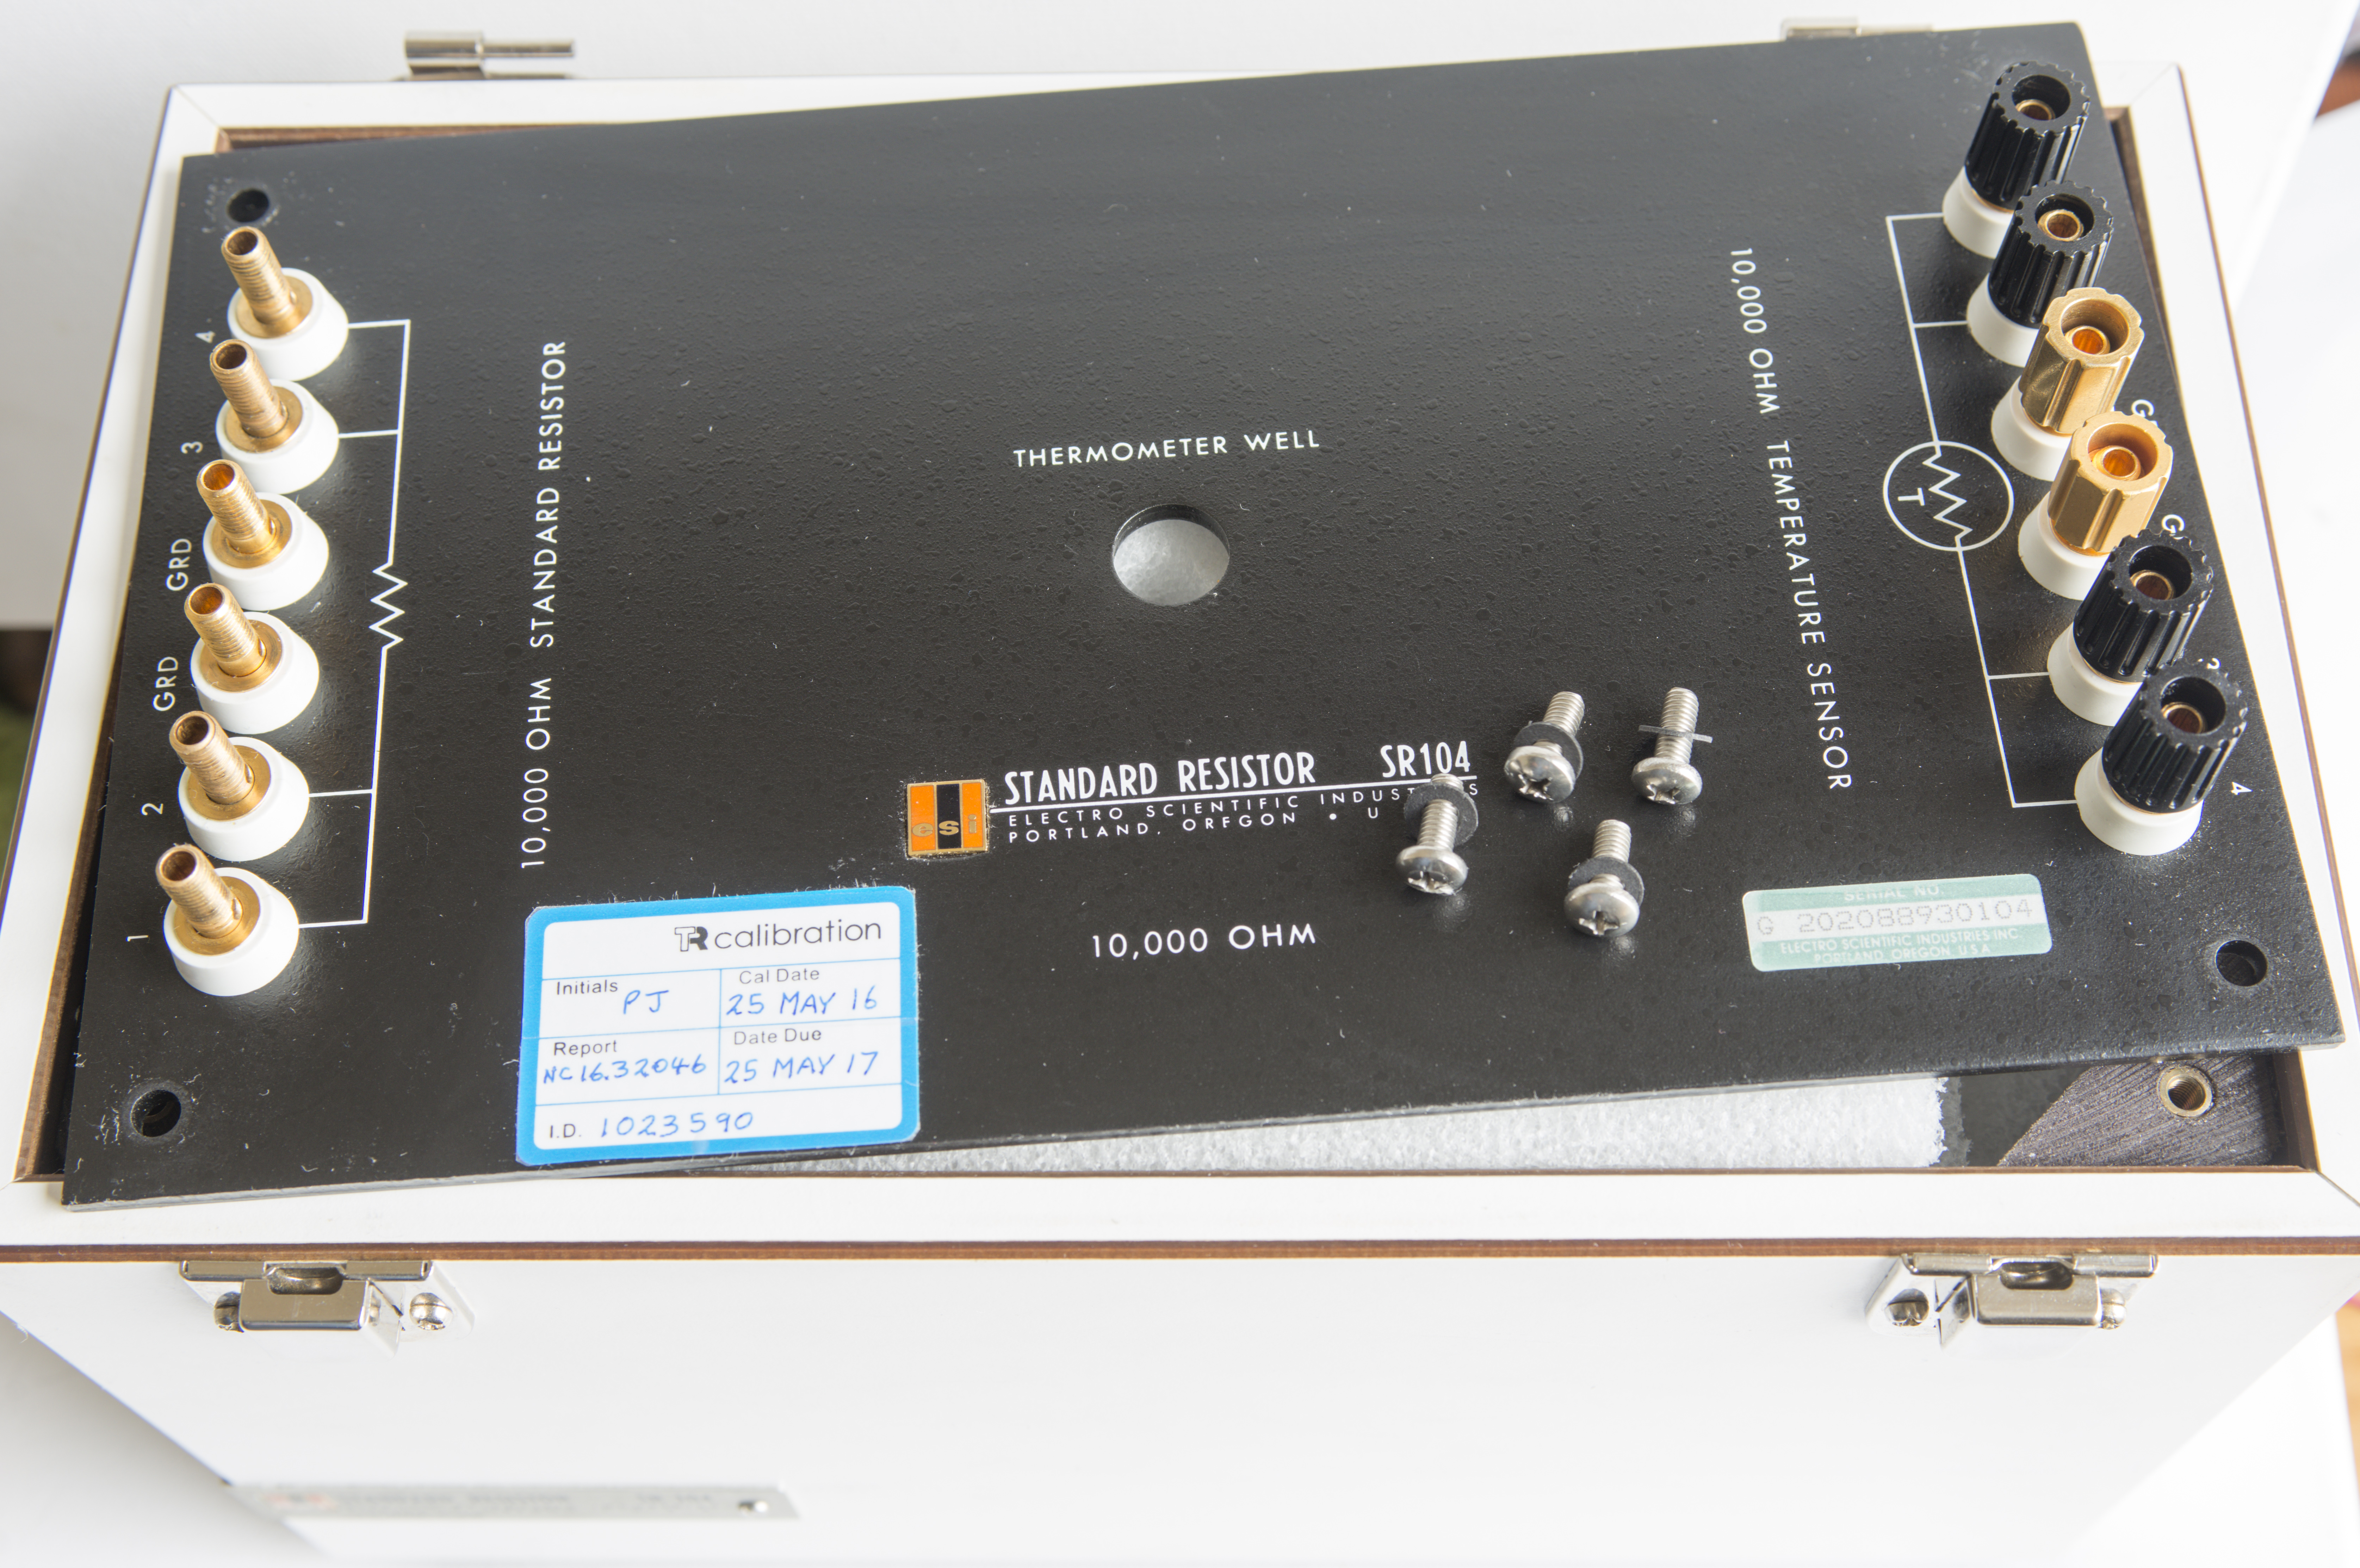

Image 9-10: Lifting top plate to peek inside the box.
Four screws removed, and rather thick steel plate just lifts off, revealing a view over thick hard white foam holding stainless steel oil tank with actual resistor and RTD elements, two of trimming resistors in epoxy package and four cables connecting components to binding posts.
According to IET SR104 manual, standard’s resistance changes less than ±0.1 µΩ/Ω with normal atmospheric pressure and humidity changes. Massive oil mass in steel tank also damper temperature change seen by resistance element by a lot. Manual specify thermal lagging time constant as 1 hour minimum. This also helps to avoid rapid stress to the precision wire in case of sudden ambient temperature change (practical example: move resistance standard from one building to another during frosty winter).
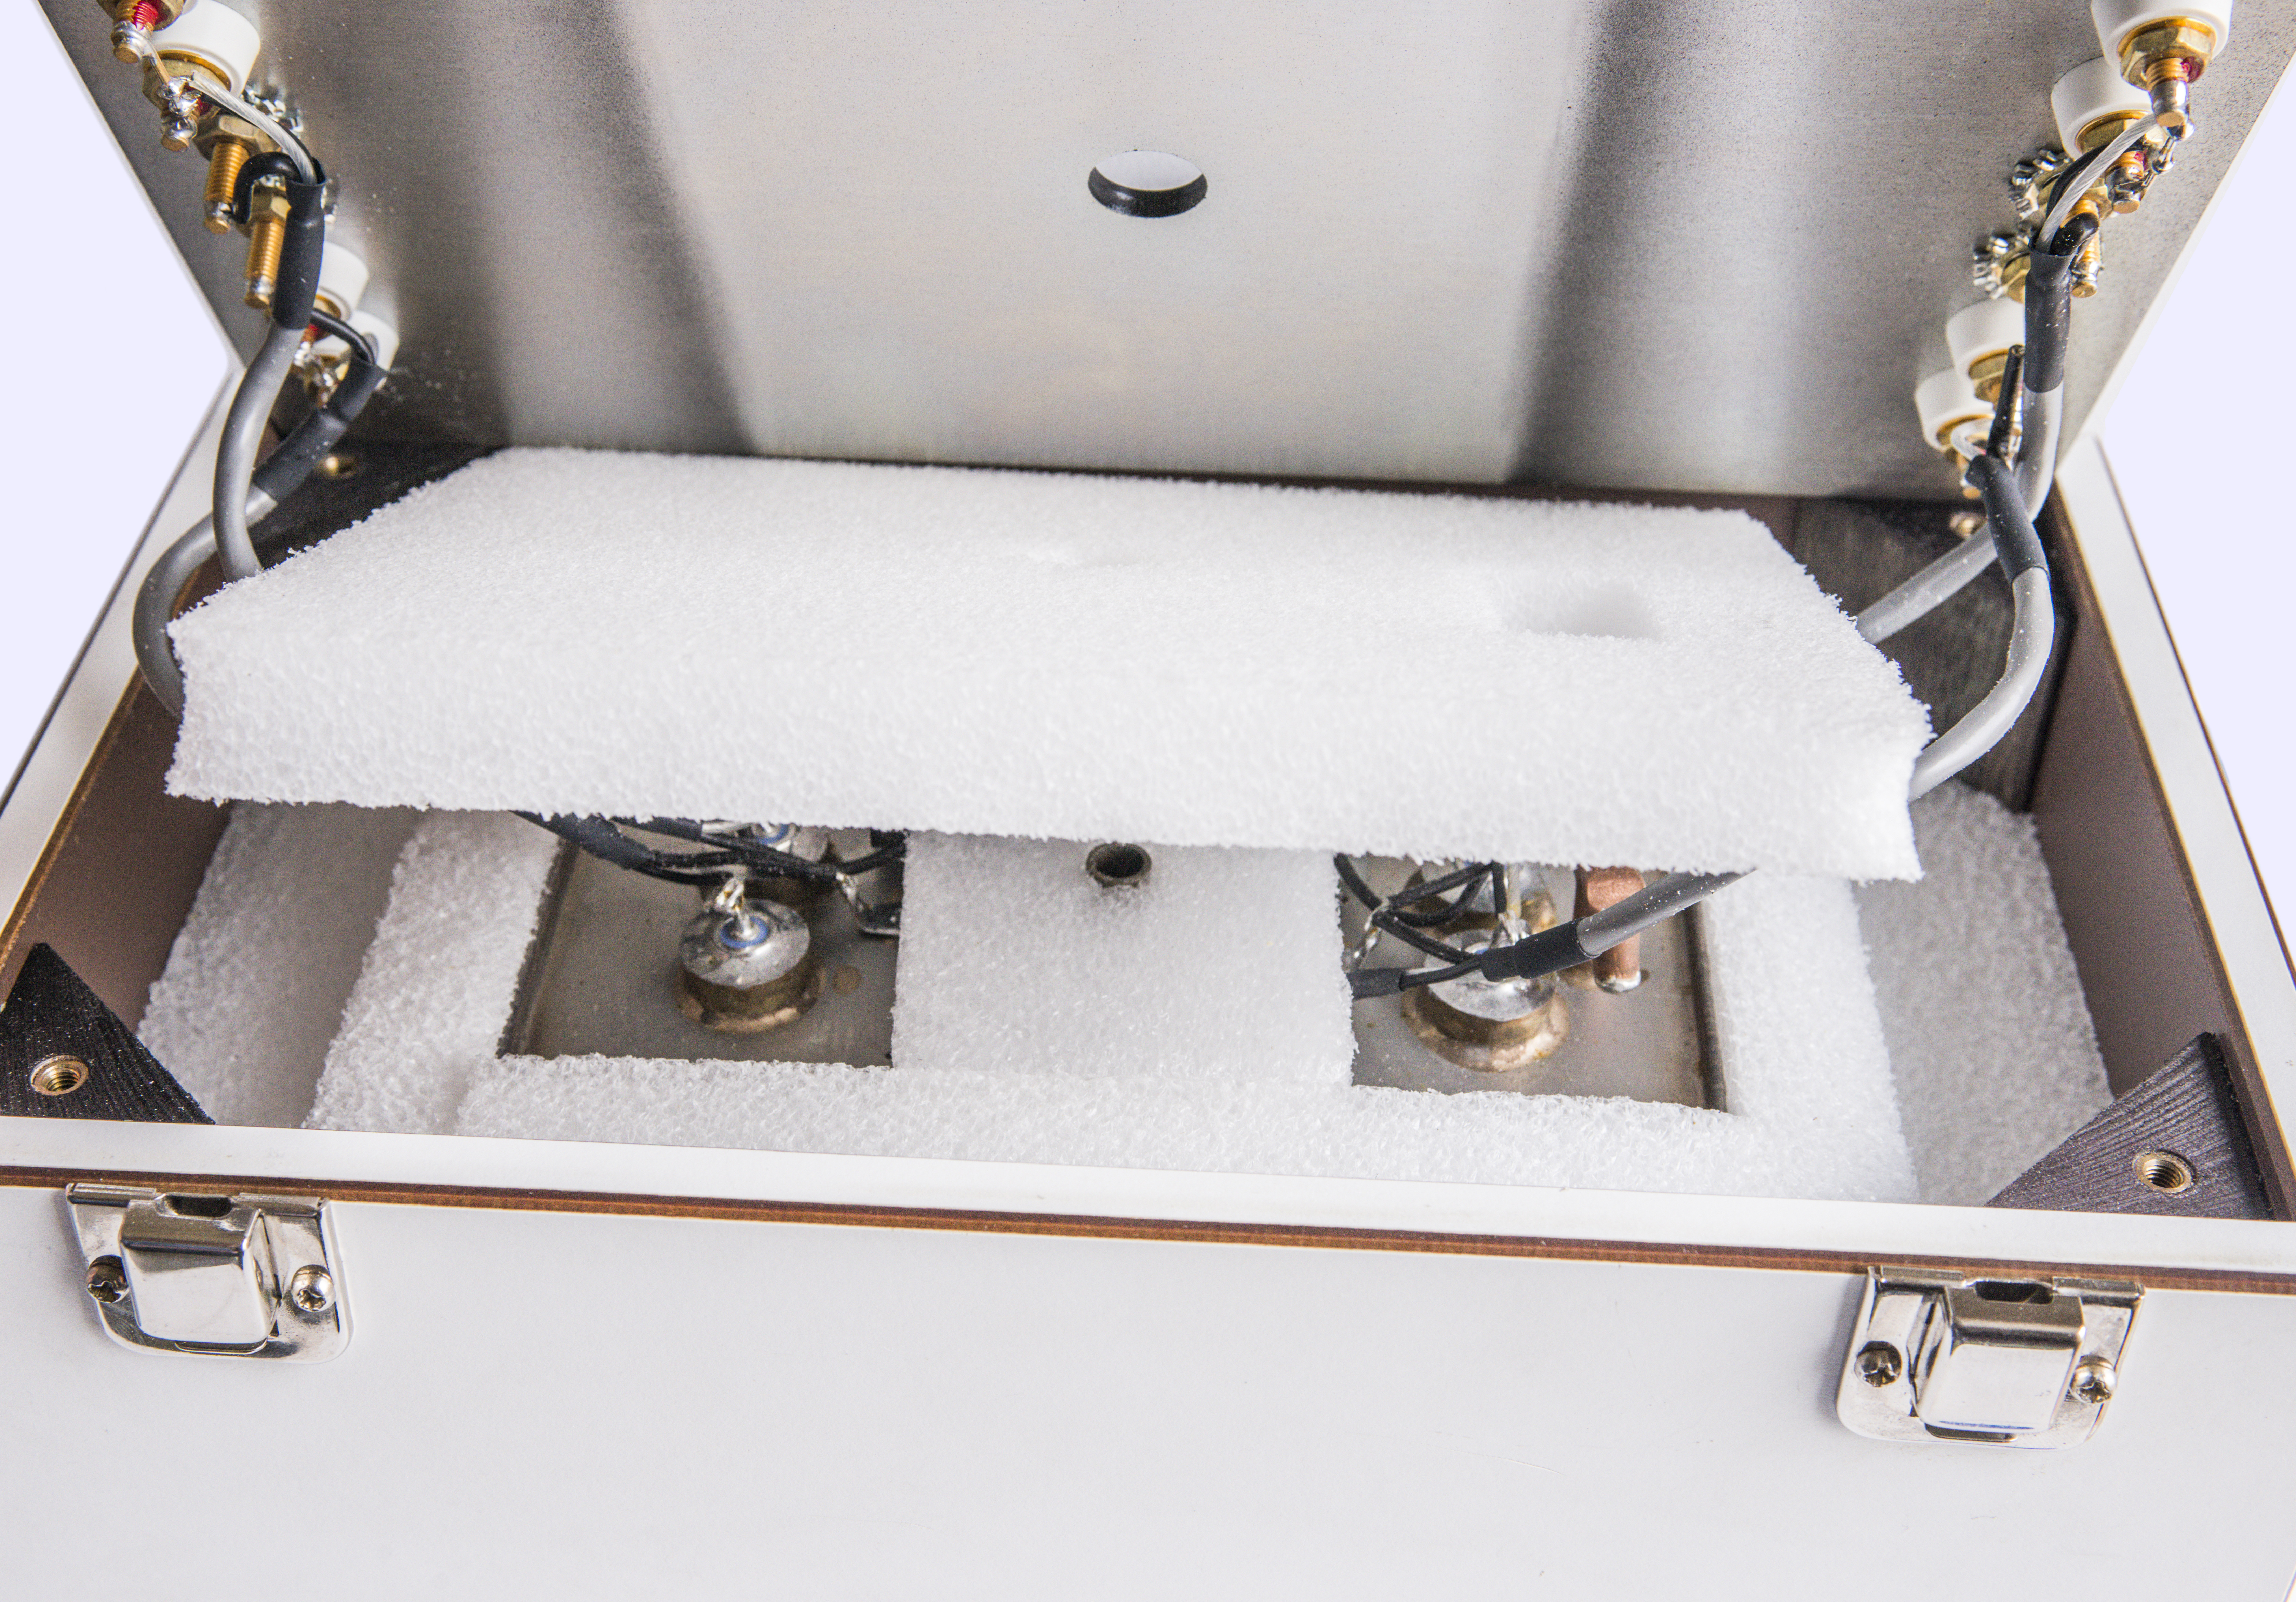

Image 11-12: Overview on internal connections to the oil tank.
Interesting to note shorts at both force and sense terminals at the binding posts. Usually resistance standards expected to have kelvin-type connection right to the resistive element to avoid resistance error from the connection cables and connectors, but it’s not the case here. So it is important to track and know exact current and connection configuration on which ESI SR104 was calibrated for best uncertainty.
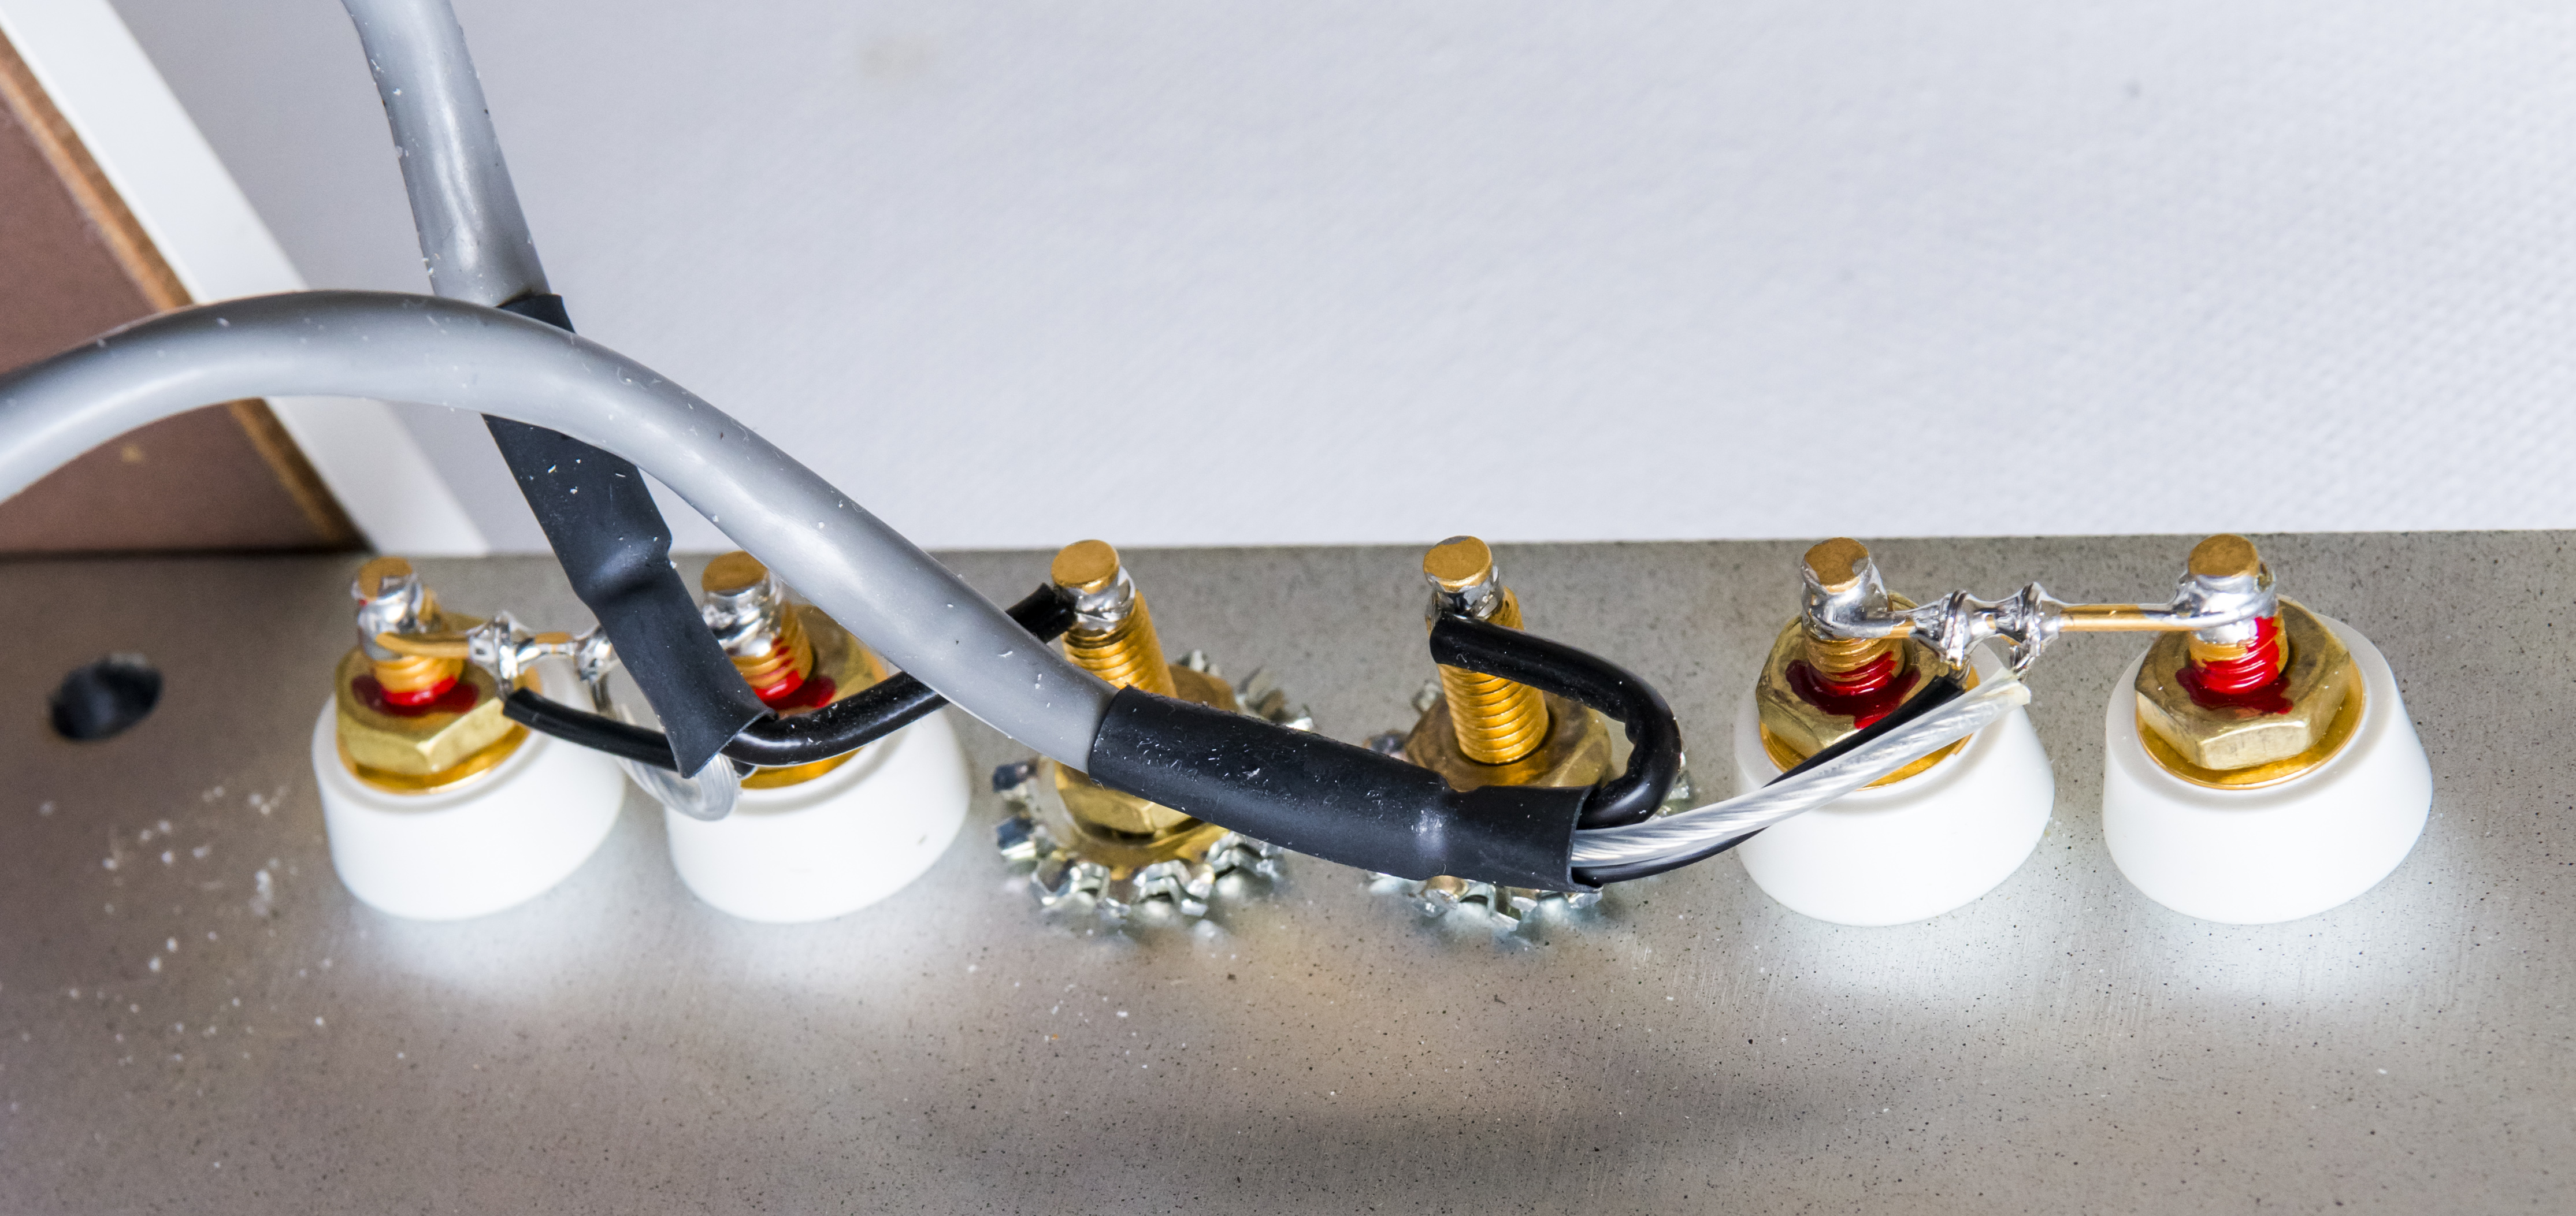
Image 13: Terminations on the binding posts.
Oil tank marked with hand written serial number 726014. Compensation resistors are 0.38 Ω in black epoxy package with gold-plated copper terminals for standard resistance element and 19 Ω for RTD element. RTD and standard resistor are trimmed to same resistance.
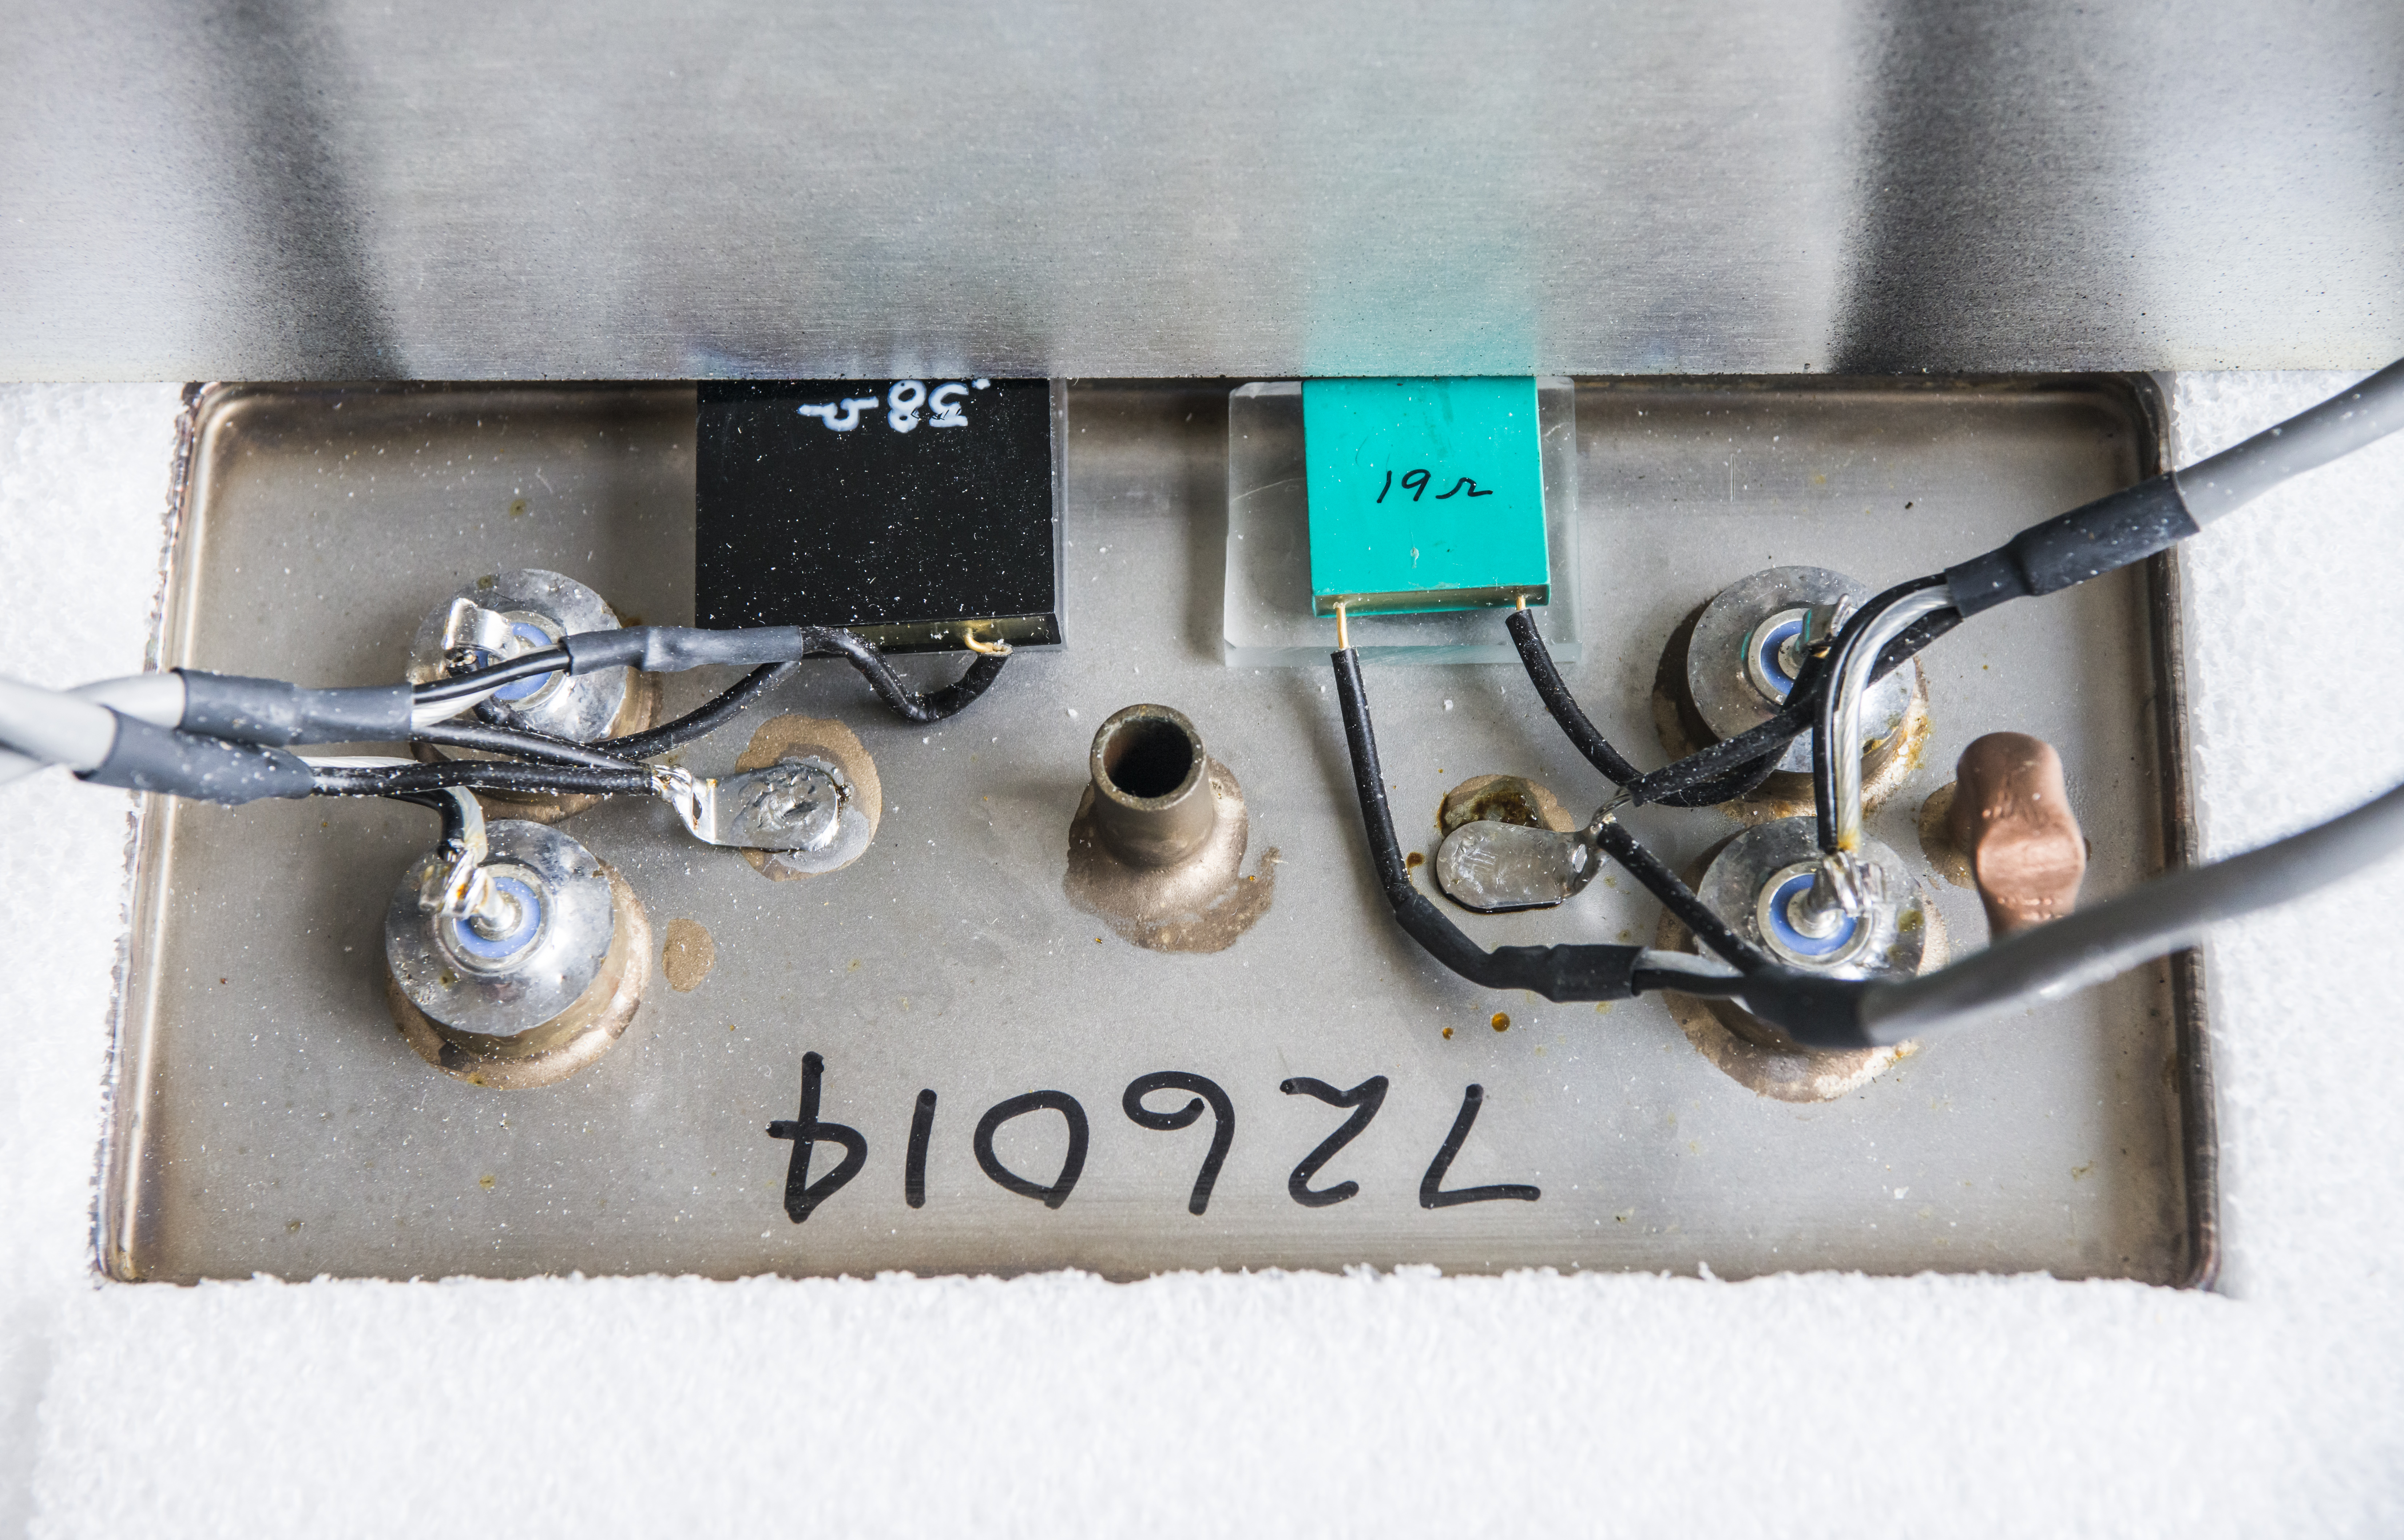
Image 14: Oil tank sealed connections and trim epoxy resistors.
Removing polycarbonate protective cover allows us to reveal original factory insert label and factory measurement deviation -1.1 µΩ/Ω from nominal.
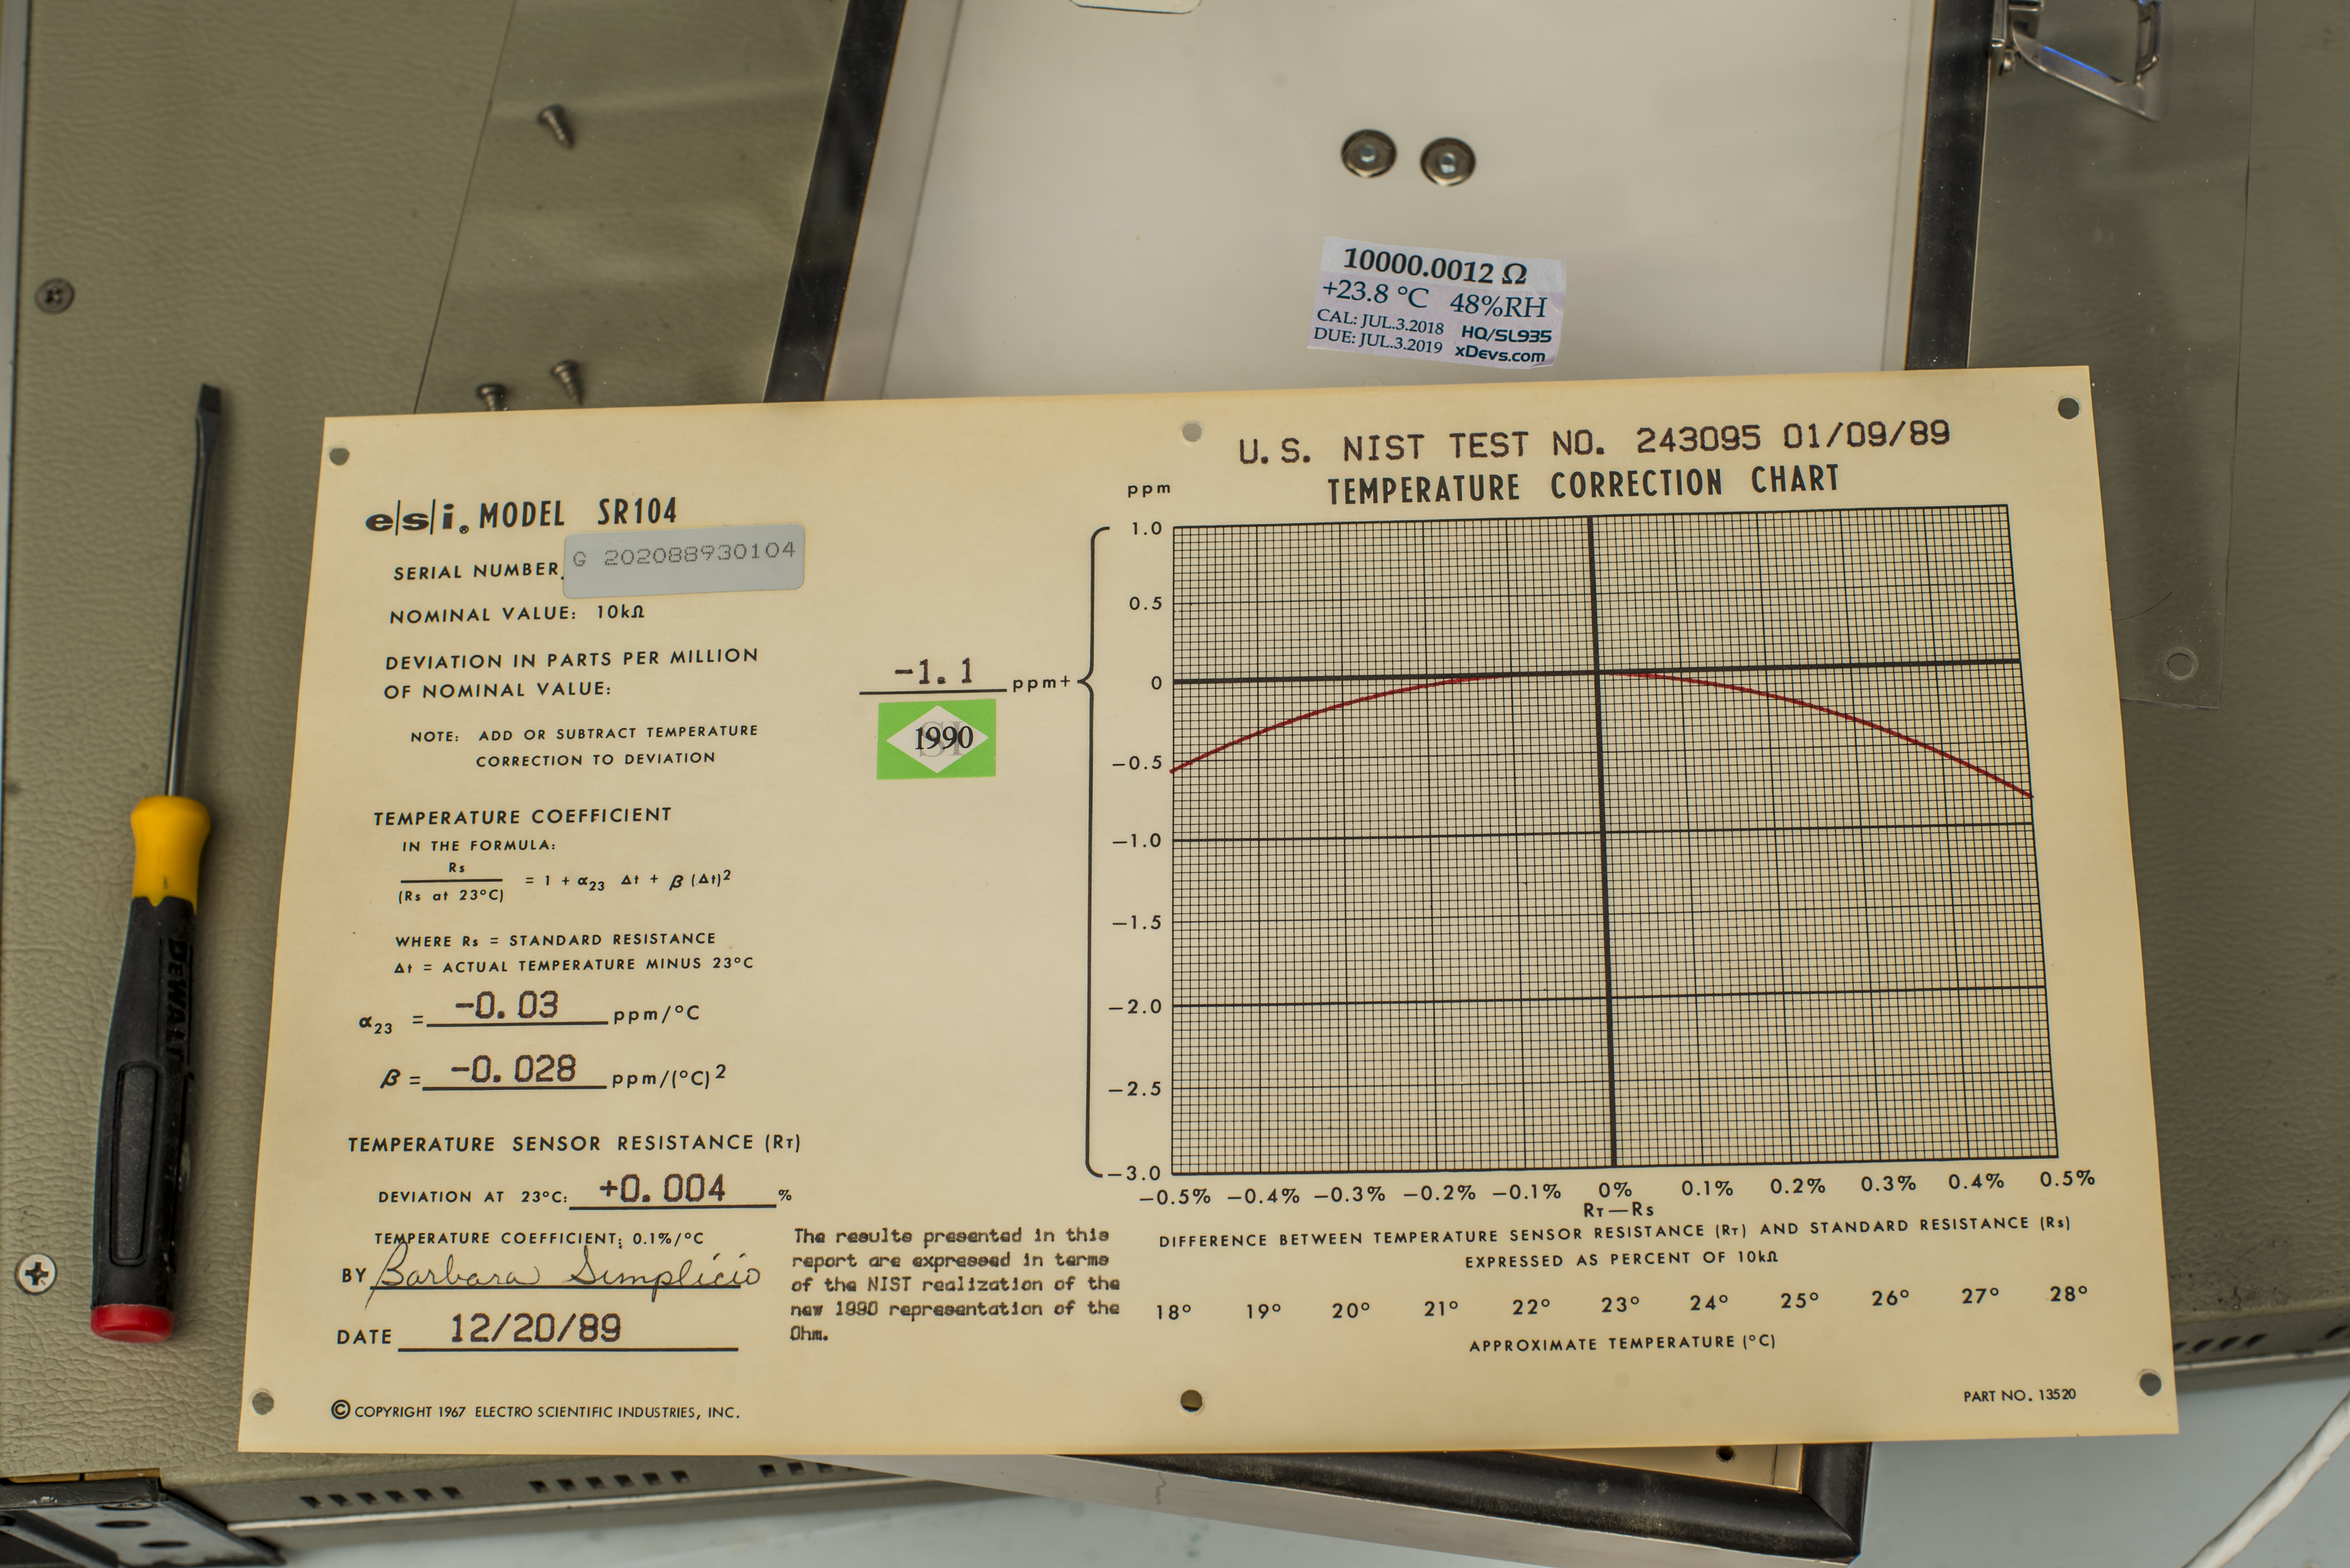
Image 15: Original calibration label paper
Interesting to see SI-1990 redefined ohm label, meaning that despite manufacturing date of December 20, 1989 this standard was already calibrated and measured with corrected representation of US Ohm using newly implemented RK90 quantum-derived constant that came in legal effect few weeks later on January 1, 1990.
Cleaning
Gentle cleaning with water and alcohol mix got most of the dirt out just fine.
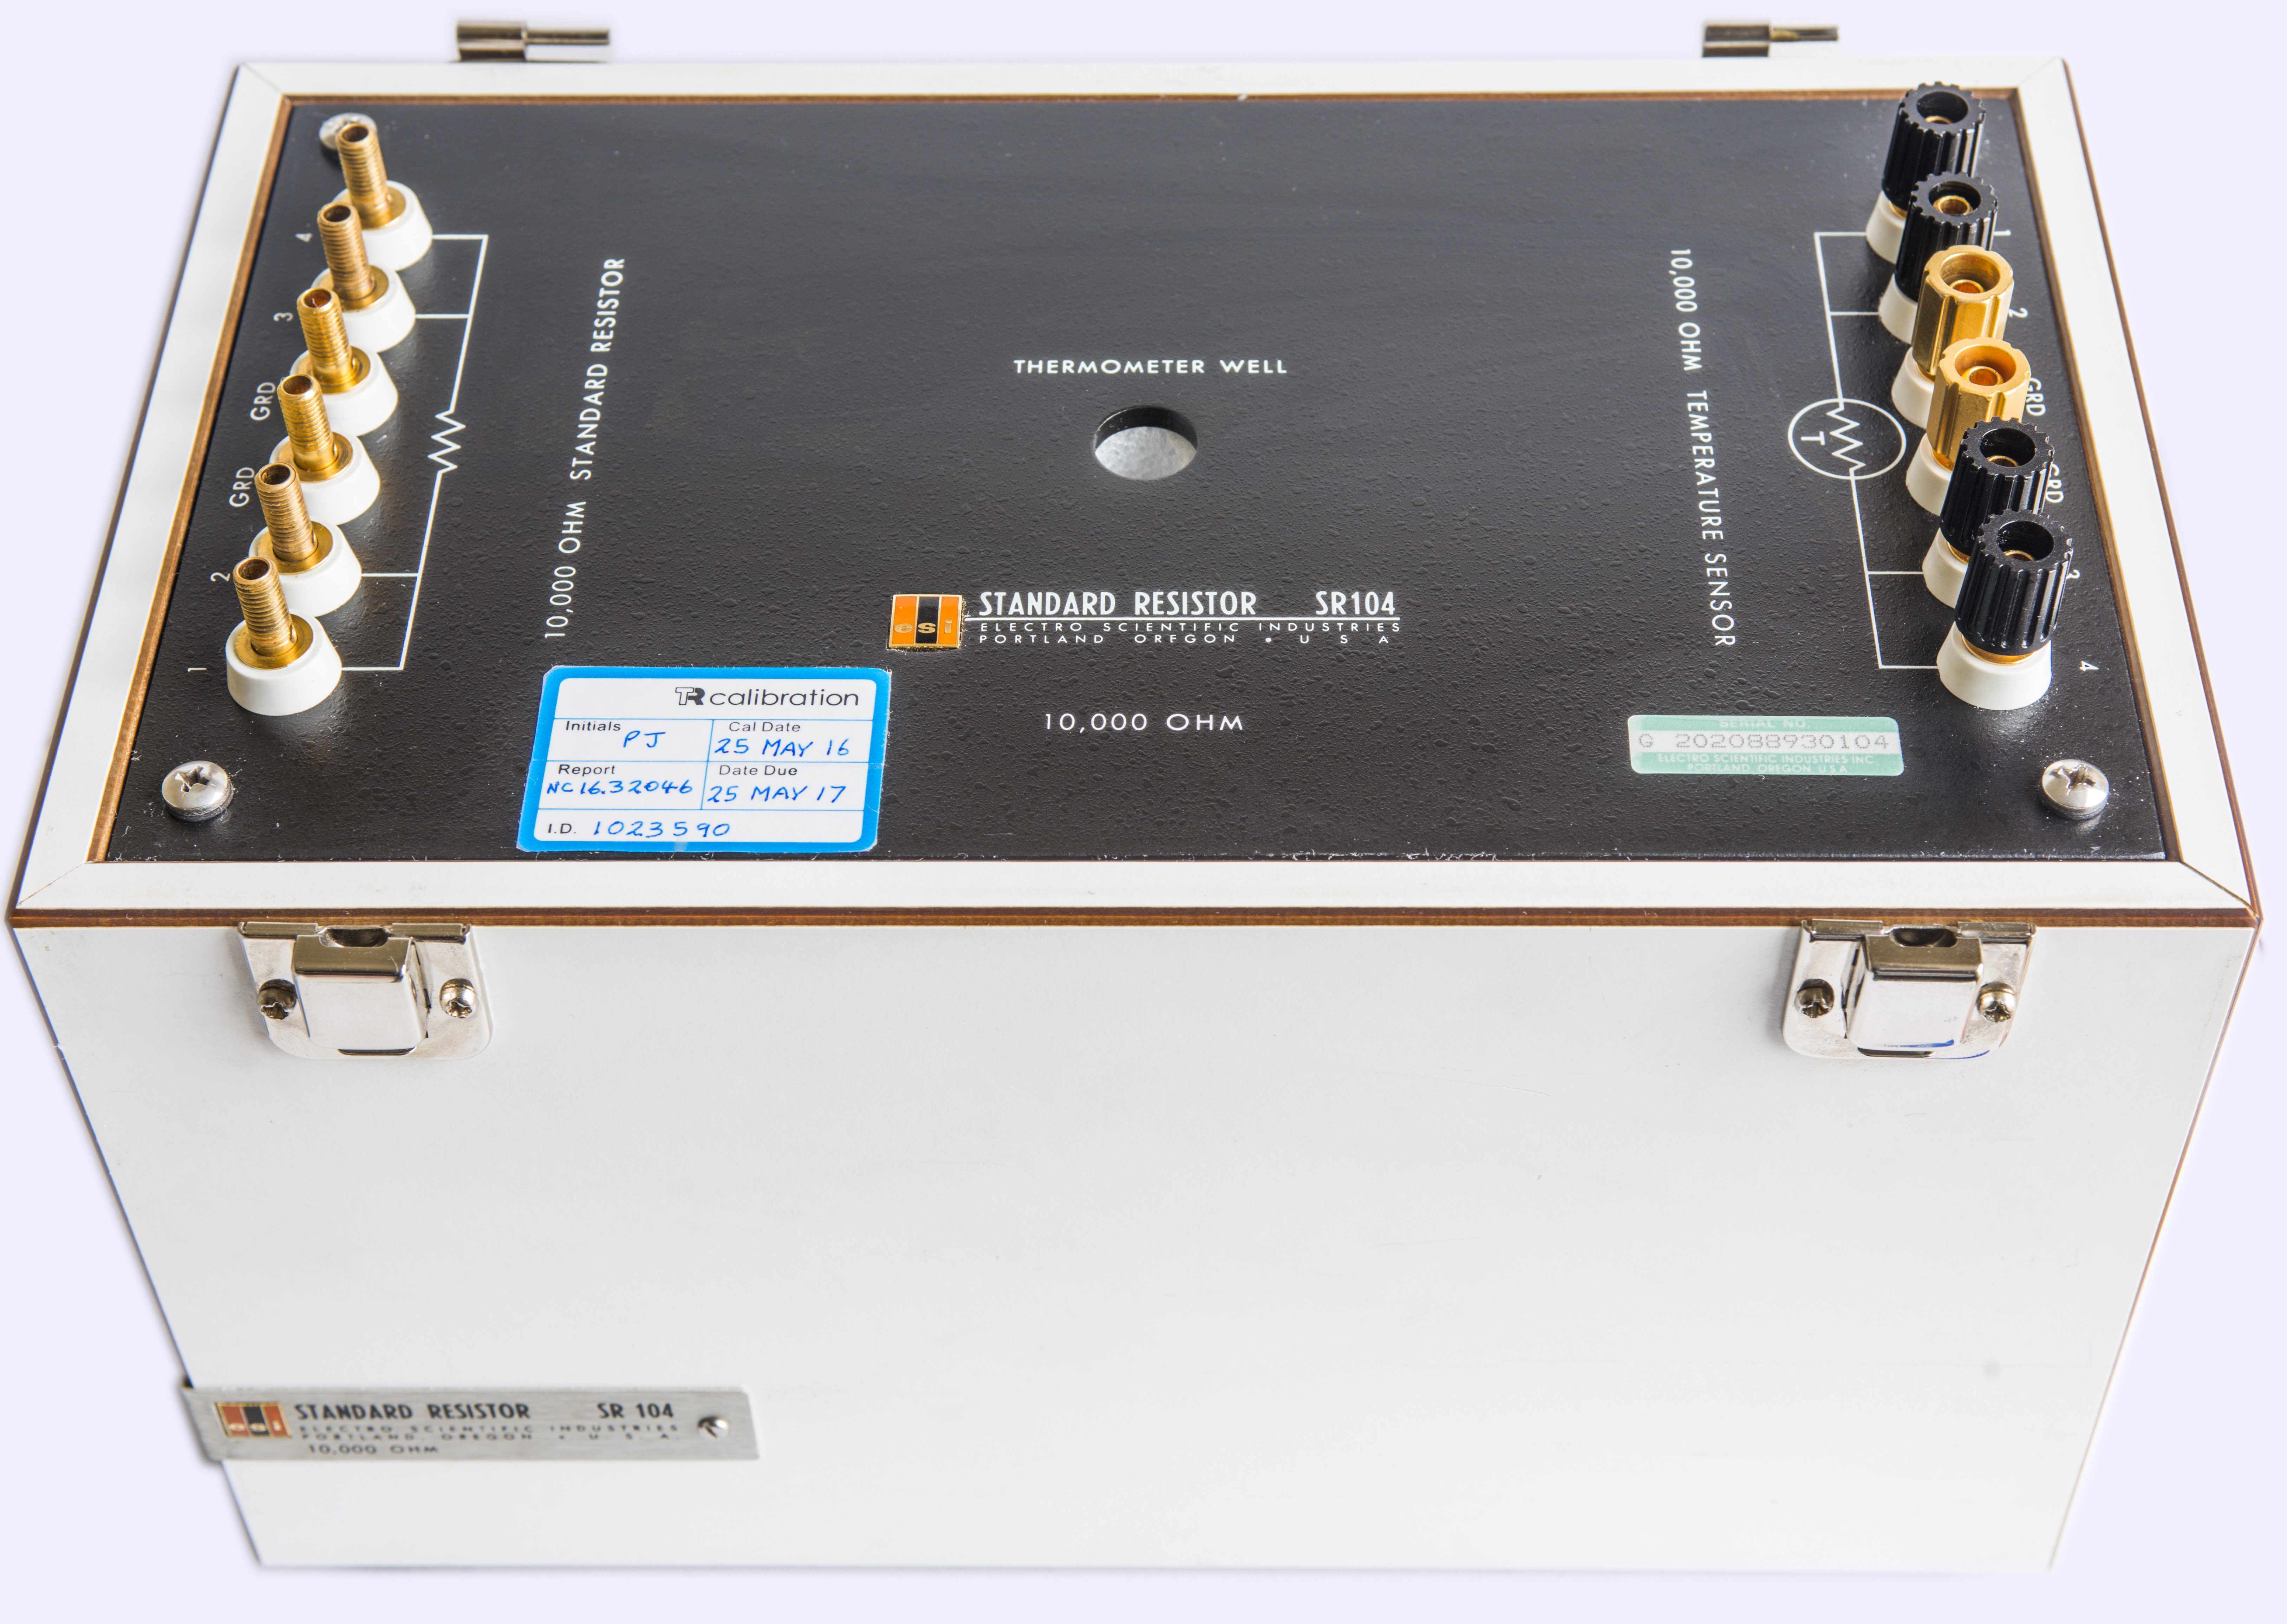
Image 16: ESI SR104 after cleaning and stickers removal.
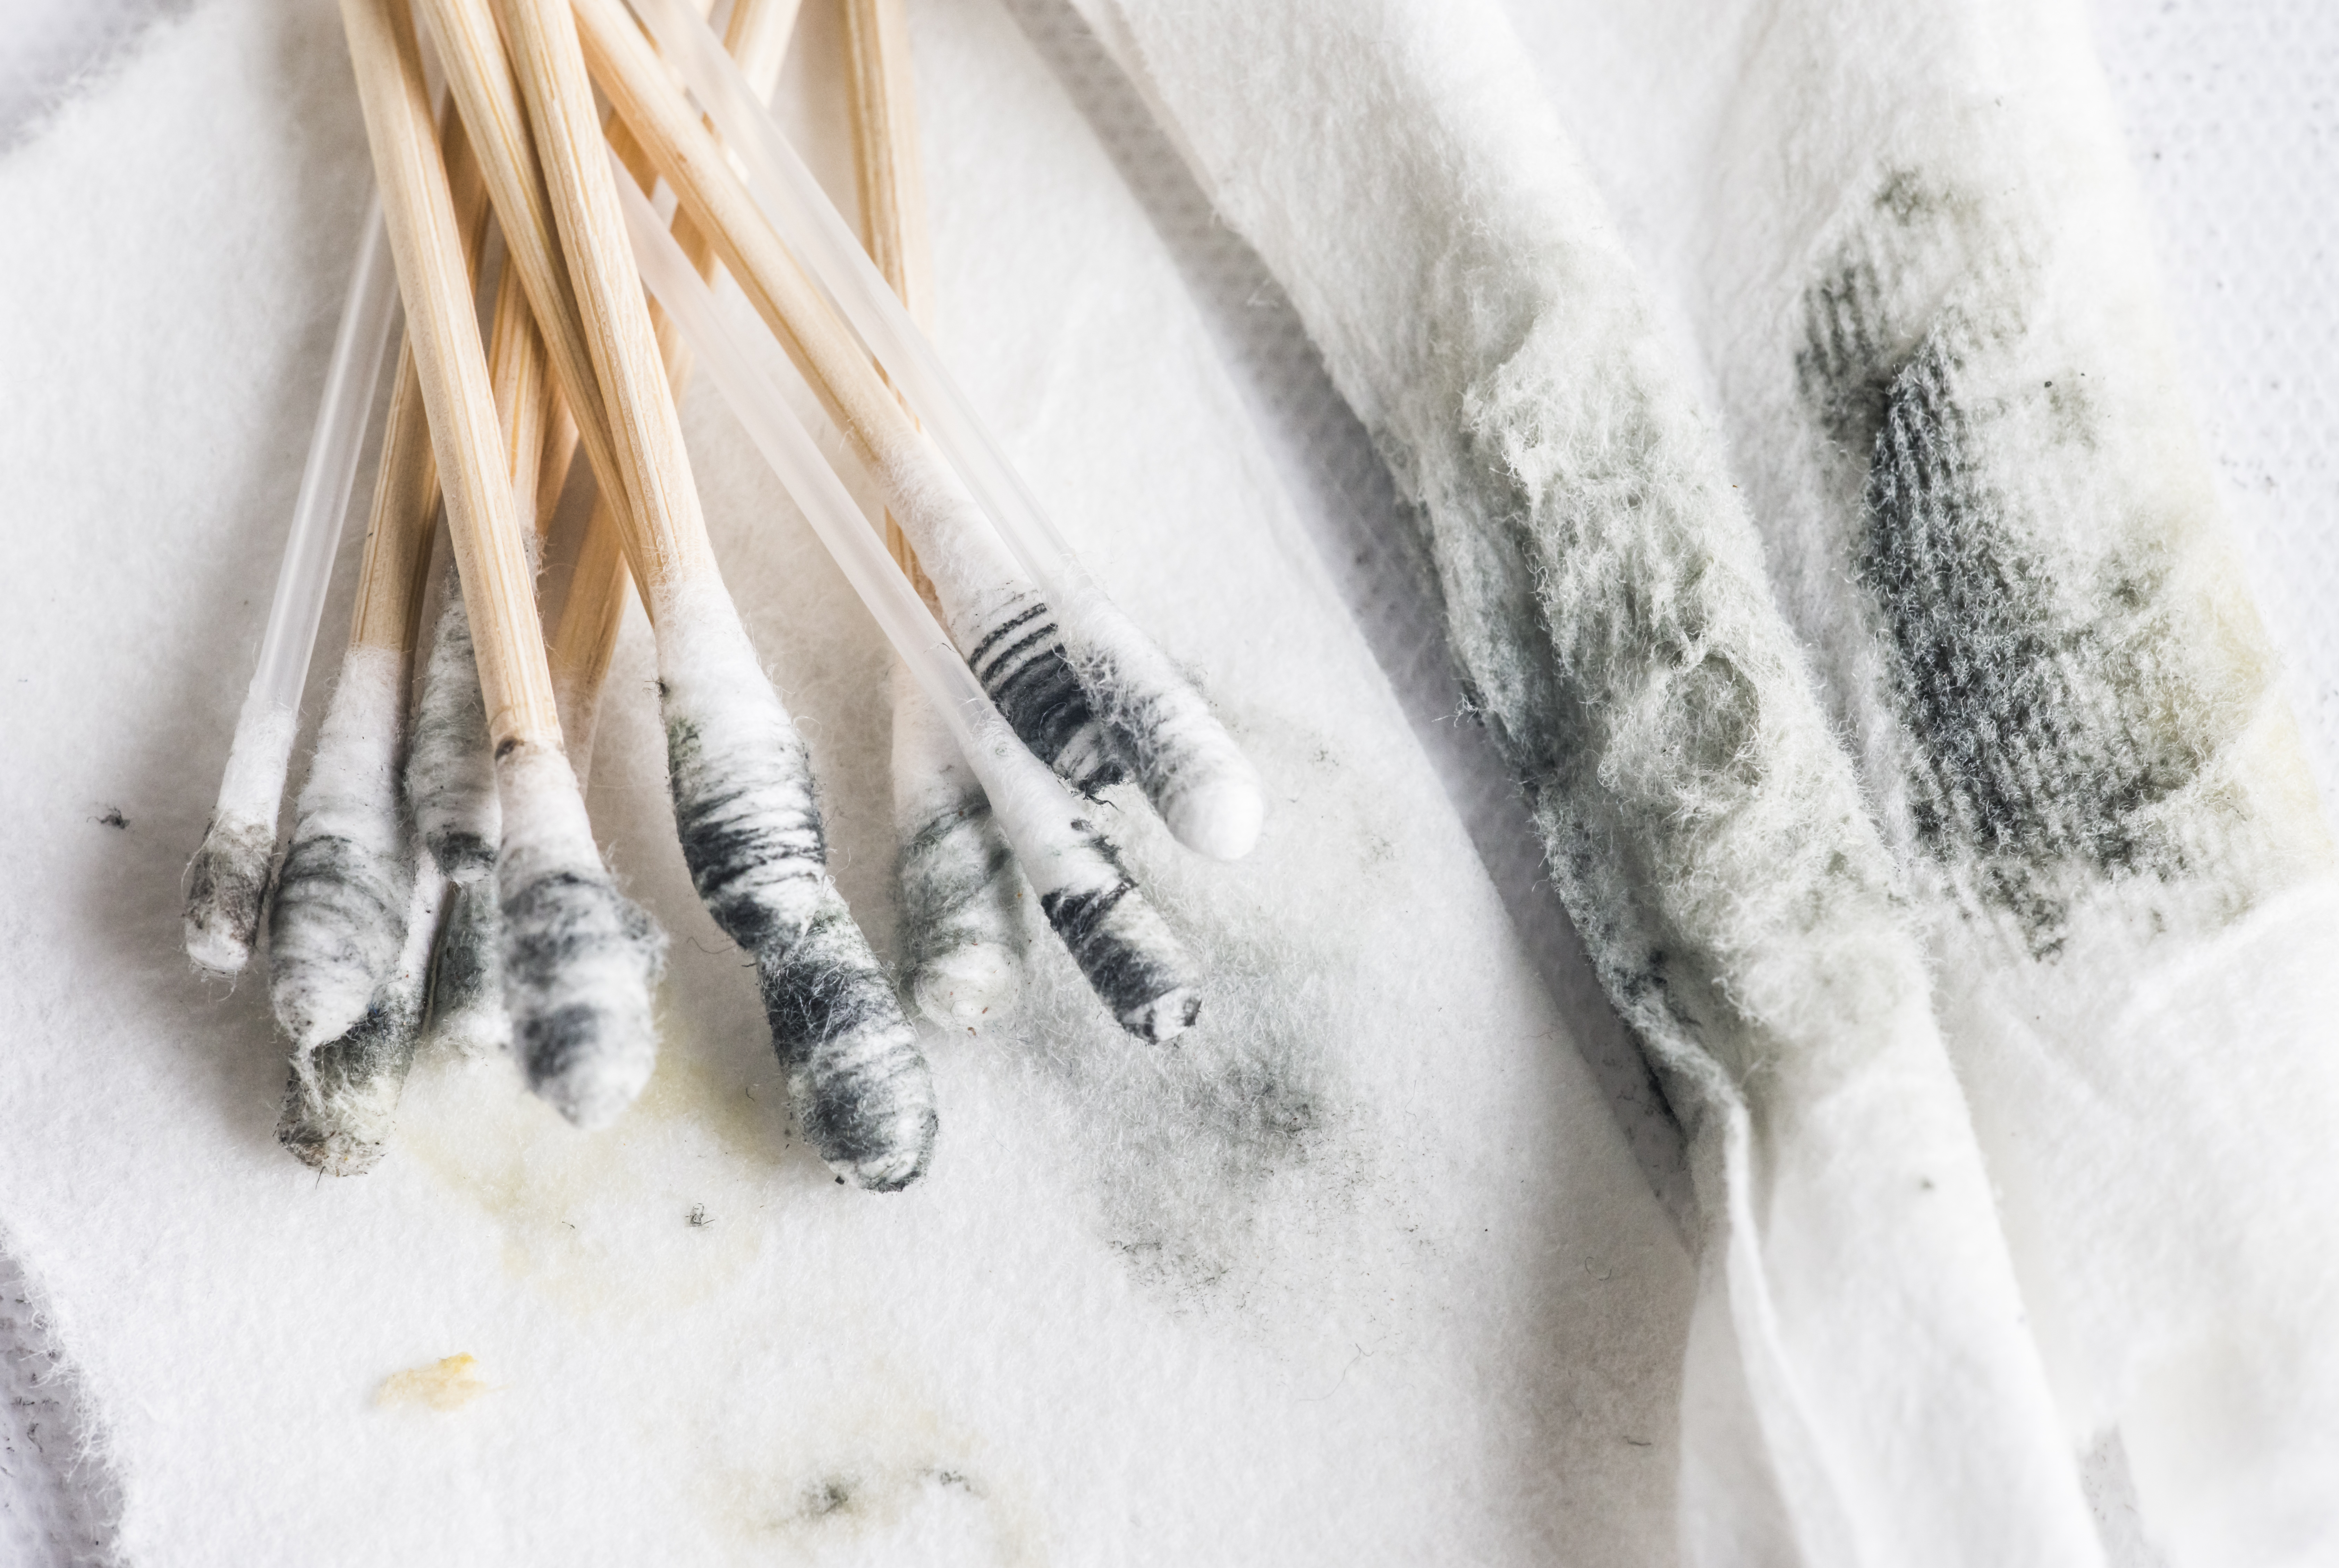
Image 17: Gunk after cleaning the binding posts.
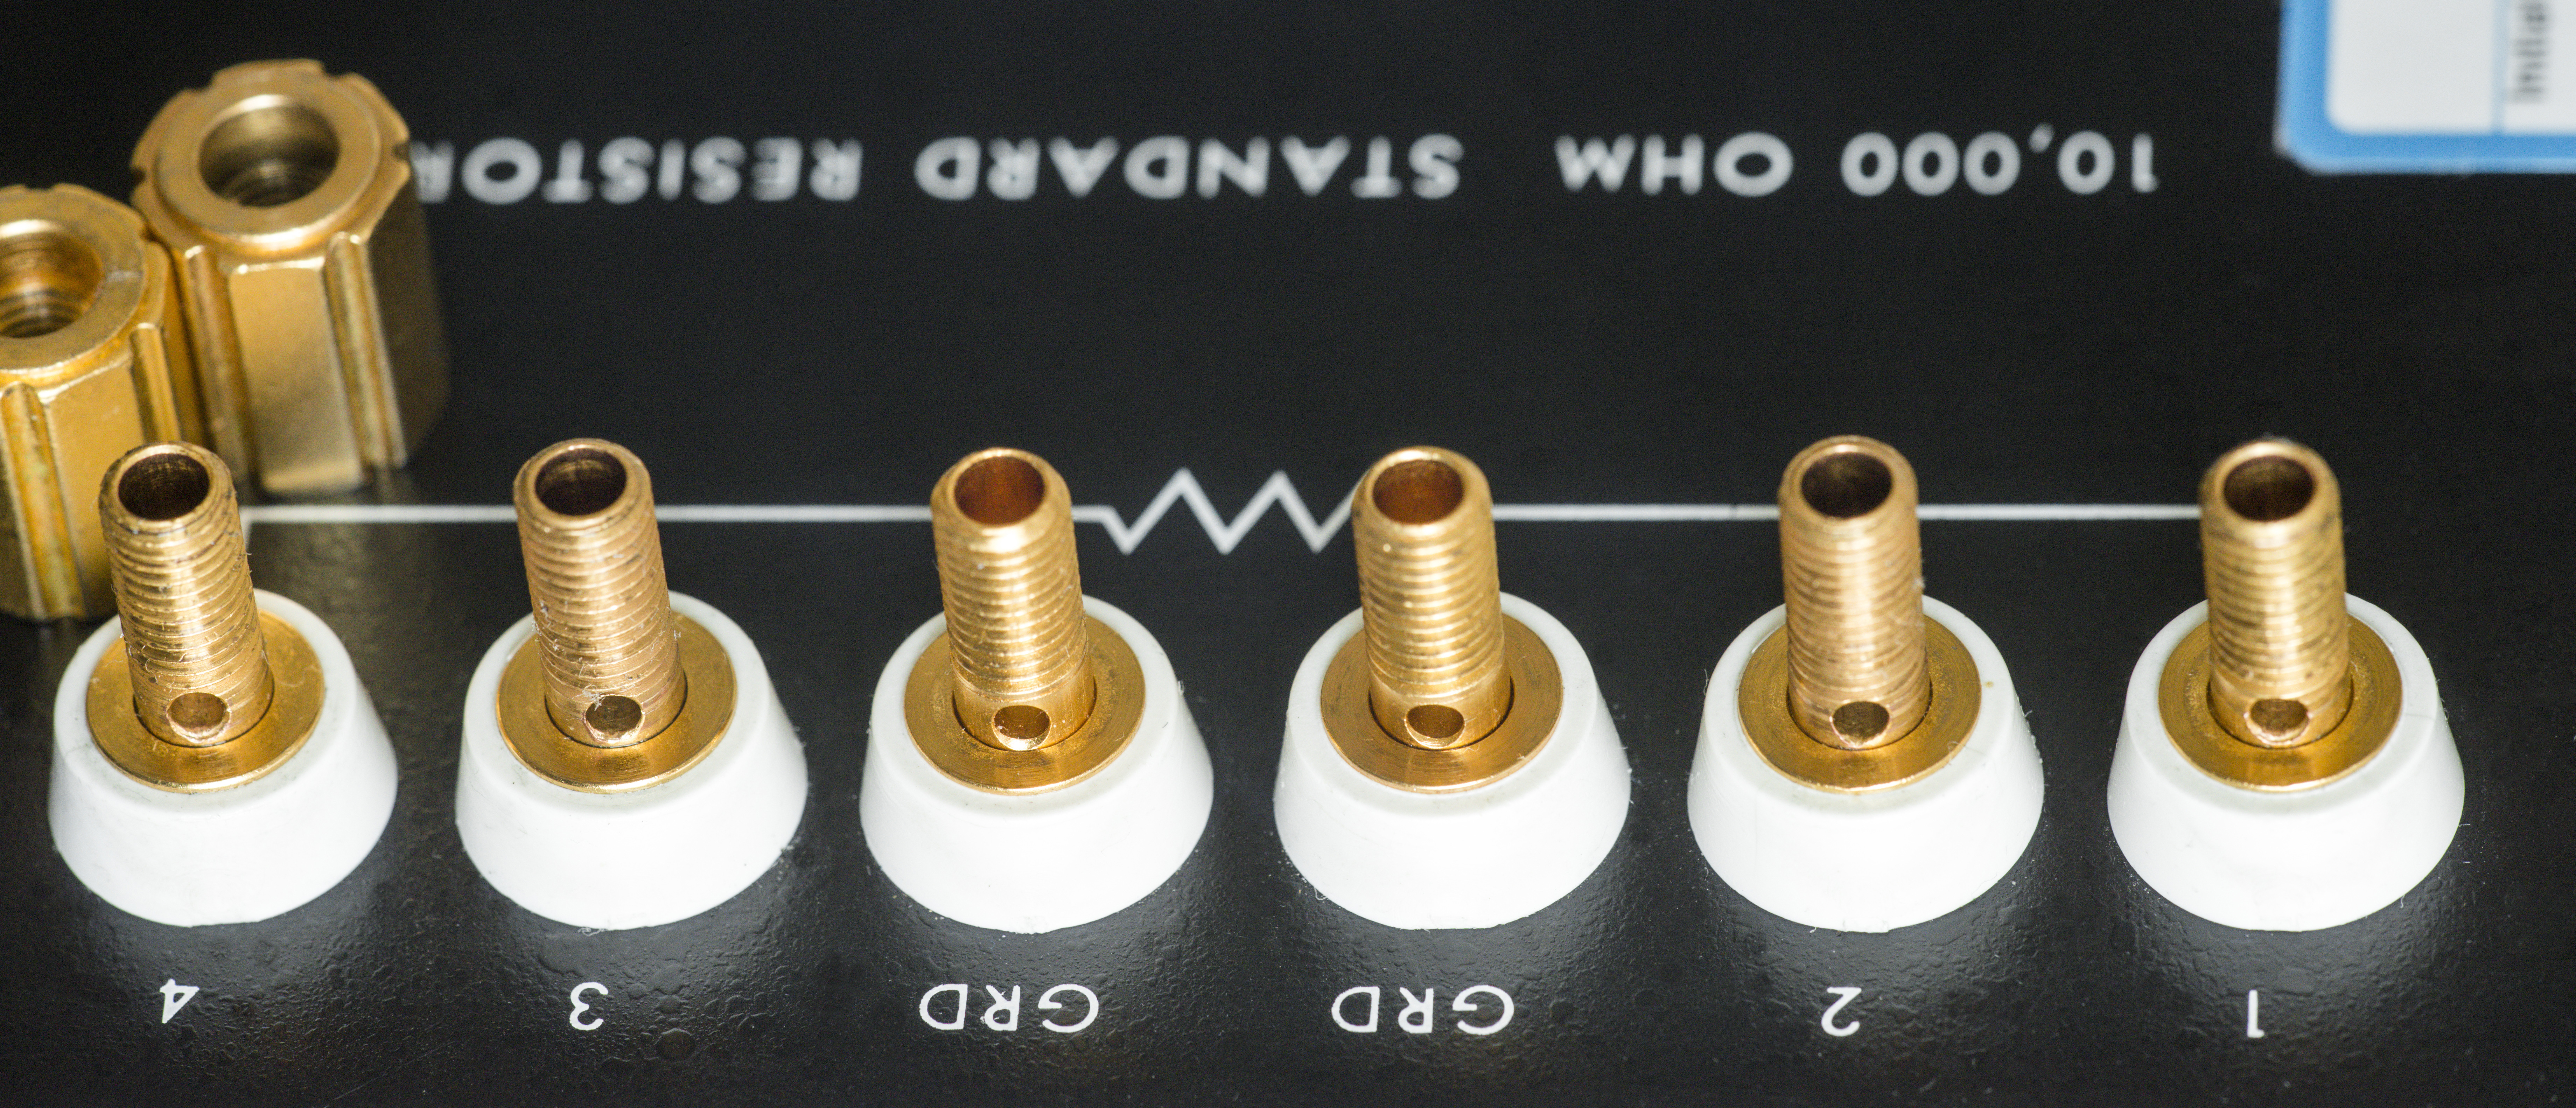
Image 18: Cleaned posts ready for operation.
Initial measurements
We were lucky to receive actual calibration data assigned to this ESI SR104. Calibration was performed in May 2016, just few years ago and this measured value will be used as check baseline. Once Fluke SL935 arrive back to our lab, it will be used to calibrate this SR104 to better uncertainty.
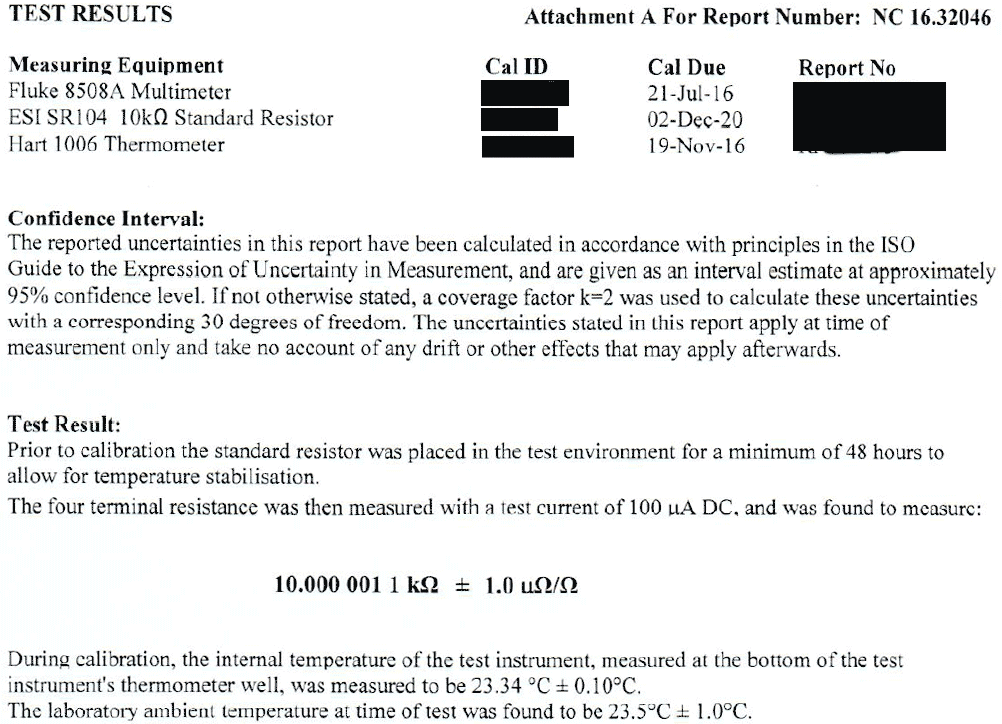
Image 19: Calibration certificate segment with measurement data.
Now time for direct connection to some lab 8½-digit meters for testing.
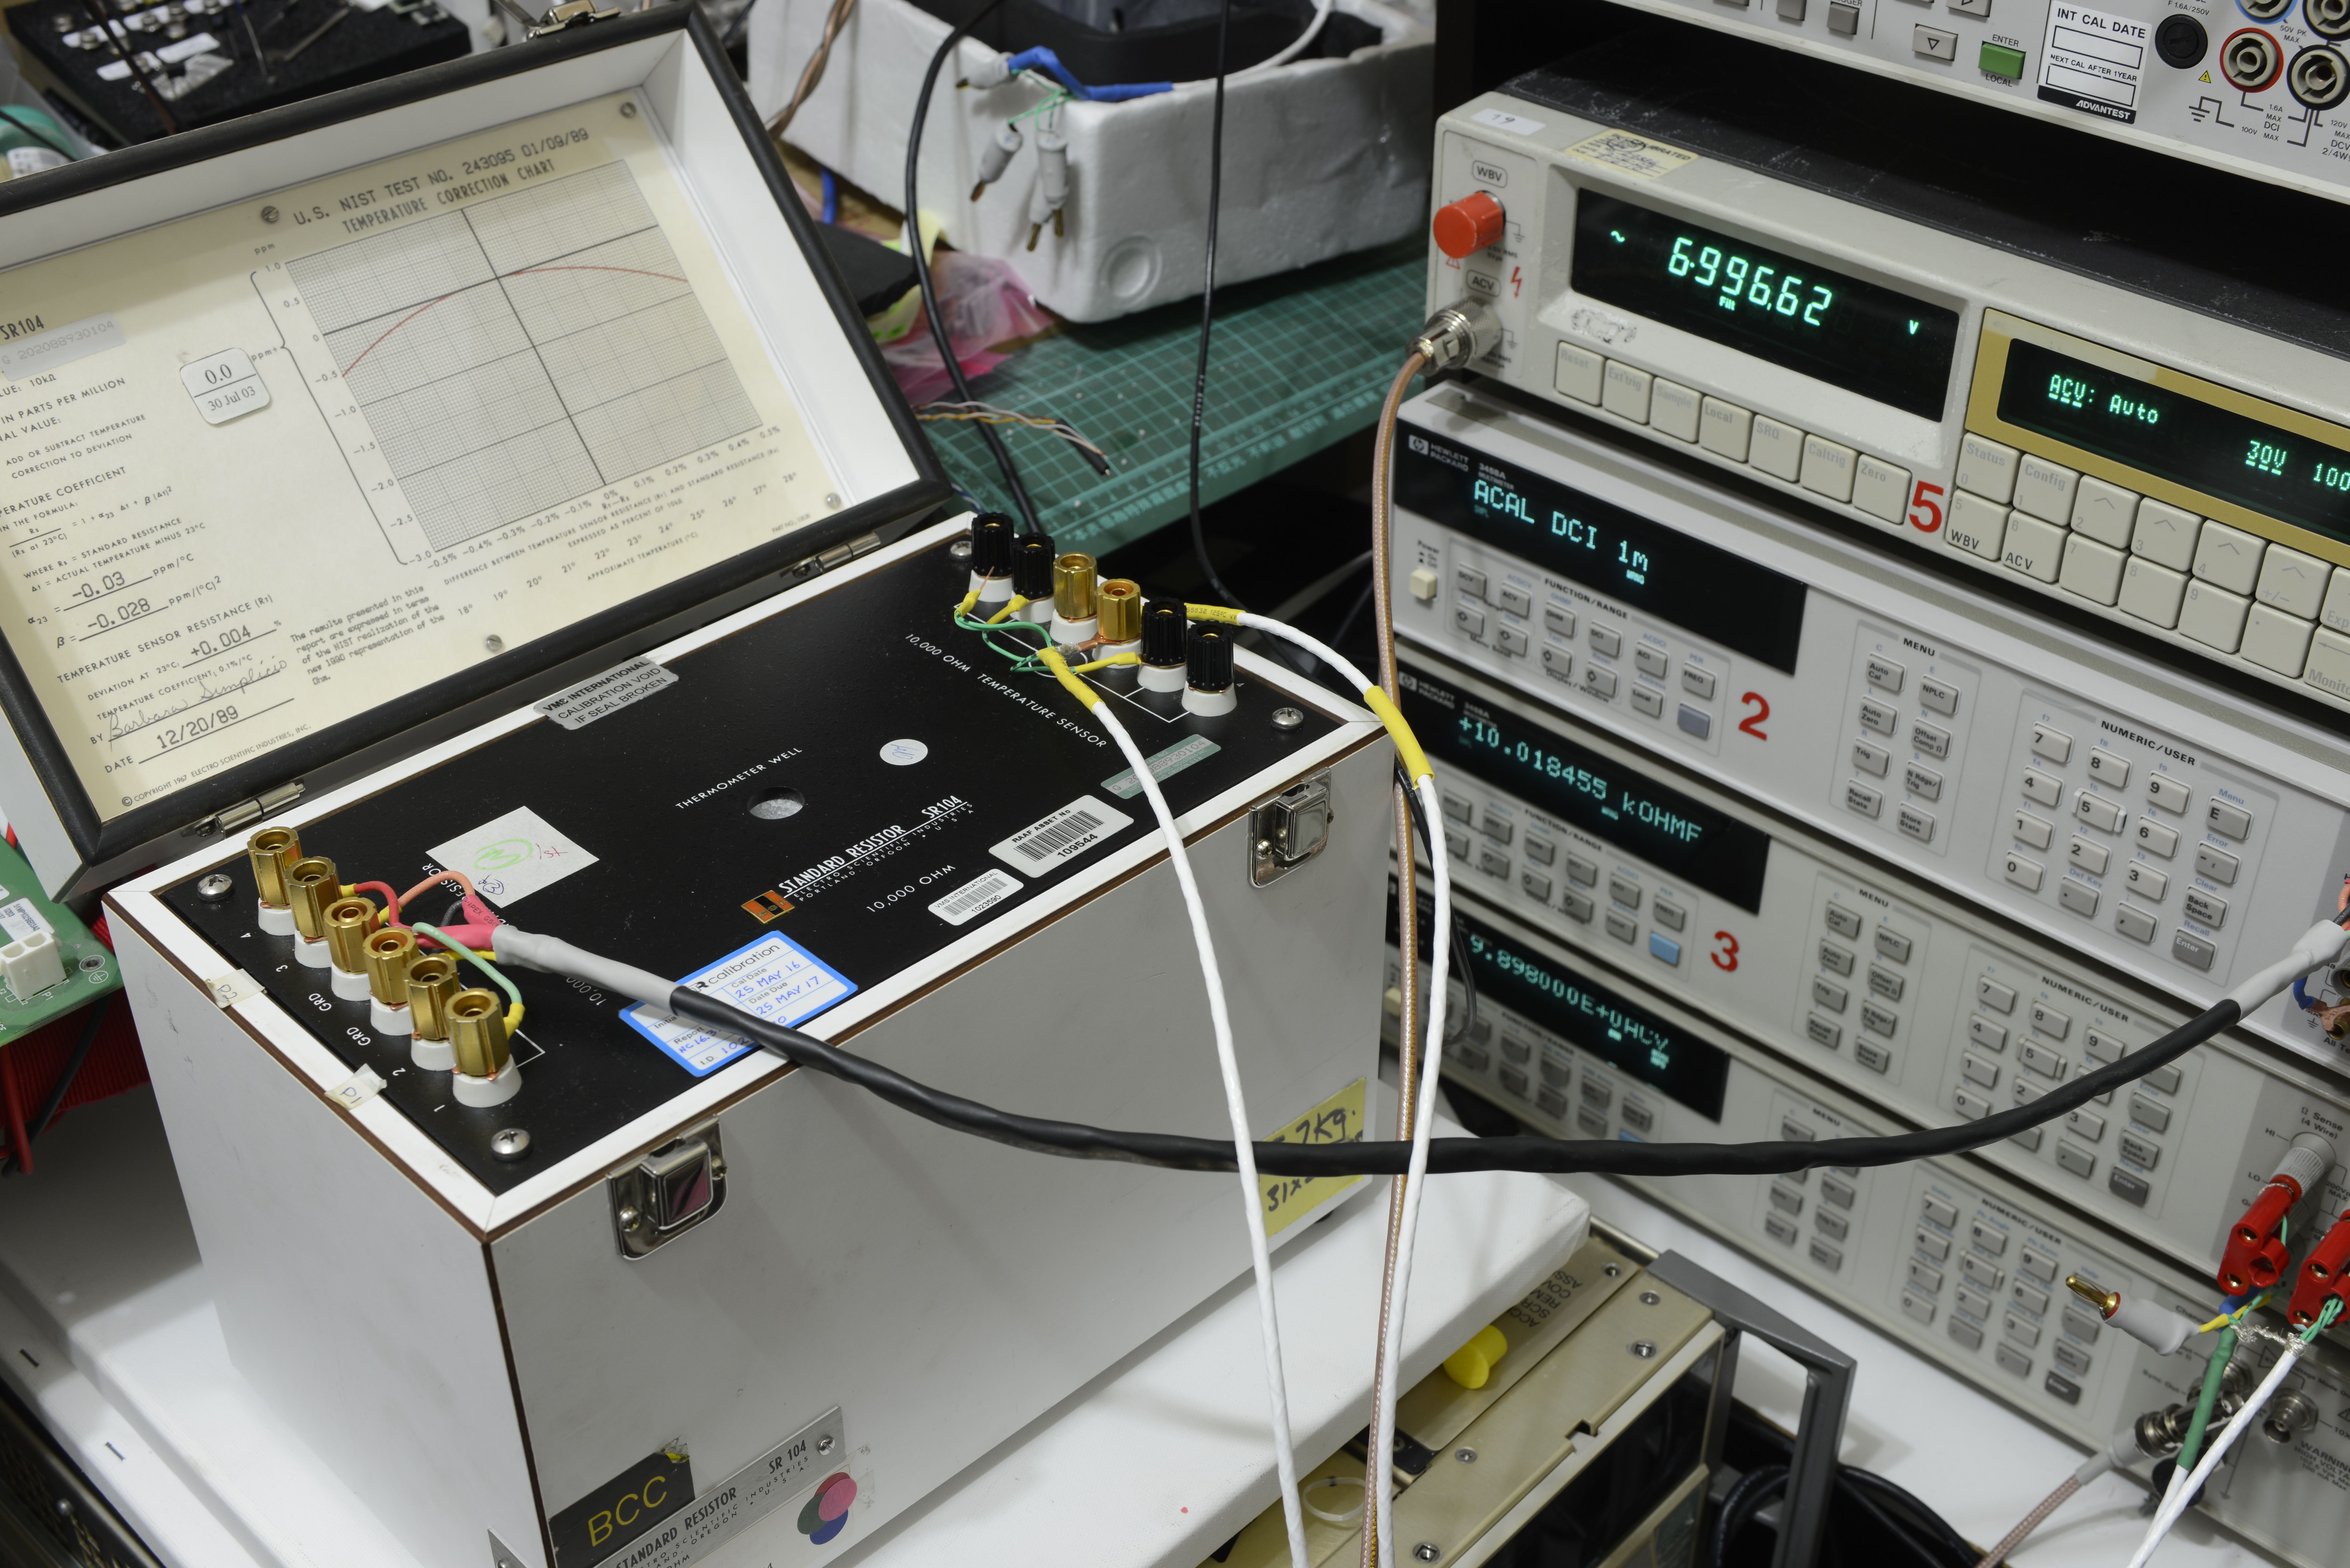
Image 20: Initial testing with ESI SR104 connected to Keysight 3458A pair.
All four used meters are calibrated within last two years, so we can also verify if my resistance accuracy still in ballpark of earlier estimated ±8 µΩ/Ω.
Each multimeter data was fetched by simple python application, with help of linux-gpib and NI GPIB-USB-HS dongle
Data capture was done by Terasic DE1-SoC FPGA board.
Settings used for 3458A:
def init_inst_fres(self):
    # Setup HP 3458A
    self.inst.clear()
    self.inst.write("PRESET NORM")   # Preset meter to known state
    self.inst.write("OFORMAT ASCII") # ASCII format for data
    self.inst.write("OHMF 10E3")     # 10000 Ohm range
    self.inst.write("TARM HOLD")     # Single capture only
    self.inst.write("TRIG AUTO")     # Auto trigger
    self.inst.write("APER 1")        # 1 second aperture for ADC measurement
    self.inst.write("AZERO ON")      # Use autozero
    self.inst.write("OCOMP ON")      # Use offset compensation
    self.inst.write("NRDGS 1,AUTO")  # Take only one reading
    self.inst.write("END ALWAYS")
    self.inst.write("NDIG 9")        # Maximum resolution
    self.inst.write("DELAY 0")       # 2 second delay to mitigate OCOMP accuracy issue due DA
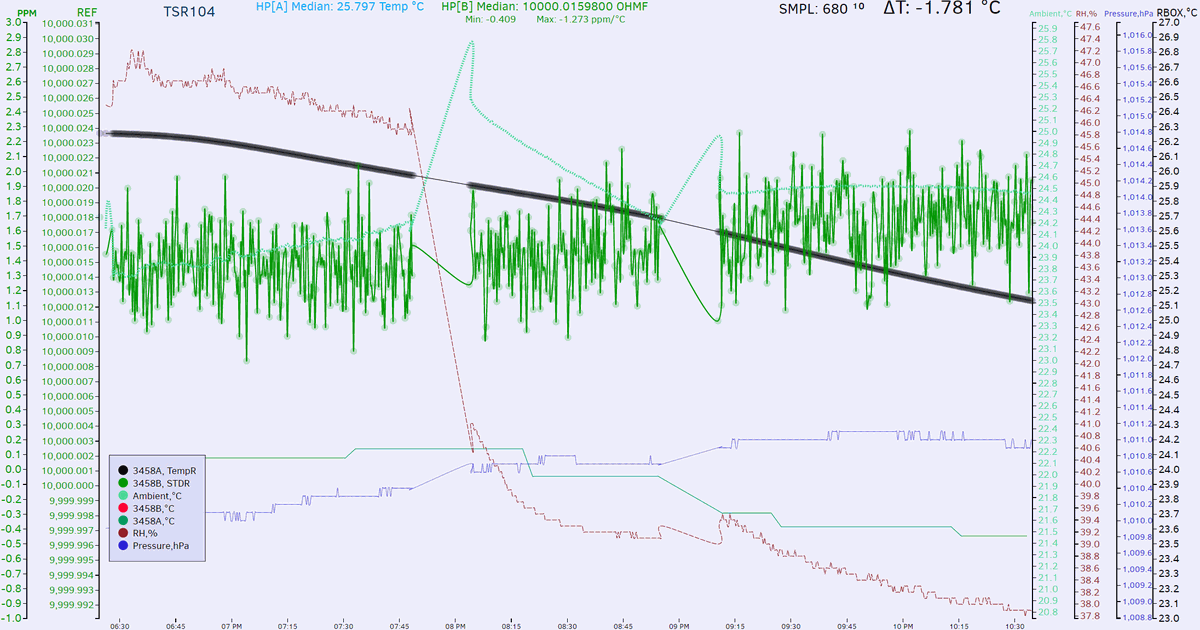
Image 21: ESI SR104 initial measurement over HP3458A-3.
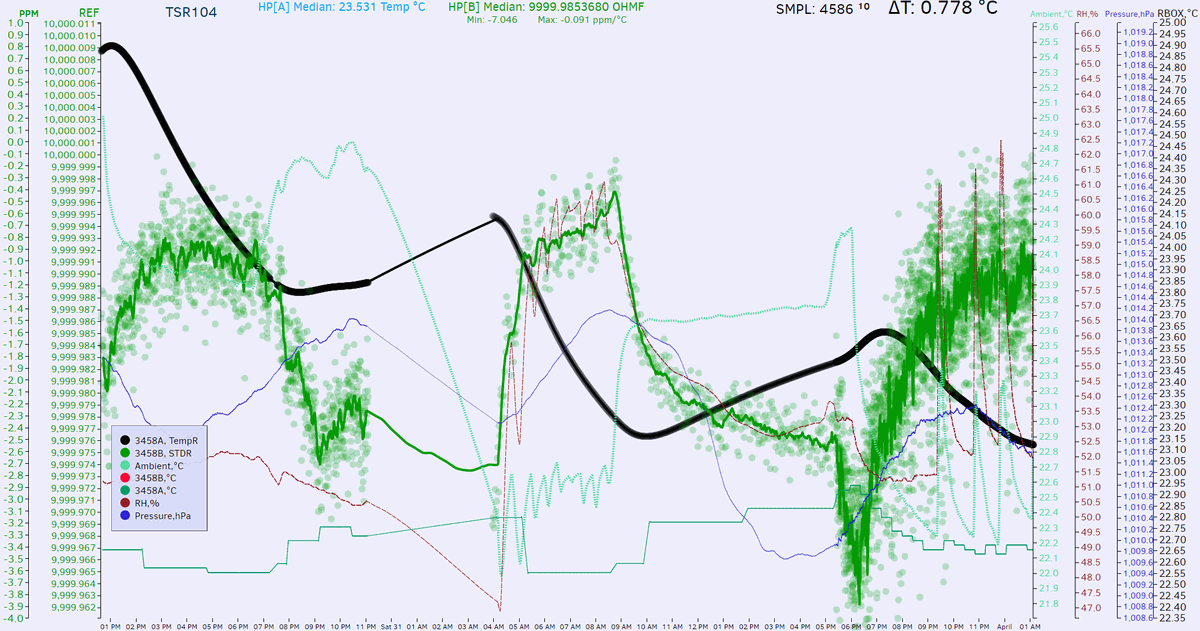
Image 22: ESI SR104 initial measurement over HP3458A-2.
My second HP 3458A calibrated in January 2017 in USA by Todd, and used as 2017 DC & Ohm transfer to my lab first 3458A and Keithley 2002.
Now Keithley 2002 units:
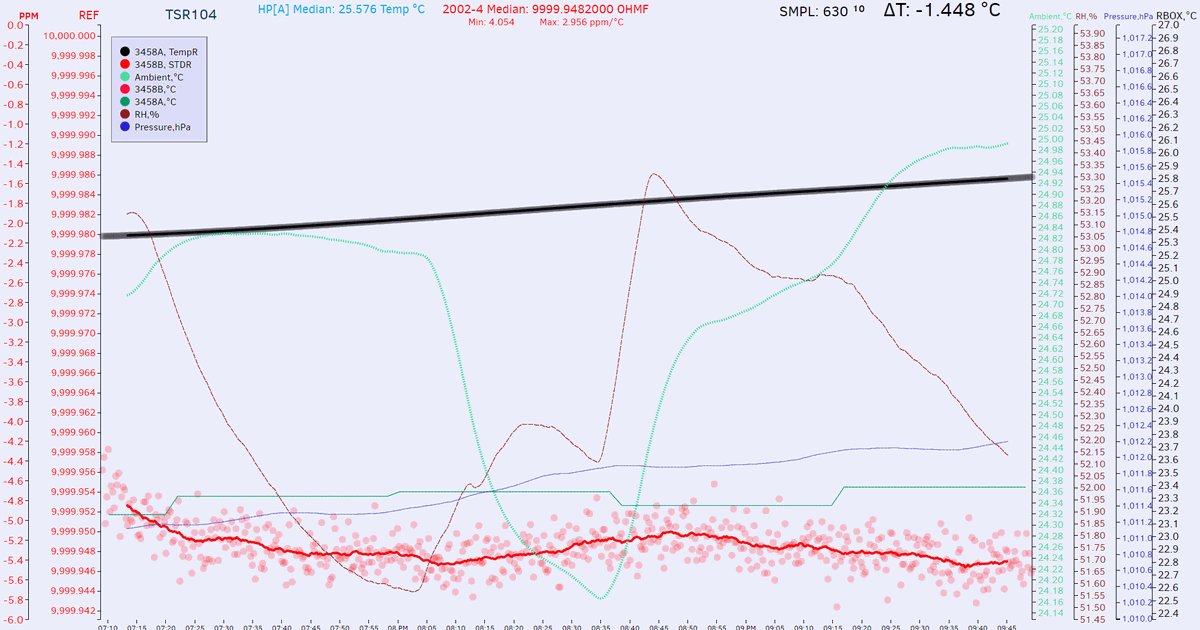
Image 23: ESI SR104 initial measurement over Keithley 2002-4.
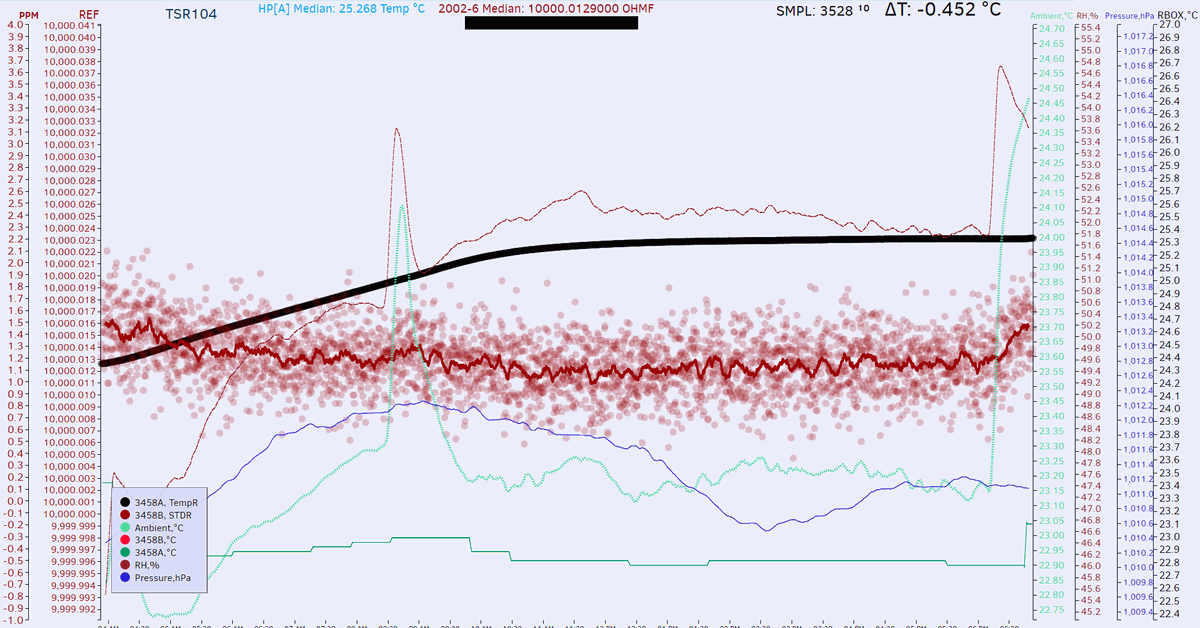
Image 24: ESI SR104 initial measurement over Keithley 2002-6.
Initial results are rather impressive, given any reasonable proper time (weeks) to possibly relax and stabilize from international shipping (you still see oil tank slowly cooling by black RTD element reading line) is already just -1 µΩ/Ω off the value in 2016 calibration report (10000.0011 Ω ±1 µΩ/Ω at +23.34 °C bottom of the well temperature).
| Used DMM | Calibrated | Expected reference | SR104 RTD Temp | DMM reading | Deviation | DMM spec, 1 year |
|---|---|---|---|---|---|---|
| HP 3458A[2] | January 2017, HFL spec | 9999.9999 Ω | +23.3 °C | 9999.9853 | -1.46 µΩ/Ω | ±8 µΩ/Ω |
| HP 3458A[3] | March 2017, 002 spec | 9999.9989 Ω | +23.8 °C | 10000.0182 | +1.93 µΩ/Ω | ±8 µΩ/Ω |
| Keithley 2002[4] | June 14, 2017 | 9999.9973 Ω | +25.6 °C | 9999.9482 | -4.9 µΩ/Ω | ±9.8 µΩ/Ω |
| Keithley 2002[6] | April 8, 2017 | 9999.9978 Ω | +25.3 °C | 10000.0125 | +1.5 µΩ/Ω | ±9.8 µΩ/Ω |
Table 3. Initial resistance check summary, April 2018
Observed difference on both 3458A’s is well with agreement (<1 µΩ/Ω!) from my earlier comparison experiment to November 2017 calibration data from Fluke SL935, giving good confidence that both of my Keysight 3458A still good and stable.
HP 3458A, meter 1 over 10 KΩ, direct 4-wire, OCOMP ON, DELAY 3, NPLC100 = 9999.985 Ω, +25 °C ambient, 20 May 2017. Error from PI value : +1.03 µΩ/Ω
HP 3458A, meter 2 over 10 KΩ, direct 4-wire, OCOMP ON, DELAY 3, NPLC100 = 9999.965 Ω, +24.5 °C ambient, 25 Sept – 28 Sept 2017. Error from PI value : -0.97 µΩ/Ω
Live temperature corrected standard resistance calculator
The temperature correction chart in the lid of the each SR104 unit is helpful to correct the resistance of the standard resistor for different ambient temperature effects. We added interactive real-time calculator for this article to aid with the calculation. Just fill in blue boxes from your SR104 lid information and enjoy the calculated value of expected resistance in green box.
RSTD = 10000 Ω + (( (α × ΔTEMP) + (β × ΔTEMP2) + RSTD_DEV) × 10000 Ω / 1-6) Ω
Here’s realtime calculator that accept resistor parameters from lid certificate to provide temperature-corrected output resistance at arbitrary environment temperature. Just enter α, β, STD deviation and desired temperature:
|
Alpha α +23 °C µΩ/Ω/°C Beta β +23 °C µΩ/Ω/(°C)2 RSTD deviation +23 °C µΩ/Ω Temperature to recalculate at °C | 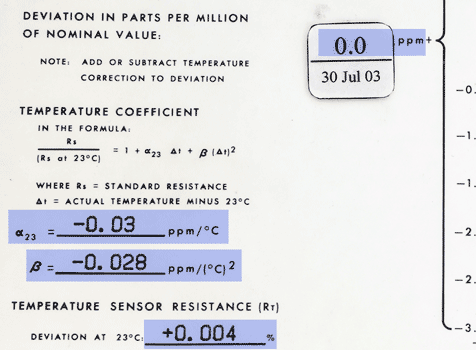 |
This resistance value may be used as given at +23°C, if the change in resistance for the temperature range to be encountered is acceptable. For example, temperature variations less than ±2 °C from a nominal +23 °C would result in a worst case resistance deviation less than -0.3 µΩ/Ω. If this is an acceptable, then no temperature correction is required.
Here is also python application to calculate resistance relations if you prefer to play with numbers more.
import sys

# Constants from SR104 resistor lid
ALPHA    = -0.03  # Alpha value at +23c
BETA     = -0.028 # Beta value
R_DEV    = 0.0    # Deviation value for standard resistor
TEMP_DEV = 0.004  # Deviation value for RT
STEP     = 0.5    # Step to go thru temperature points in mode 2
#count = 0

def show_r(temp, rsi):
    f = 0
    delta = temp - 23.0
    ppm = 0.0 + (ALPHA * delta) + (BETA * delta * delta)
    r = 10000.0 + ((ppm+R_DEV) * 10000.0 / 1000000.0)
    f = (temp * 9.0 / 5.0) + 32.0
    print ("temp = %5.2fC / %5.2fF Rstd = %12.5f Ohms, %3.3f ppm\n" % (temp,f, r, R_DEV+ppm ) ),
    return r

print "-- xDevs.com/EEVBlog RComp | ESI SR104 correction calculator -- \n-- https://xdevs.com/review/sr104/  Rev.1 Apr 2018           --"
print "R deviation = %.4f ppm    T deviation = %.4f%%\n" % (R_DEV, TEMP_DEV),
print "Alpha = %.4f ppm/C       Beta = %.4f ppm/C/C\n" % (ALPHA, BETA)

mode = int(raw_input("Enter 1 to calculate Rstd at Rrtd or Enter 2 for table curve generate"))
if (mode == 1):
    rt = float(raw_input("Room Temp: "))
    rs = float(raw_input("Standard resistance: "))
    rs = 10000.0 + (R_DEV * 10000.0 / 1000000.0)
    print "Rt=%f  Rs=%f\n" % (rt, rs)
    r = (rt - rs) * 100.0 / 10000.0
    r = r - TEMP_DEV
    r = r * 10.0
    temp = r + 23.0
    show_r(temp, 10000)
elif (mode == 2):
    count = int(10 / STEP);
    for ix in range (0,count+1):
        temp = float(18 + ix * STEP)
        show_r(temp, 10000)
Example prinout of python program shown below:
# python ./sr104.py
-- xDevs.com/EEVBlog RComp | ESI SR104 correction calculator --
-- https://xdevs.com/review/sr104/  Rev.1 Apr 2018           --
R deviation = 0.0000 ppm    T deviation = 0.0040%
Alpha = -0.0300 ppm/C       Beta = -0.0280 ppm/C/C

Enter 1 to calculate Rstd at Rrtd or Enter 2 for table curve generate2
temp = 18.00C / 64.40F Rstd =   9999.99450 Ohms, -0.550 ppm
temp = 18.50C / 65.30F Rstd =   9999.99568 Ohms, -0.432 ppm
temp = 19.00C / 66.20F Rstd =   9999.99672 Ohms, -0.328 ppm
temp = 19.50C / 67.10F Rstd =   9999.99762 Ohms, -0.238 ppm
temp = 20.00C / 68.00F Rstd =   9999.99838 Ohms, -0.162 ppm
temp = 20.50C / 68.90F Rstd =   9999.99900 Ohms, -0.100 ppm
temp = 21.00C / 69.80F Rstd =   9999.99948 Ohms, -0.052 ppm
temp = 21.50C / 70.70F Rstd =   9999.99982 Ohms, -0.018 ppm
temp = 22.00C / 71.60F Rstd =  10000.00002 Ohms, 0.002 ppm
temp = 22.50C / 72.50F Rstd =  10000.00008 Ohms, 0.008 ppm
temp = 23.00C / 73.40F Rstd =  10000.00000 Ohms, 0.000 ppm
temp = 23.50C / 74.30F Rstd =   9999.99978 Ohms, -0.022 ppm
temp = 24.00C / 75.20F Rstd =   9999.99942 Ohms, -0.058 ppm
temp = 24.50C / 76.10F Rstd =   9999.99892 Ohms, -0.108 ppm
temp = 25.00C / 77.00F Rstd =   9999.99828 Ohms, -0.172 ppm
temp = 25.50C / 77.90F Rstd =   9999.99750 Ohms, -0.250 ppm
temp = 26.00C / 78.80F Rstd =   9999.99658 Ohms, -0.342 ppm
temp = 26.50C / 79.70F Rstd =   9999.99552 Ohms, -0.448 ppm
temp = 27.00C / 80.60F Rstd =   9999.99432 Ohms, -0.568 ppm
temp = 27.50C / 81.50F Rstd =   9999.99298 Ohms, -0.702 ppm
temp = 28.00C / 82.40F Rstd =   9999.99150 Ohms, -0.850 ppm
Be sure to update constants ALPHA, BETA, R_DEV, TEMP_DEV to match your SR104 standard lid information before use.
I have compiled few known ESI SR104 and our ovenized Fluke SL935 temperature stability data together into pretty Excel chart:
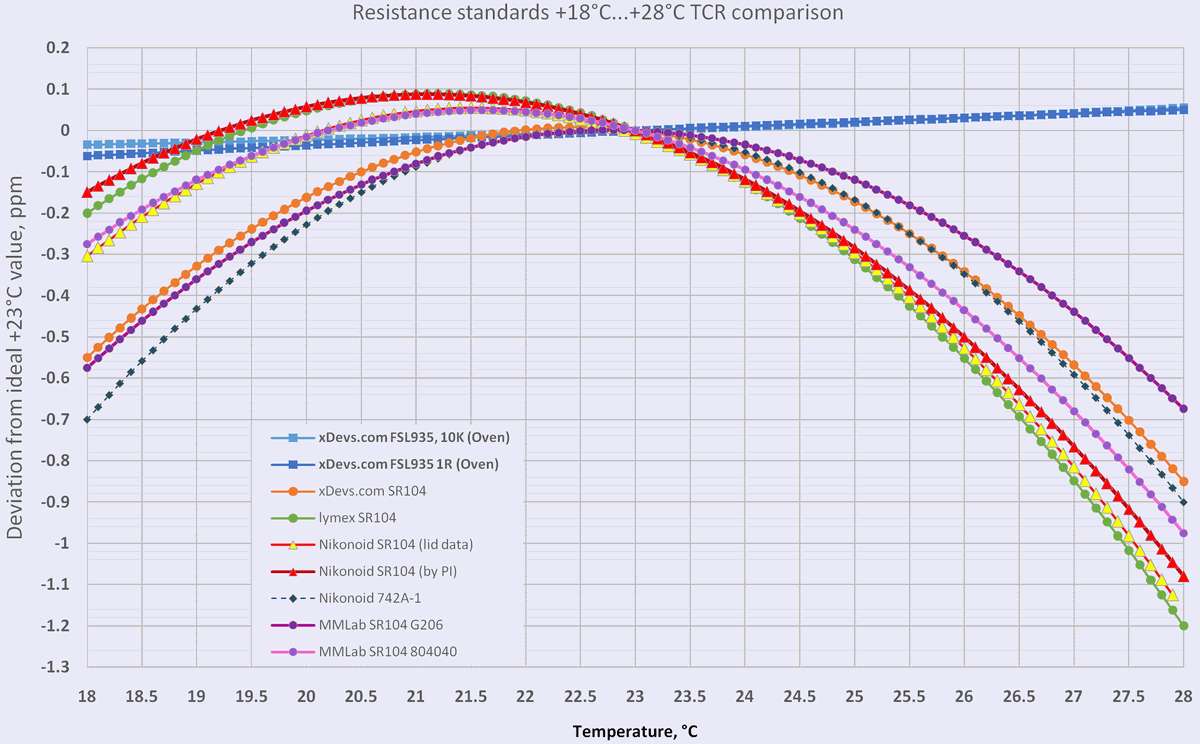
Image 25: ESI SR104 versus ovenized FSL935 in temperature coefficient from +18°C to +28°C. Click for Excel file.
Calibration certificates and transfer results
External traceable results
Image 37: Second SR104 certificate from 2016 year
As received calibration, 2016 by TR calibration Australia , using Fluke 8508A/001 transfer from reference SR104:
Taiwan National Measurement Laboratory CMS ITRI xDevs.com SR104 calibration on 6/6/2019
PI xDevs.com SR104 calibration on 3/17/2020 – rejected result from this lab, not meeting annual SR104 spec.
Measurements International xDevs.com SR104 calibration on 6/8/2021
Measurements International MMLab SR104 #3 calibration on 6/10/2021
Measurements International TL SR104 #1 calibration on 6/10/2021
Measurements International TL SR104 #2 calibration on 6/8/2021
Measurements International SR104 S/N 948019 calibration on 5/25/2024
Internal transfers at xDevs.com labs
These transfers were automated and performed with Datron 1281 precision DMM in TrueOHM, RESL8, FILT_OFF, AVG OFF mode with Front, CH_A and CH_B input terminals. All connections done with shielded PTFE wiring on a freshly calibrated Datron 1281 (within 48 hours).
Transfer MMLab SR104 to MMLab SR104 temperature output on 6/25/2021
Transfer MMLab SR104 to xDevs.com SR104 on 6/25/2021
Transfer xDevs.com SR104 to MMLab SR104 on 6/25/2021
Transfer MMLab SR104 to TL SR104 #1 on 6/25/2021
Transfer TL SR104 #2 to MMLab SR104 on 6/25/2021
Transfer MMLab SR104 to TL SR104 #2 on 6/25/2021
All this data and intermediate transfers with calculated uncertainty budgets allow to estimate long term drift of resistance standard with decent confidence. Summary of such calculations on primary SR104 used by xDevs.com lab experiments presented in following chart on Image 38.
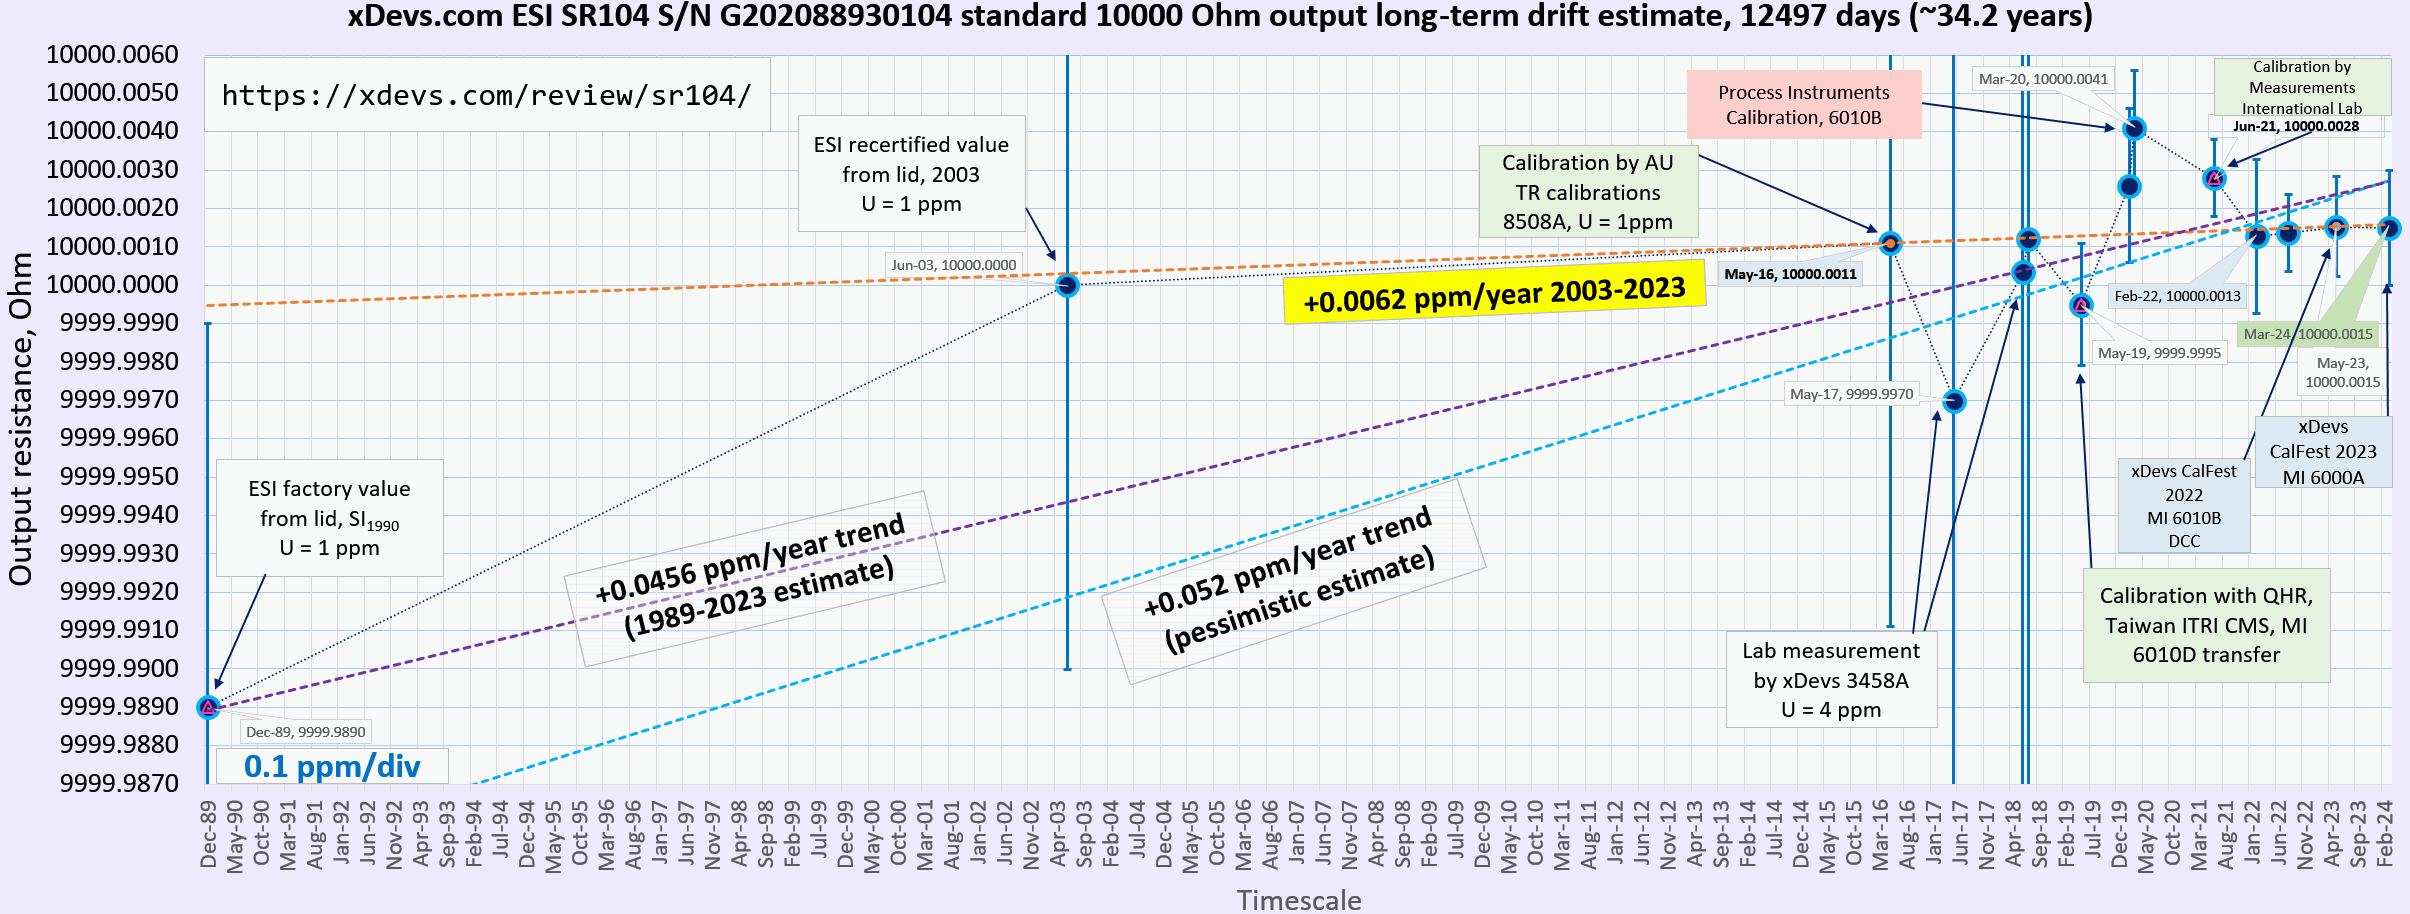
Image 38: xDevs.com SR104 combined calibration results and long-term drift estimate
Now after number of years and newly collected measurements by xDevs.com + external accredited calibration measurements I could also renew the lid label with updated information:
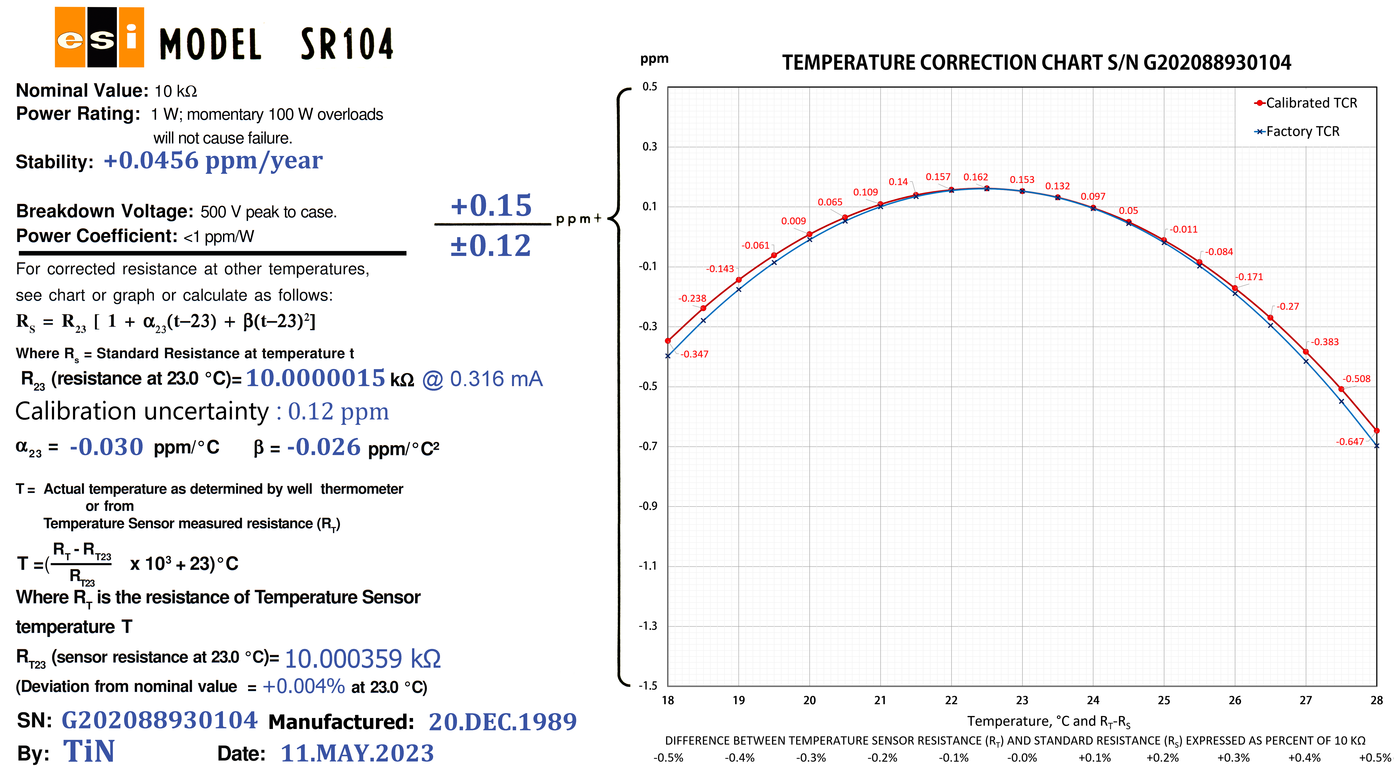
Image 39: New printed label for the standard’s lid
Original factory label is placed under it just in case for future as well.
Overheat event, July 15 2026
On July 15, 2026 due to power shutdown and due to airbath box failure xDevs ESI SR104 standard that was inside of the chamber got subjected to air high temperatures for more than 12 hours, reaching peak temperature +60 °C. Issue was discovered only the following day and standard was removed from the chamber and naturally cooled to ambient temperature. Wirewound resistor standards often sensitive to large temperature stresses which may cause permanent and long-term value shifts. This is the main concern for artifact standard and stressed standard must be re-evaluated over long period of time to establish new baseline performance.
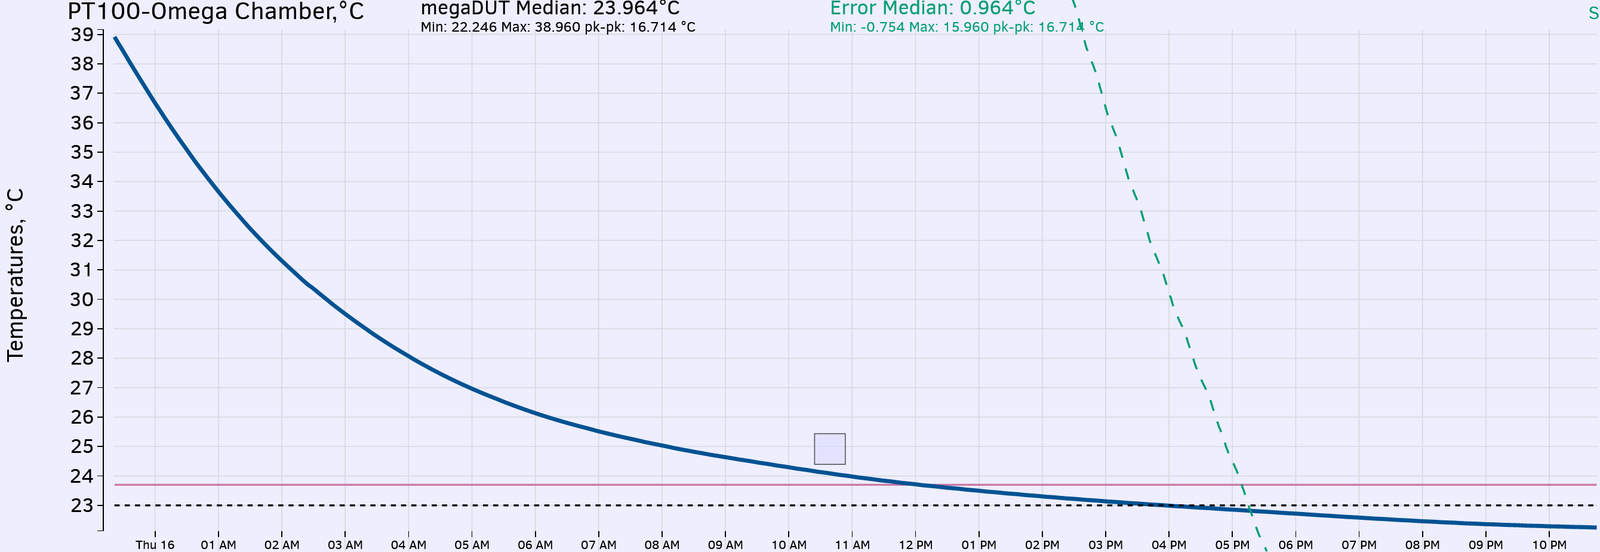
It took more than 23 hours for temperature cooldown to ambient, monitored by Omega PT1000 RTD placed inside of the temperature well in this stressed SR104. Initial measurements with MIL 6000A BVD bridge against Fluke SL935 10000 Ω standard at 316 µA test current revealed new value:
| Model and serial | Calibration date | Assigned value | Uncertainty | Calculated drift | Notes | Age |
|---|---|---|---|---|---|---|
| SR104 G0202088930104 | December 20, 1989 factory | 9999.989 Ω | ±1 µΩ/Ω | TBD | at +23 °C | Reference |
| SR104 G0202088930104 | June 30, 2003 factory | 10000 Ω | ±1 µΩ/Ω | TBD | at +23 °C | ? days |
| SR104 G0202088930104 | May 25, 2016 TR Calibration | 10000.0011 Ω | ±1 µΩ/Ω | TBD | at +23 °C | ? days |
| SR104 G0202088930104 | May 20, 2017 xDevs via 3458A | 9999.997 Ω | ±4 µΩ/Ω | TBD | at +23 °C | ? days |
| SR104 G0202088930104 | July 3, 2018 xDevs via 3458A | 10000.0012 Ω | ±2 µΩ/Ω | TBD | at +23 °C | ? days |
| SR104 G0202088930104 | June 20, 2018 xDevs via 3458A | 10000.00035 Ω | ±2 µΩ/Ω | TBD | at +23 °C | ? days |
| SR104 G0202088930104 | May 6, 2019 ITRI CMS, QHR 6010D | 9999.9995 Ω | ±0.16 µΩ/Ω | TBD | at +23 °C | ? days |
| SR104 G0202088930104 | February 15, 2020 xDevs DCC | 10000.0026 Ω | ±0.2 µΩ/Ω | TBD | at +23 °C | ? days |
| SR104 G0202088930104 | March 17, 2020 Process Instruments | 10000.0041 Ω | ±0.15 µΩ/Ω | TBD | at +23 °C | ? days |
| SR104 G0202088930104 | June 8, 2021 MI calibration | 10000.0028 Ω | ±0.1 µΩ/Ω | TBD | at +23 °C | ? days |
| SR104 G0202088930104 | February 25, 2022 xDevs 6010B | 10000.00128 Ω | ±0.2 µΩ/Ω | TBD | at +23 °C | ? days |
| SR104 G0202088930104 | August 4, 2022 by xDevs 6000A | 10000.00137 Ω | ±0.1 µΩ/Ω | TBD | at +23 °C | ? days |
| SR104 G0202088930104 | May 11, 2023 by xDevs 6000A | 10000.00153 Ω | ±0.13 µΩ/Ω | TBD | at +23 °C | ? days |
| SR104 G0202088930104 | March 8, 2024 by xDevs 6000A | 10000.0025 Ω | ±0.2 µΩ/Ω | TBD | at +23 °C | ? days |
| SR104 G0202088930104 | May 2025 by xDevs 6000A | 10000.0022 Ω | ±0.2 µΩ/Ω | TBD | at +23 °C | ? days |
| SR104 G0202088930104 | September 4, 2025 by xDevs 6000A | 10000.0032 Ω | ±0.2 µΩ/Ω | TBD | at +23 °C | ? days |
| SR104 G0202088930104 | October 12, 2025 by xDevs 6000A | 10000.00358 Ω | ±0.15 µΩ/Ω | TBD | at +23 °C | ? days |
| SR104 G0202088930104 | March 28, 2026 by xDevs 6000A | 10000.00432 Ω | ±0.2 µΩ/Ω | TBD | at +23 °C | ? days |
| SR104 G0202088930104 | 15.JUN.2026 by xDevs | 10000.00387 Ω | ± 0.2 µΩ/Ω | REF | Previous value before overheating | ? days |
| SR104 G0202088930104 | 16.JUL.2026 by xDevs | 10000.00103 Ω | ± 0.3 µΩ/Ω | -0.293 µΩ/Ω, +0.0? µΩ/Ω/a | 6000A BVD vs FSL935, +22.4 °C well, 0.316 mA | 1 days |
ESI SR104 temperature stability measurements
Second ESI SR104 was also received for interlab transfers between NJ and FL xDevs labs.
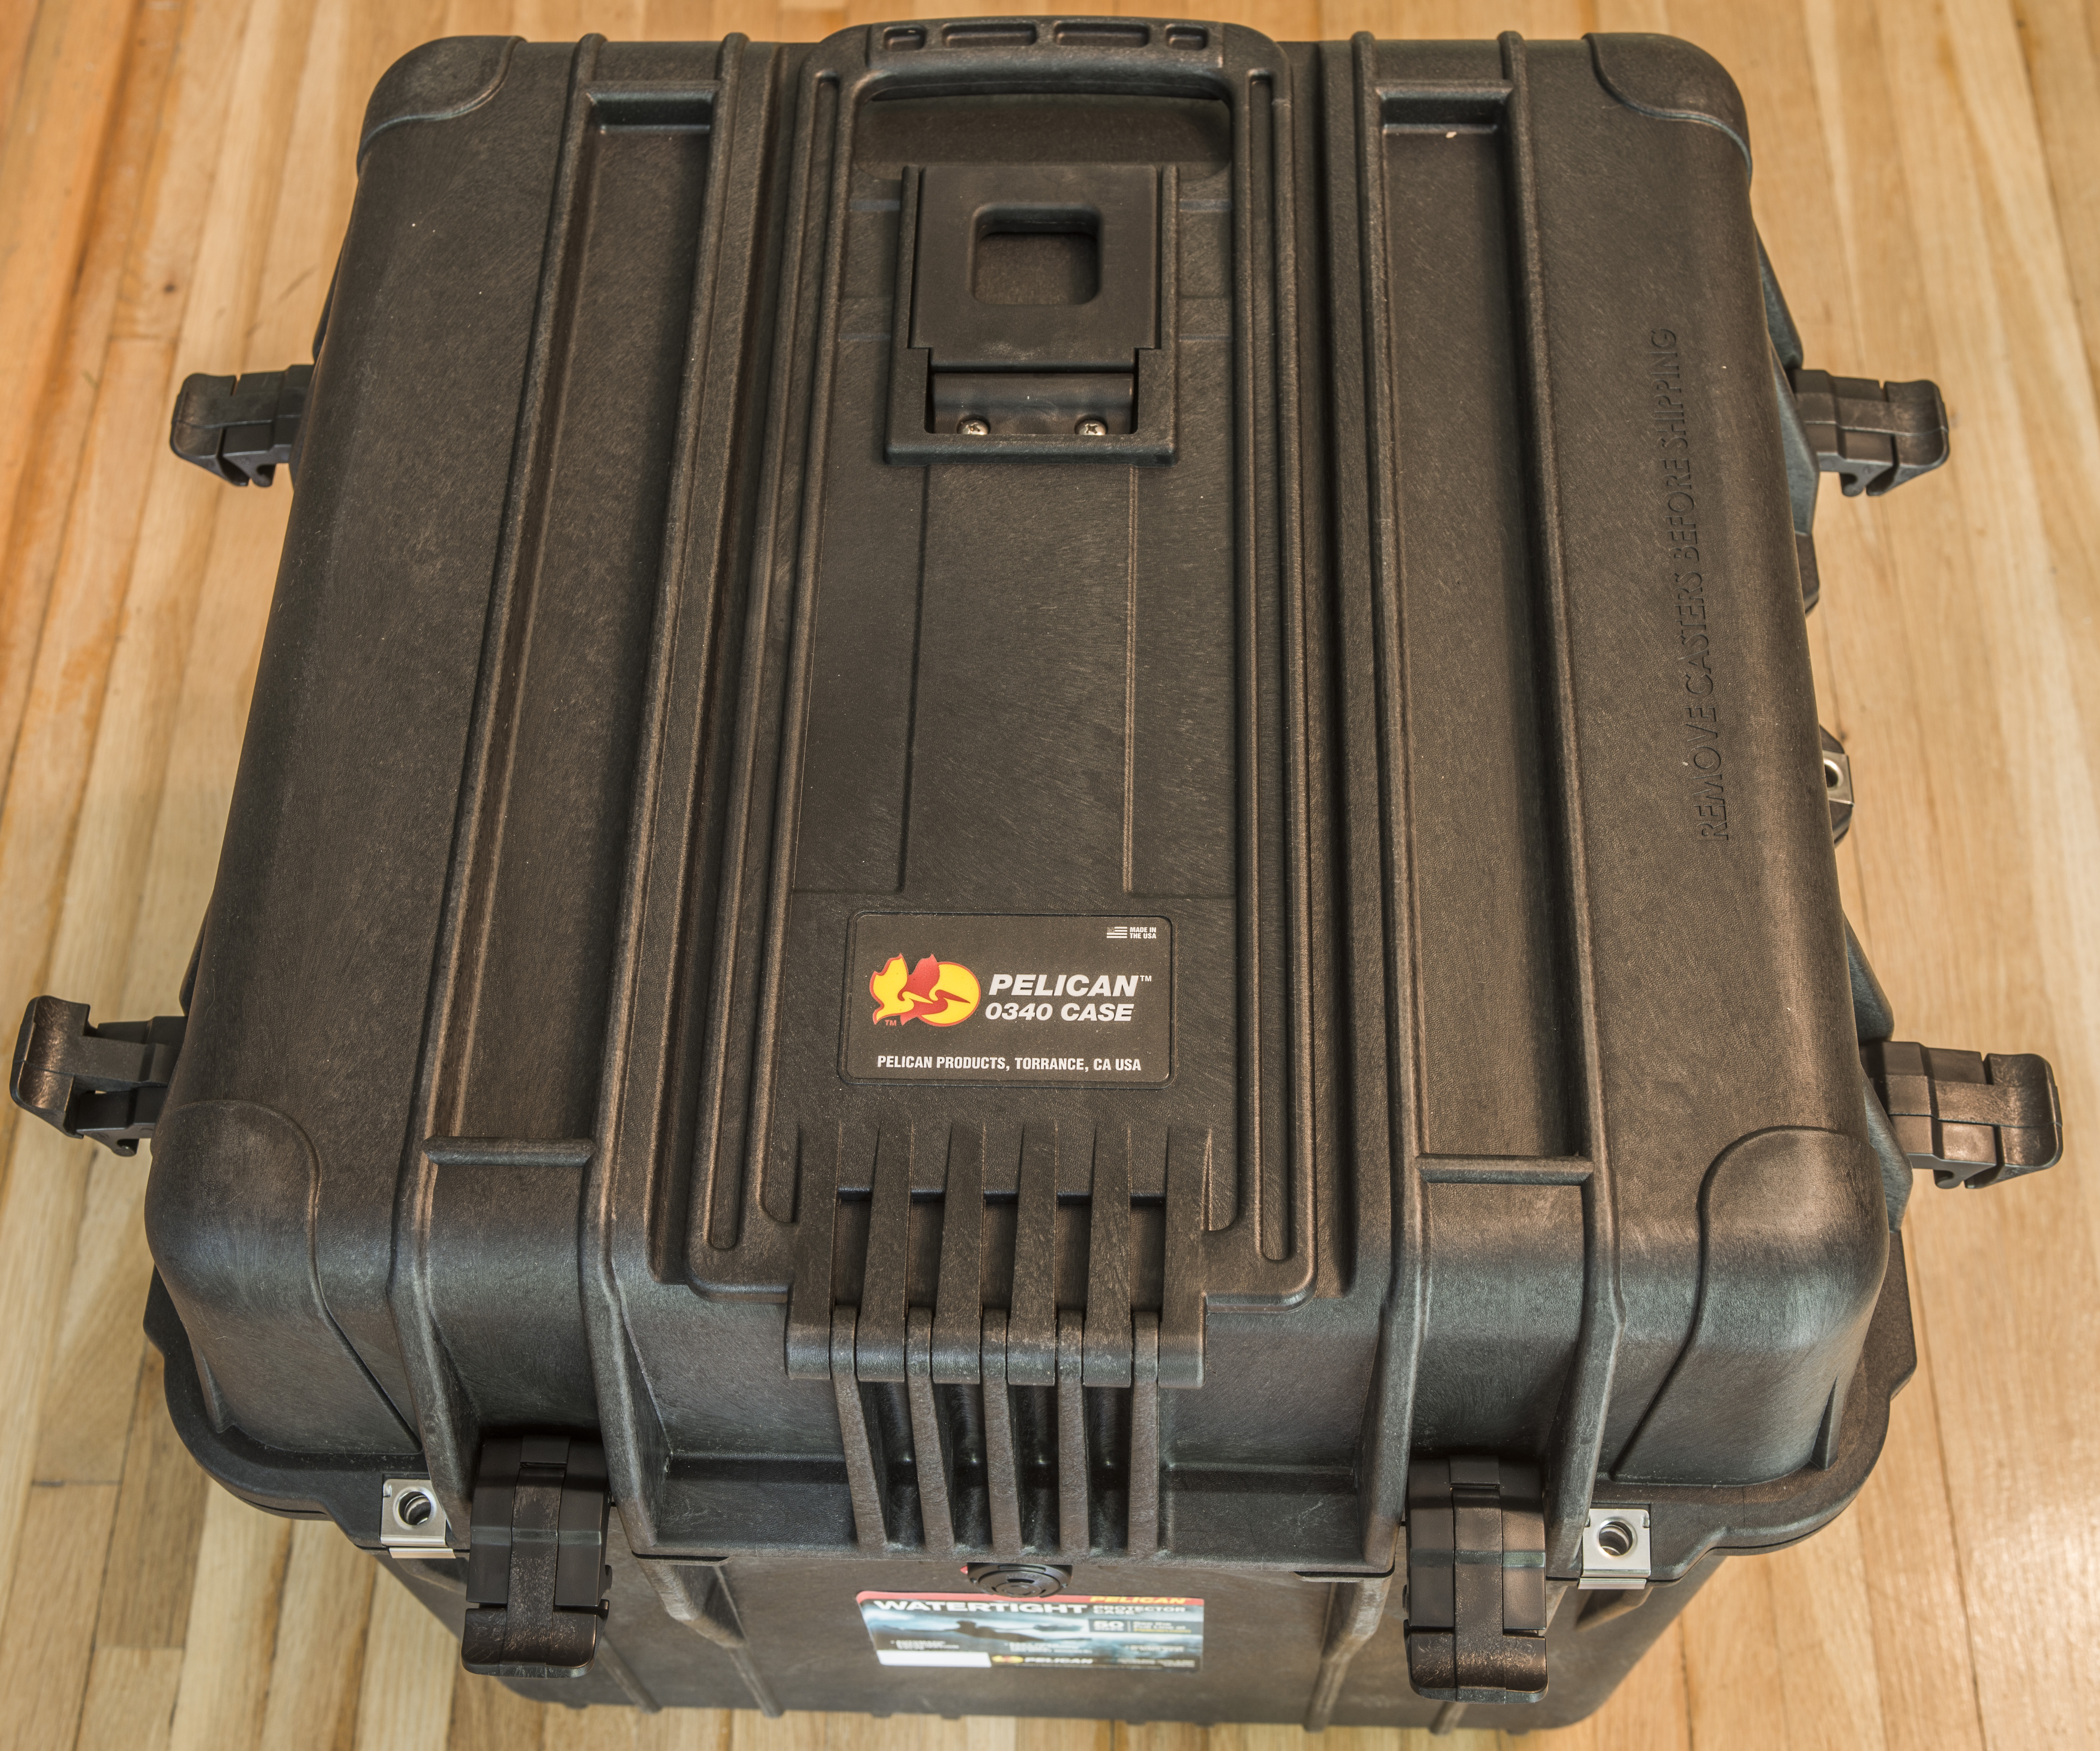
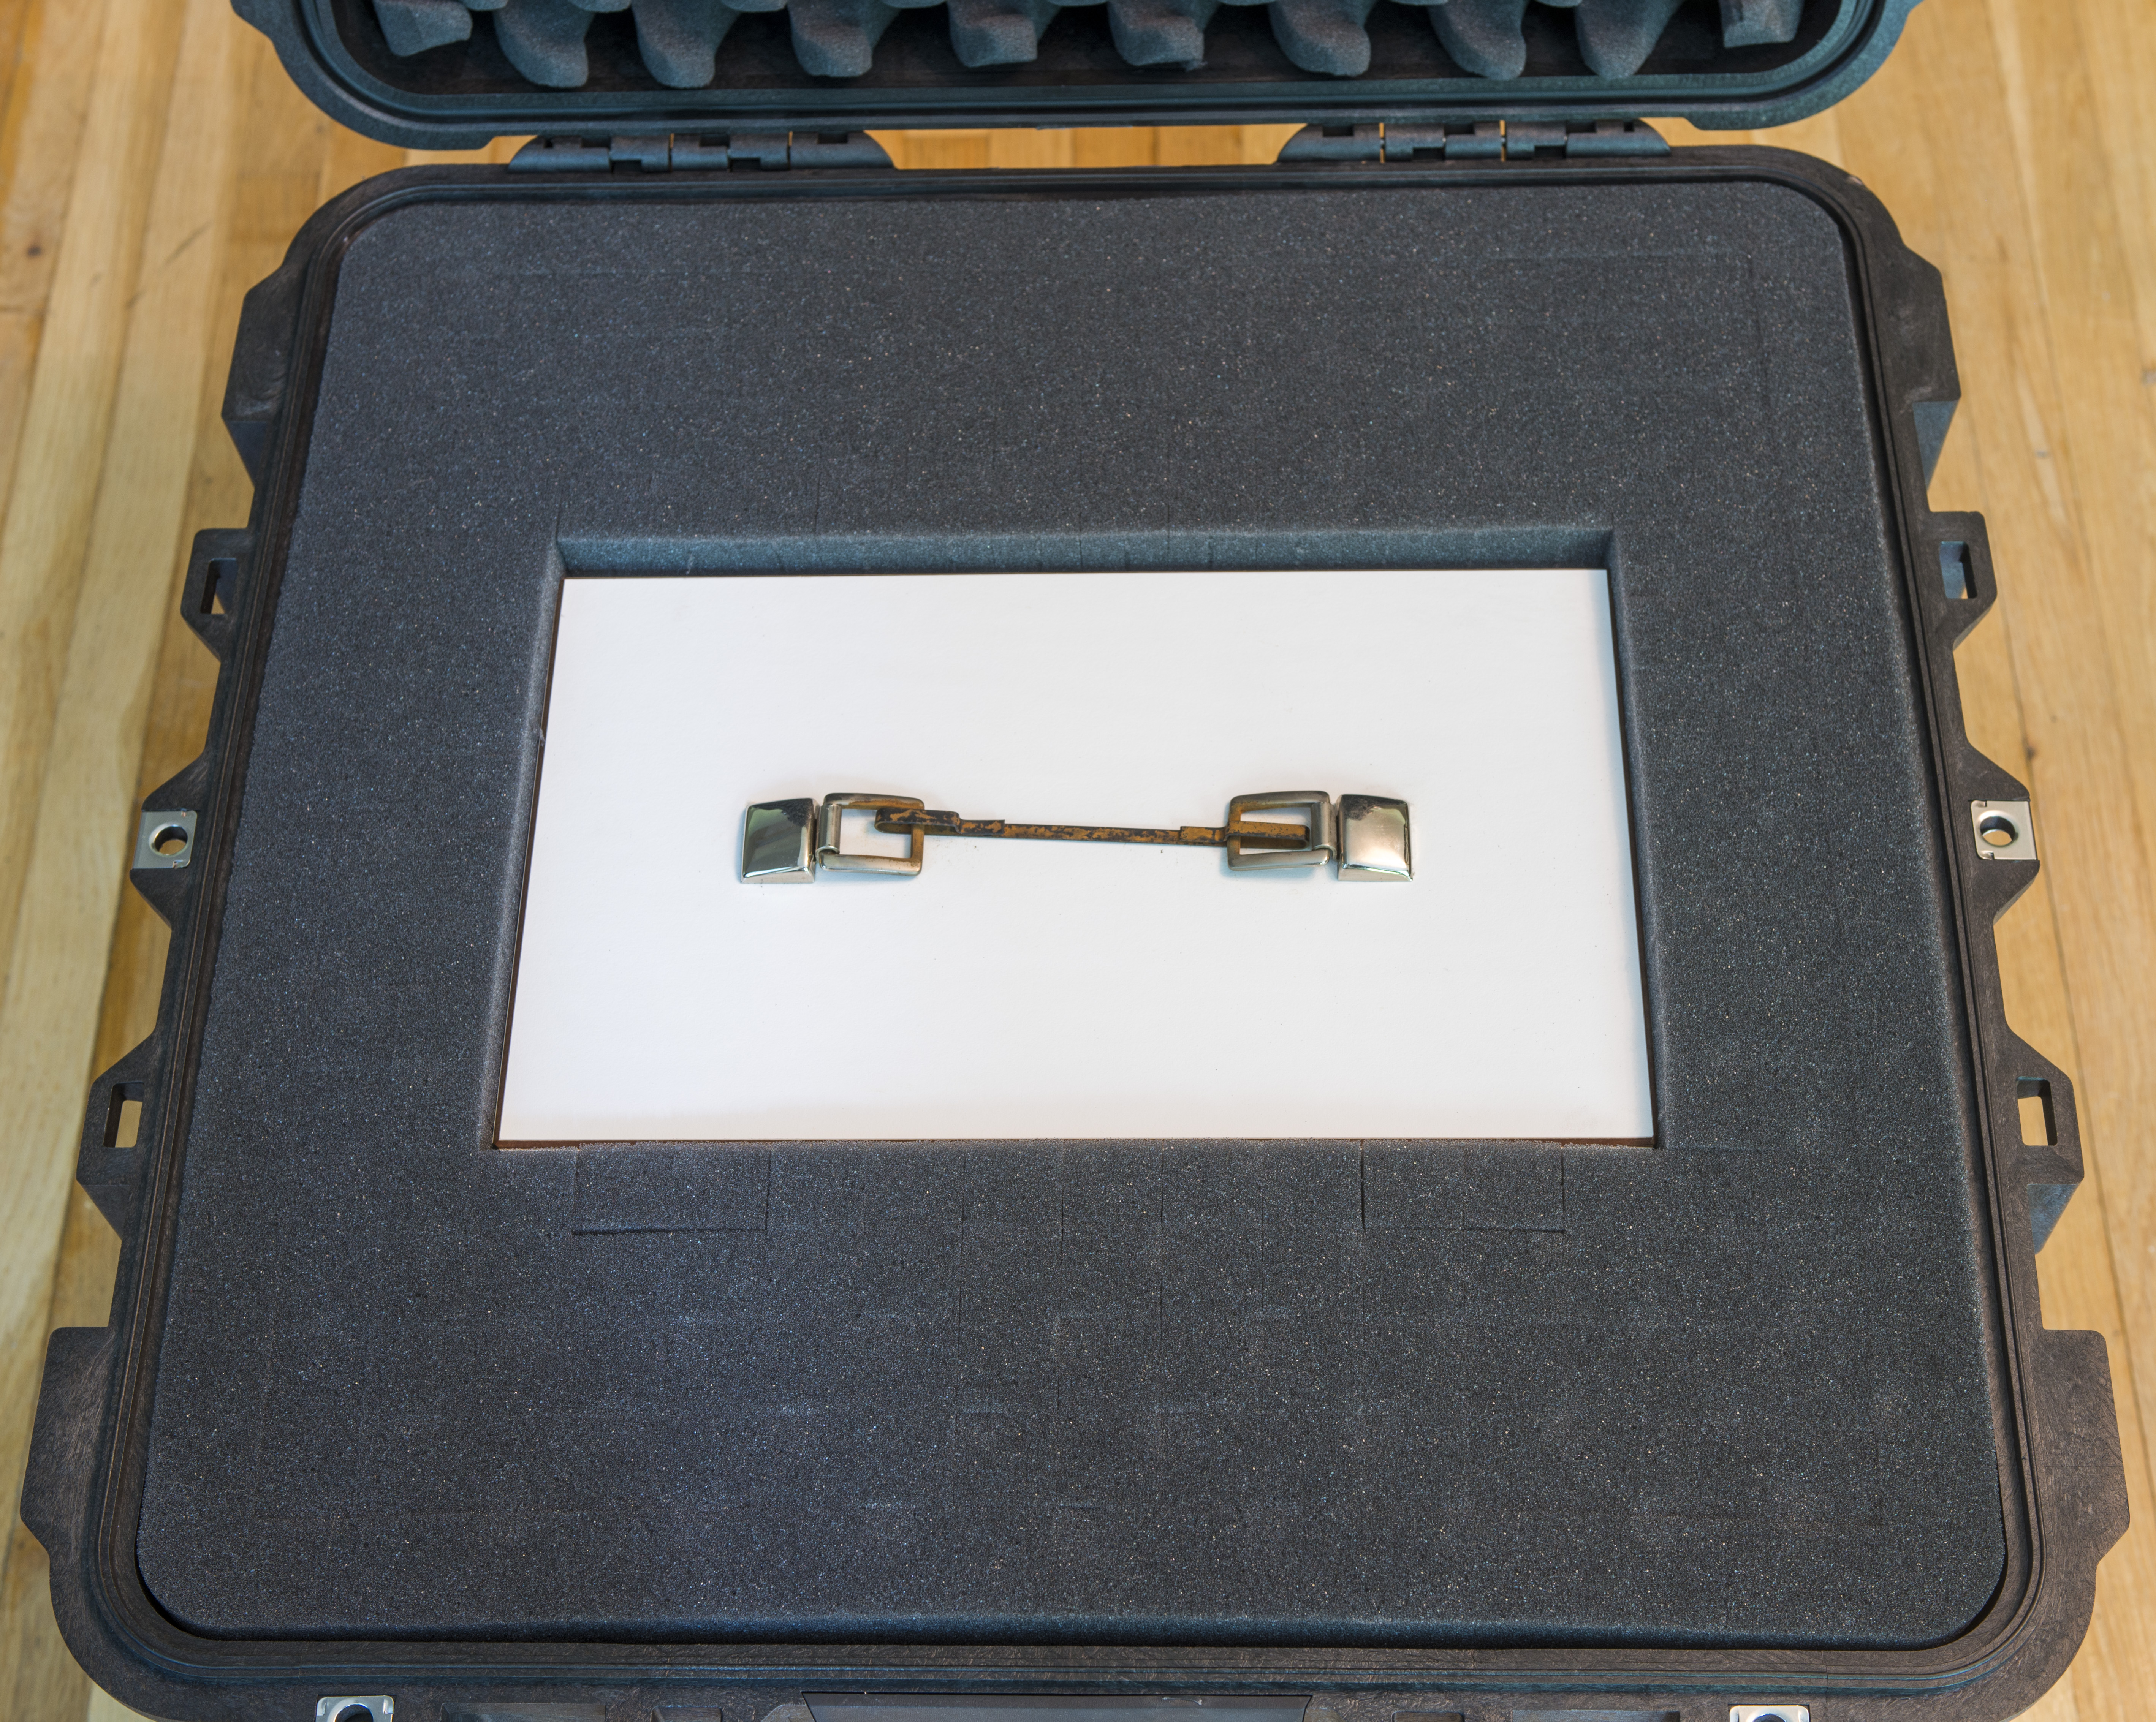
Image 26-27: Second ESI SR104 packing and shipment
Standard was initially shipped in Pelican Cube 0340 foamed hardcase, to ensure minimal stress and shocks to sensitive standard. Externally standard is missing original handle. Instead it has just rusty metal strap attached.
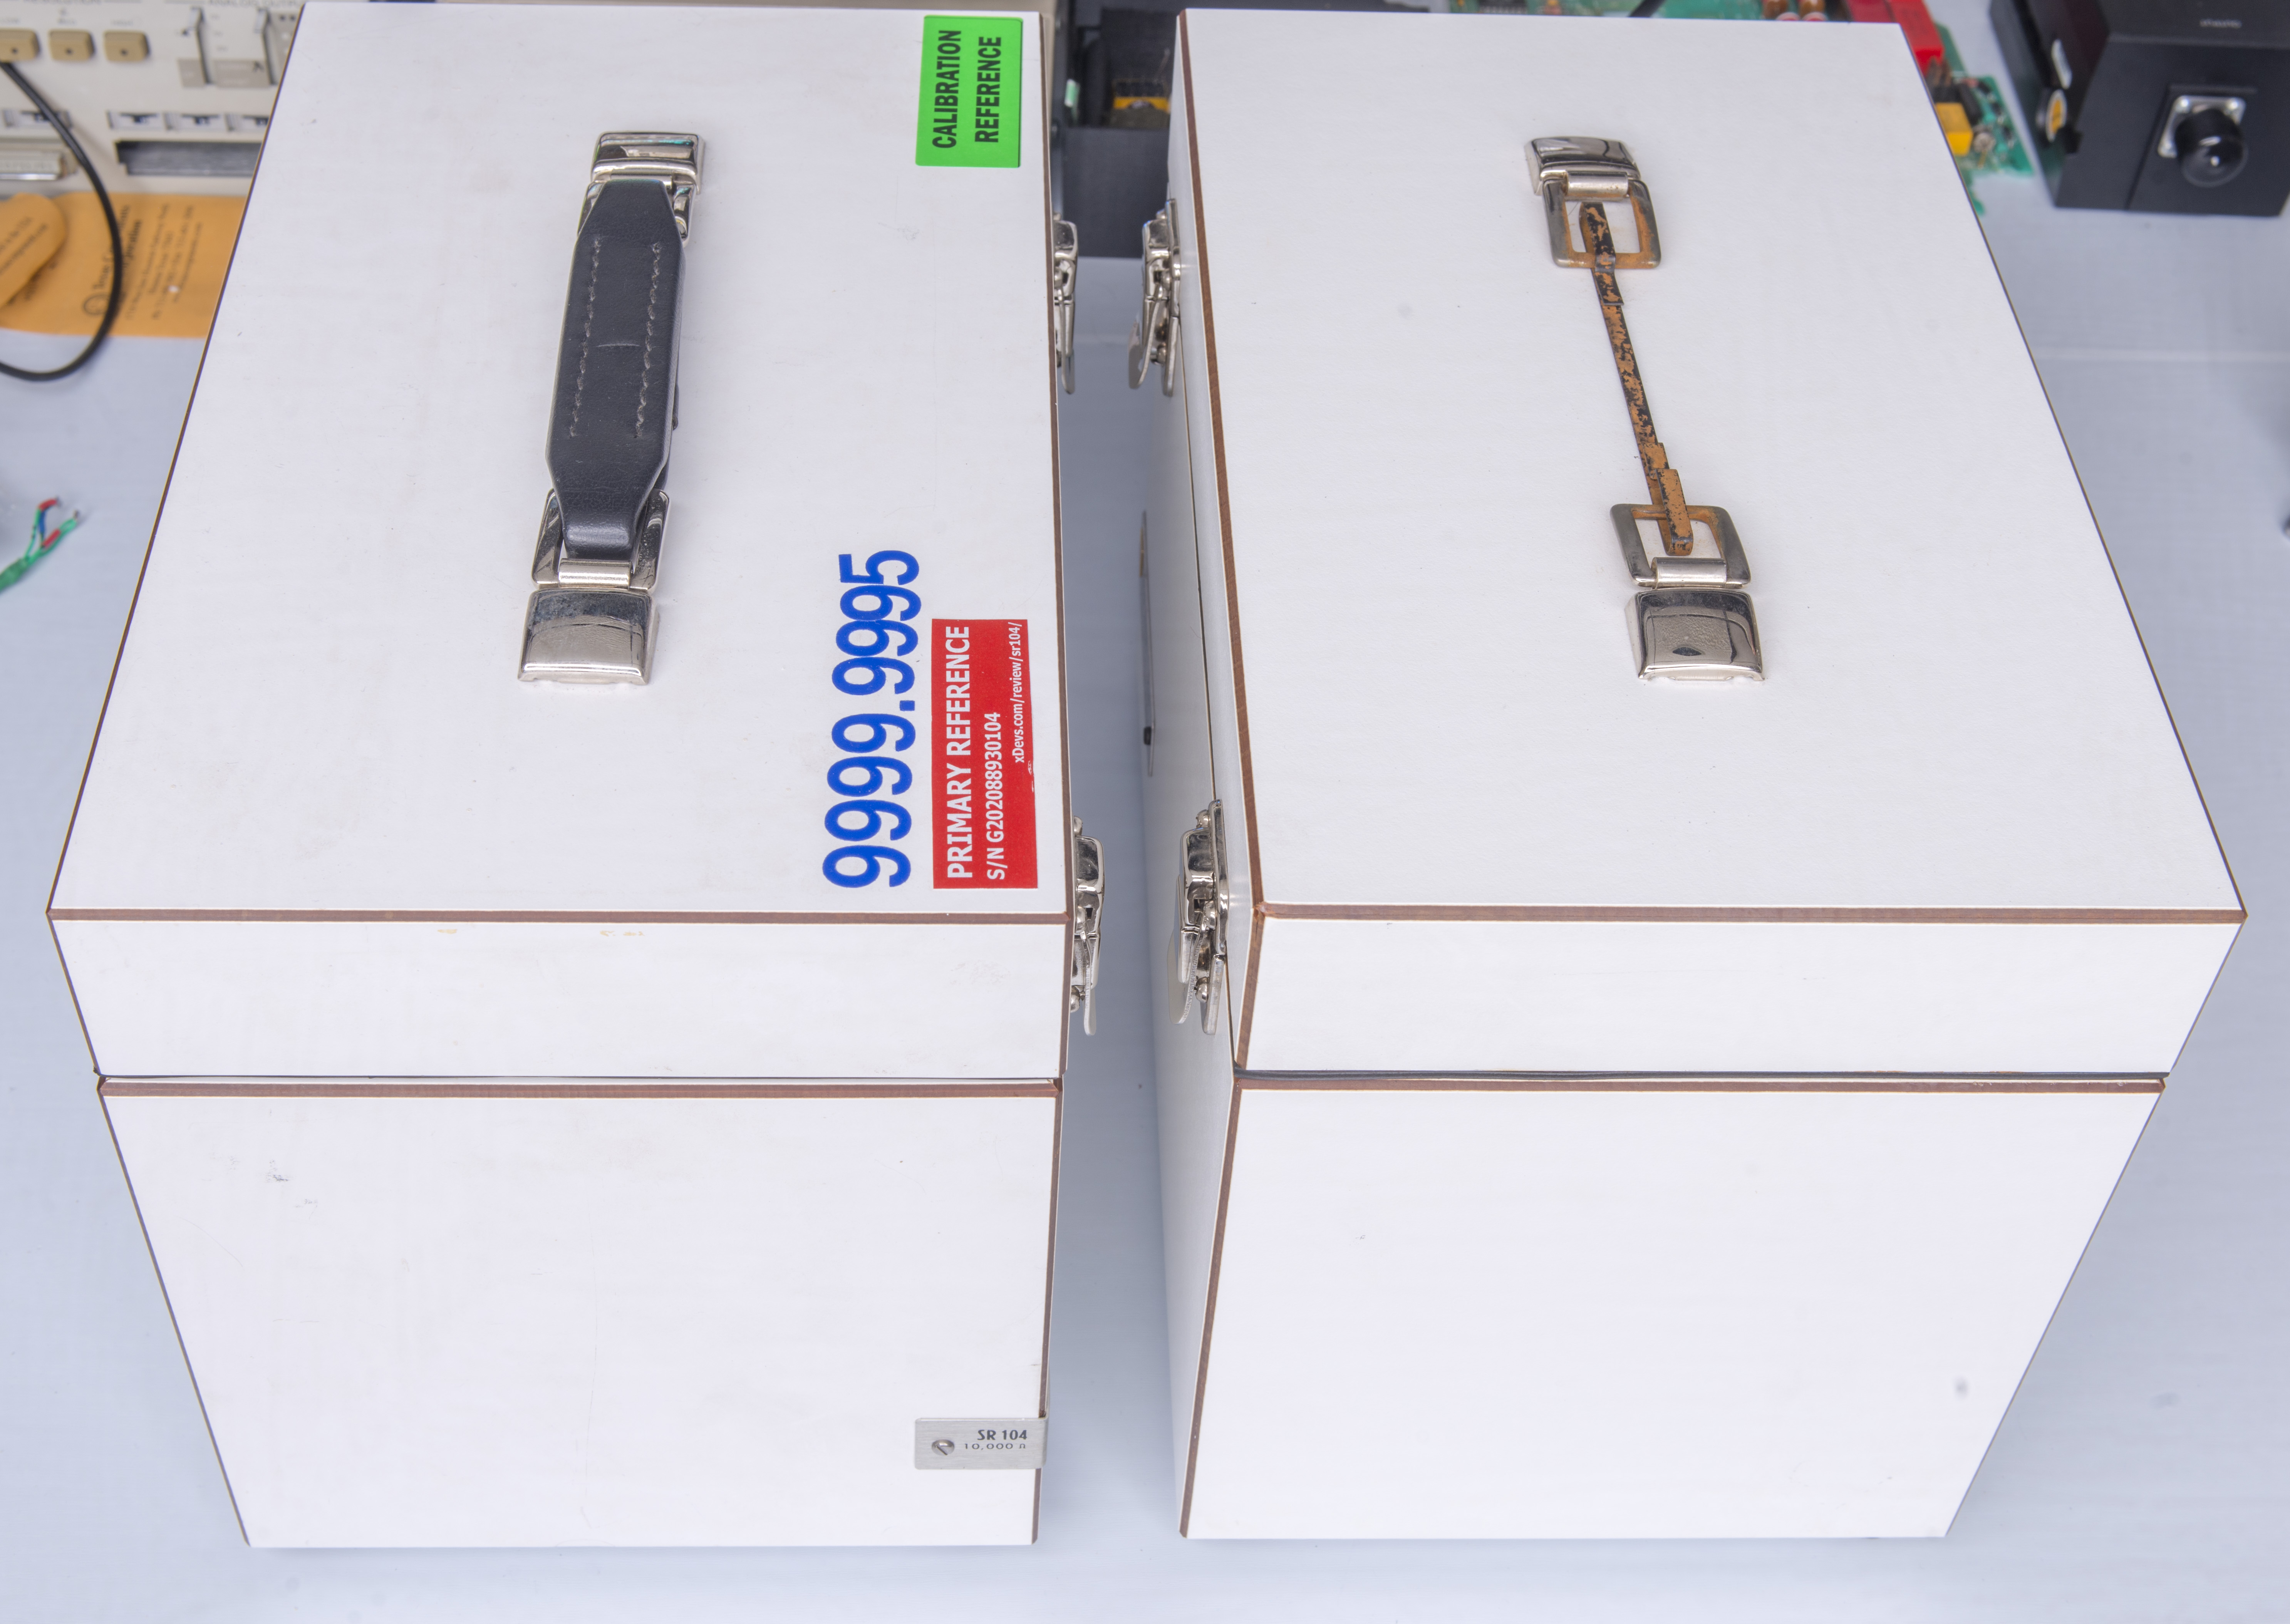
Image 28: Both SR104 side by side
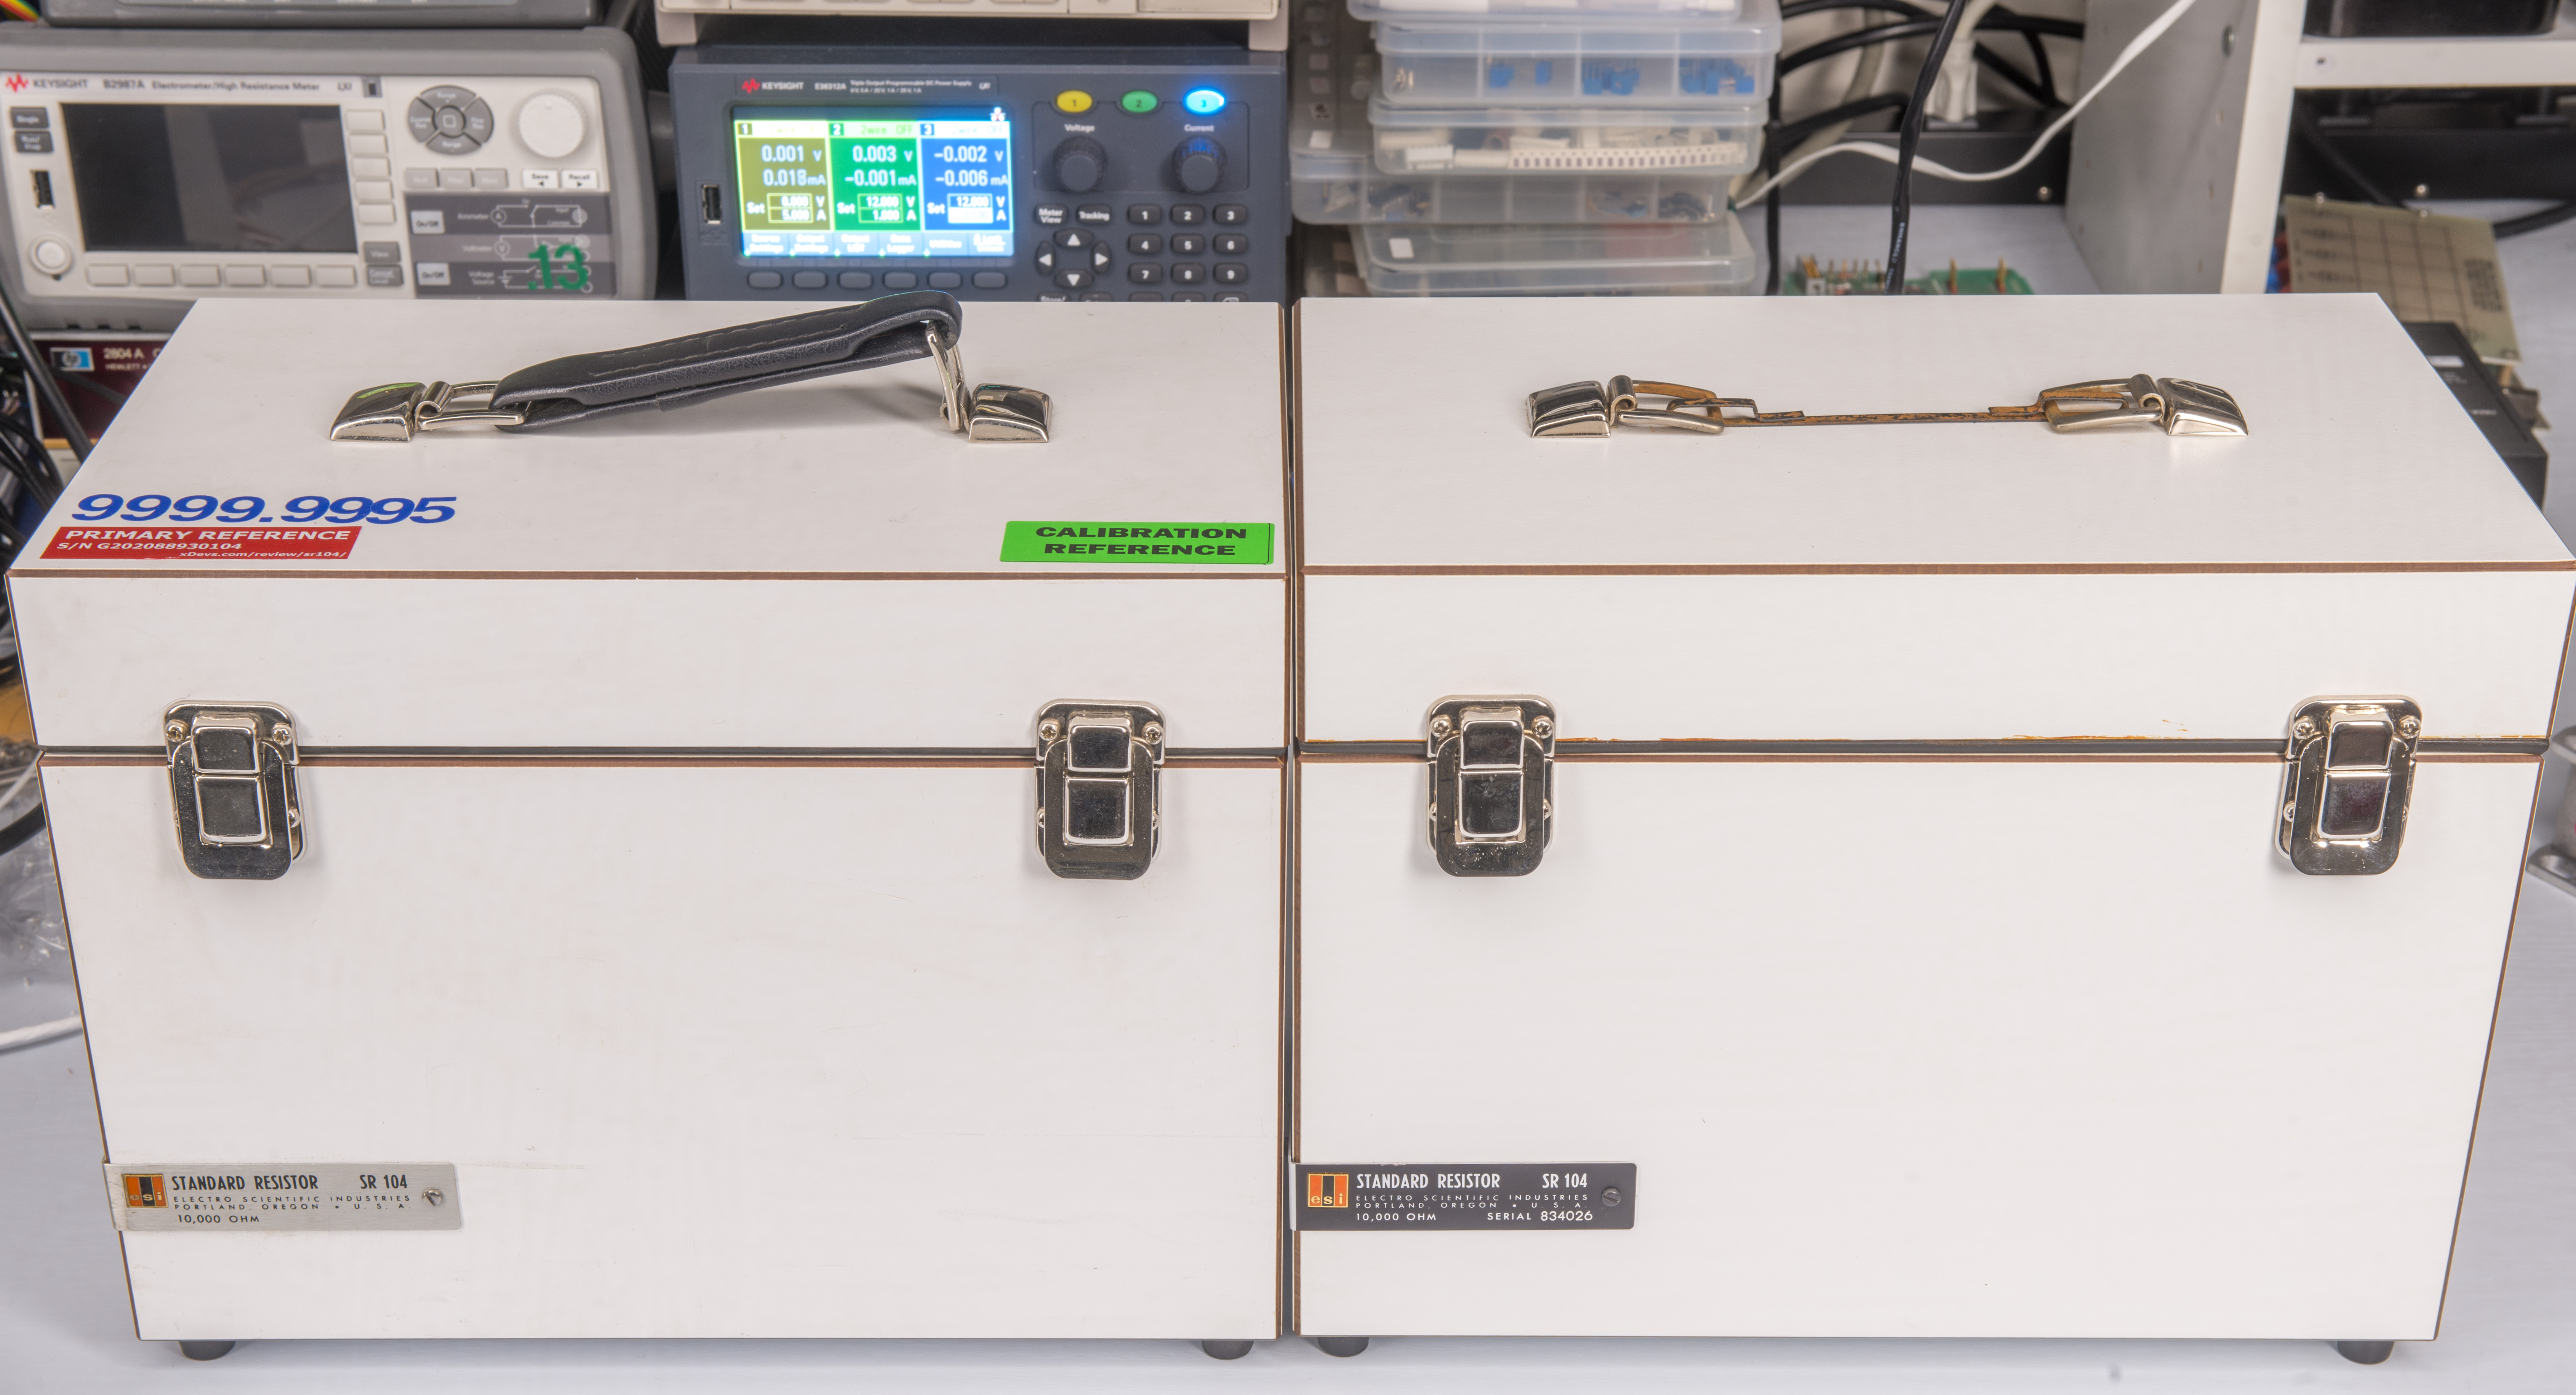
Image 29: Both SR104 side by side
This unit is 20 years older than primary SR104 covered above, manufactured and calibrated on August 29, 1969. That is 52 years ago, to be exact!

Image 30: Factory calibration labels
To monitor the environment condition during shipping transit standard was bundled together with inexpensive AZ 88163 THP USB datalogger. This datalogger store temperature, humidity and pressure readings from internal sensors into memory. Data can be further exported to CSV or PDF report when plugged into computer USB A port.
![]()
Image 31: Secondary SR104 box environment conditions during UPS shipment from Canada to NJ, USA
THP conditions in case with secondary SR104 during transport in October 2020 from Canada was recorded. Data log revealed that standard was kept in temperature range from +18.9 °C to +24.8 °C and humidity was under 63%RH. Two dips in pressure readings indicate two airplane transports between transit airports.
AZ 88163 data report for temperature/humidity/pressure during October 2020 SR104 shipment

Image 32: Connections setup before measurements
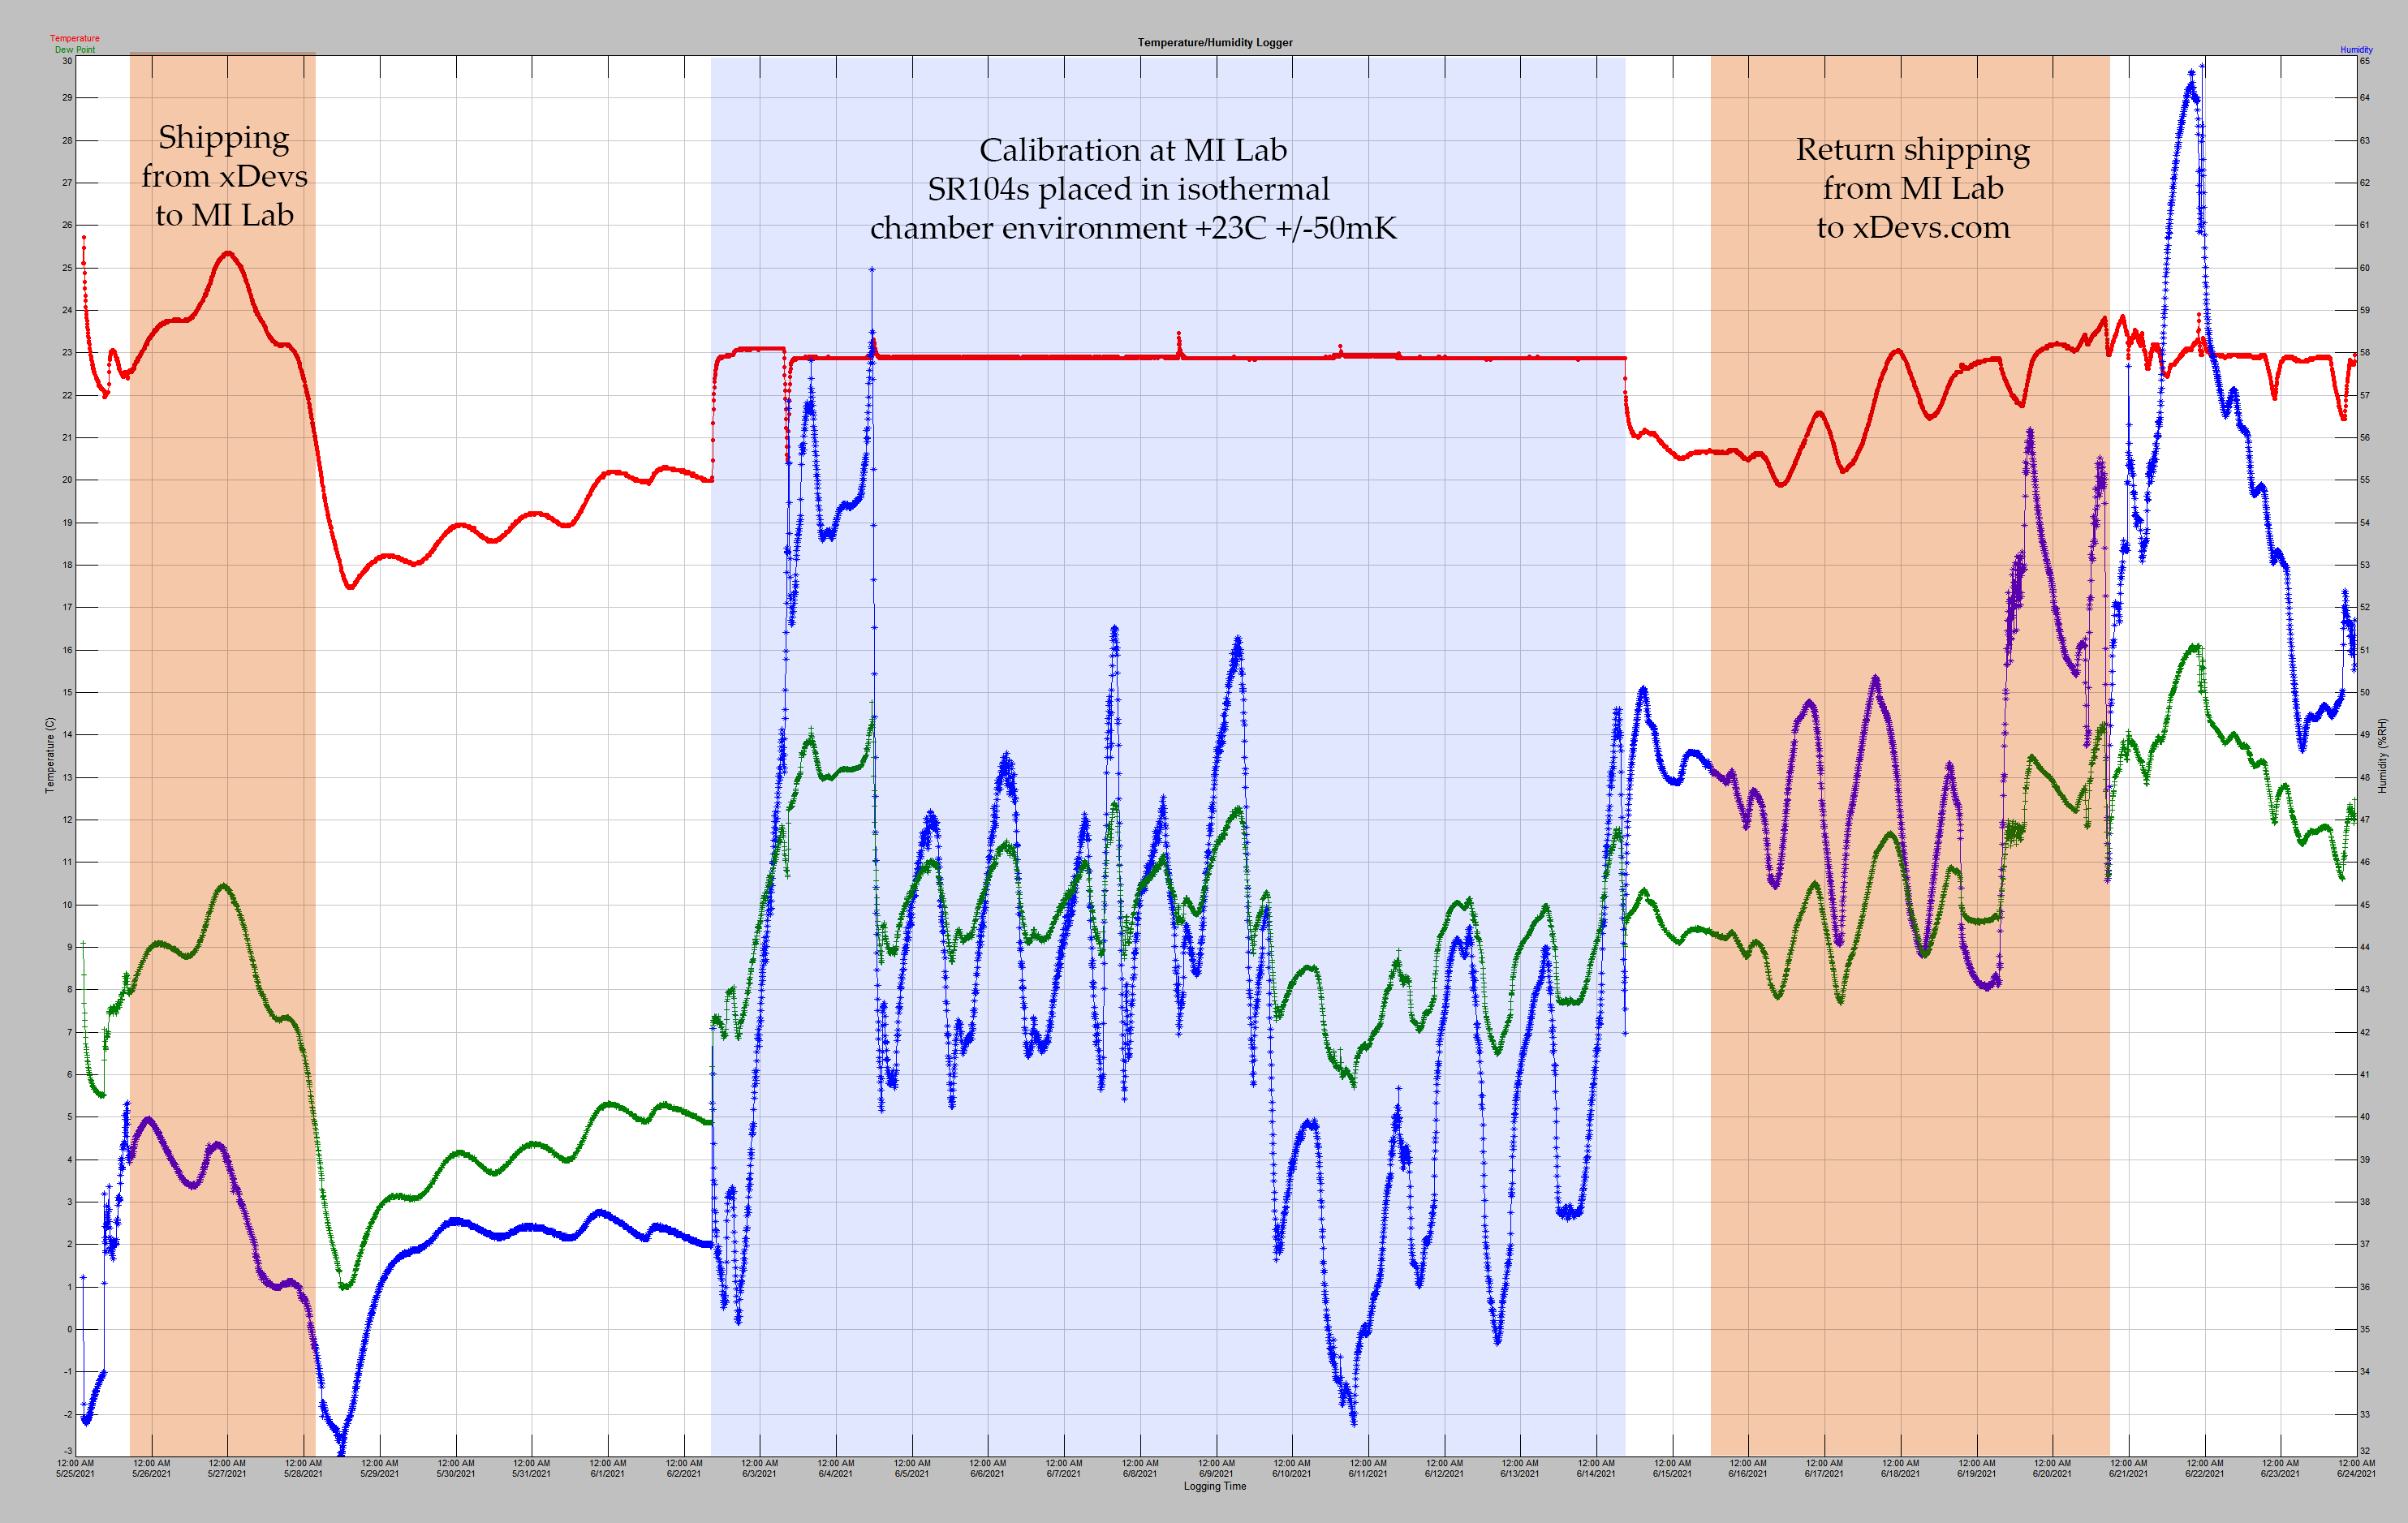
Measurements performed in our new large TEC-driven air bath xDevs.com chamber . Both SR104s were placed in chamber and wired to external Datron 1281 8½-digit multimeter .
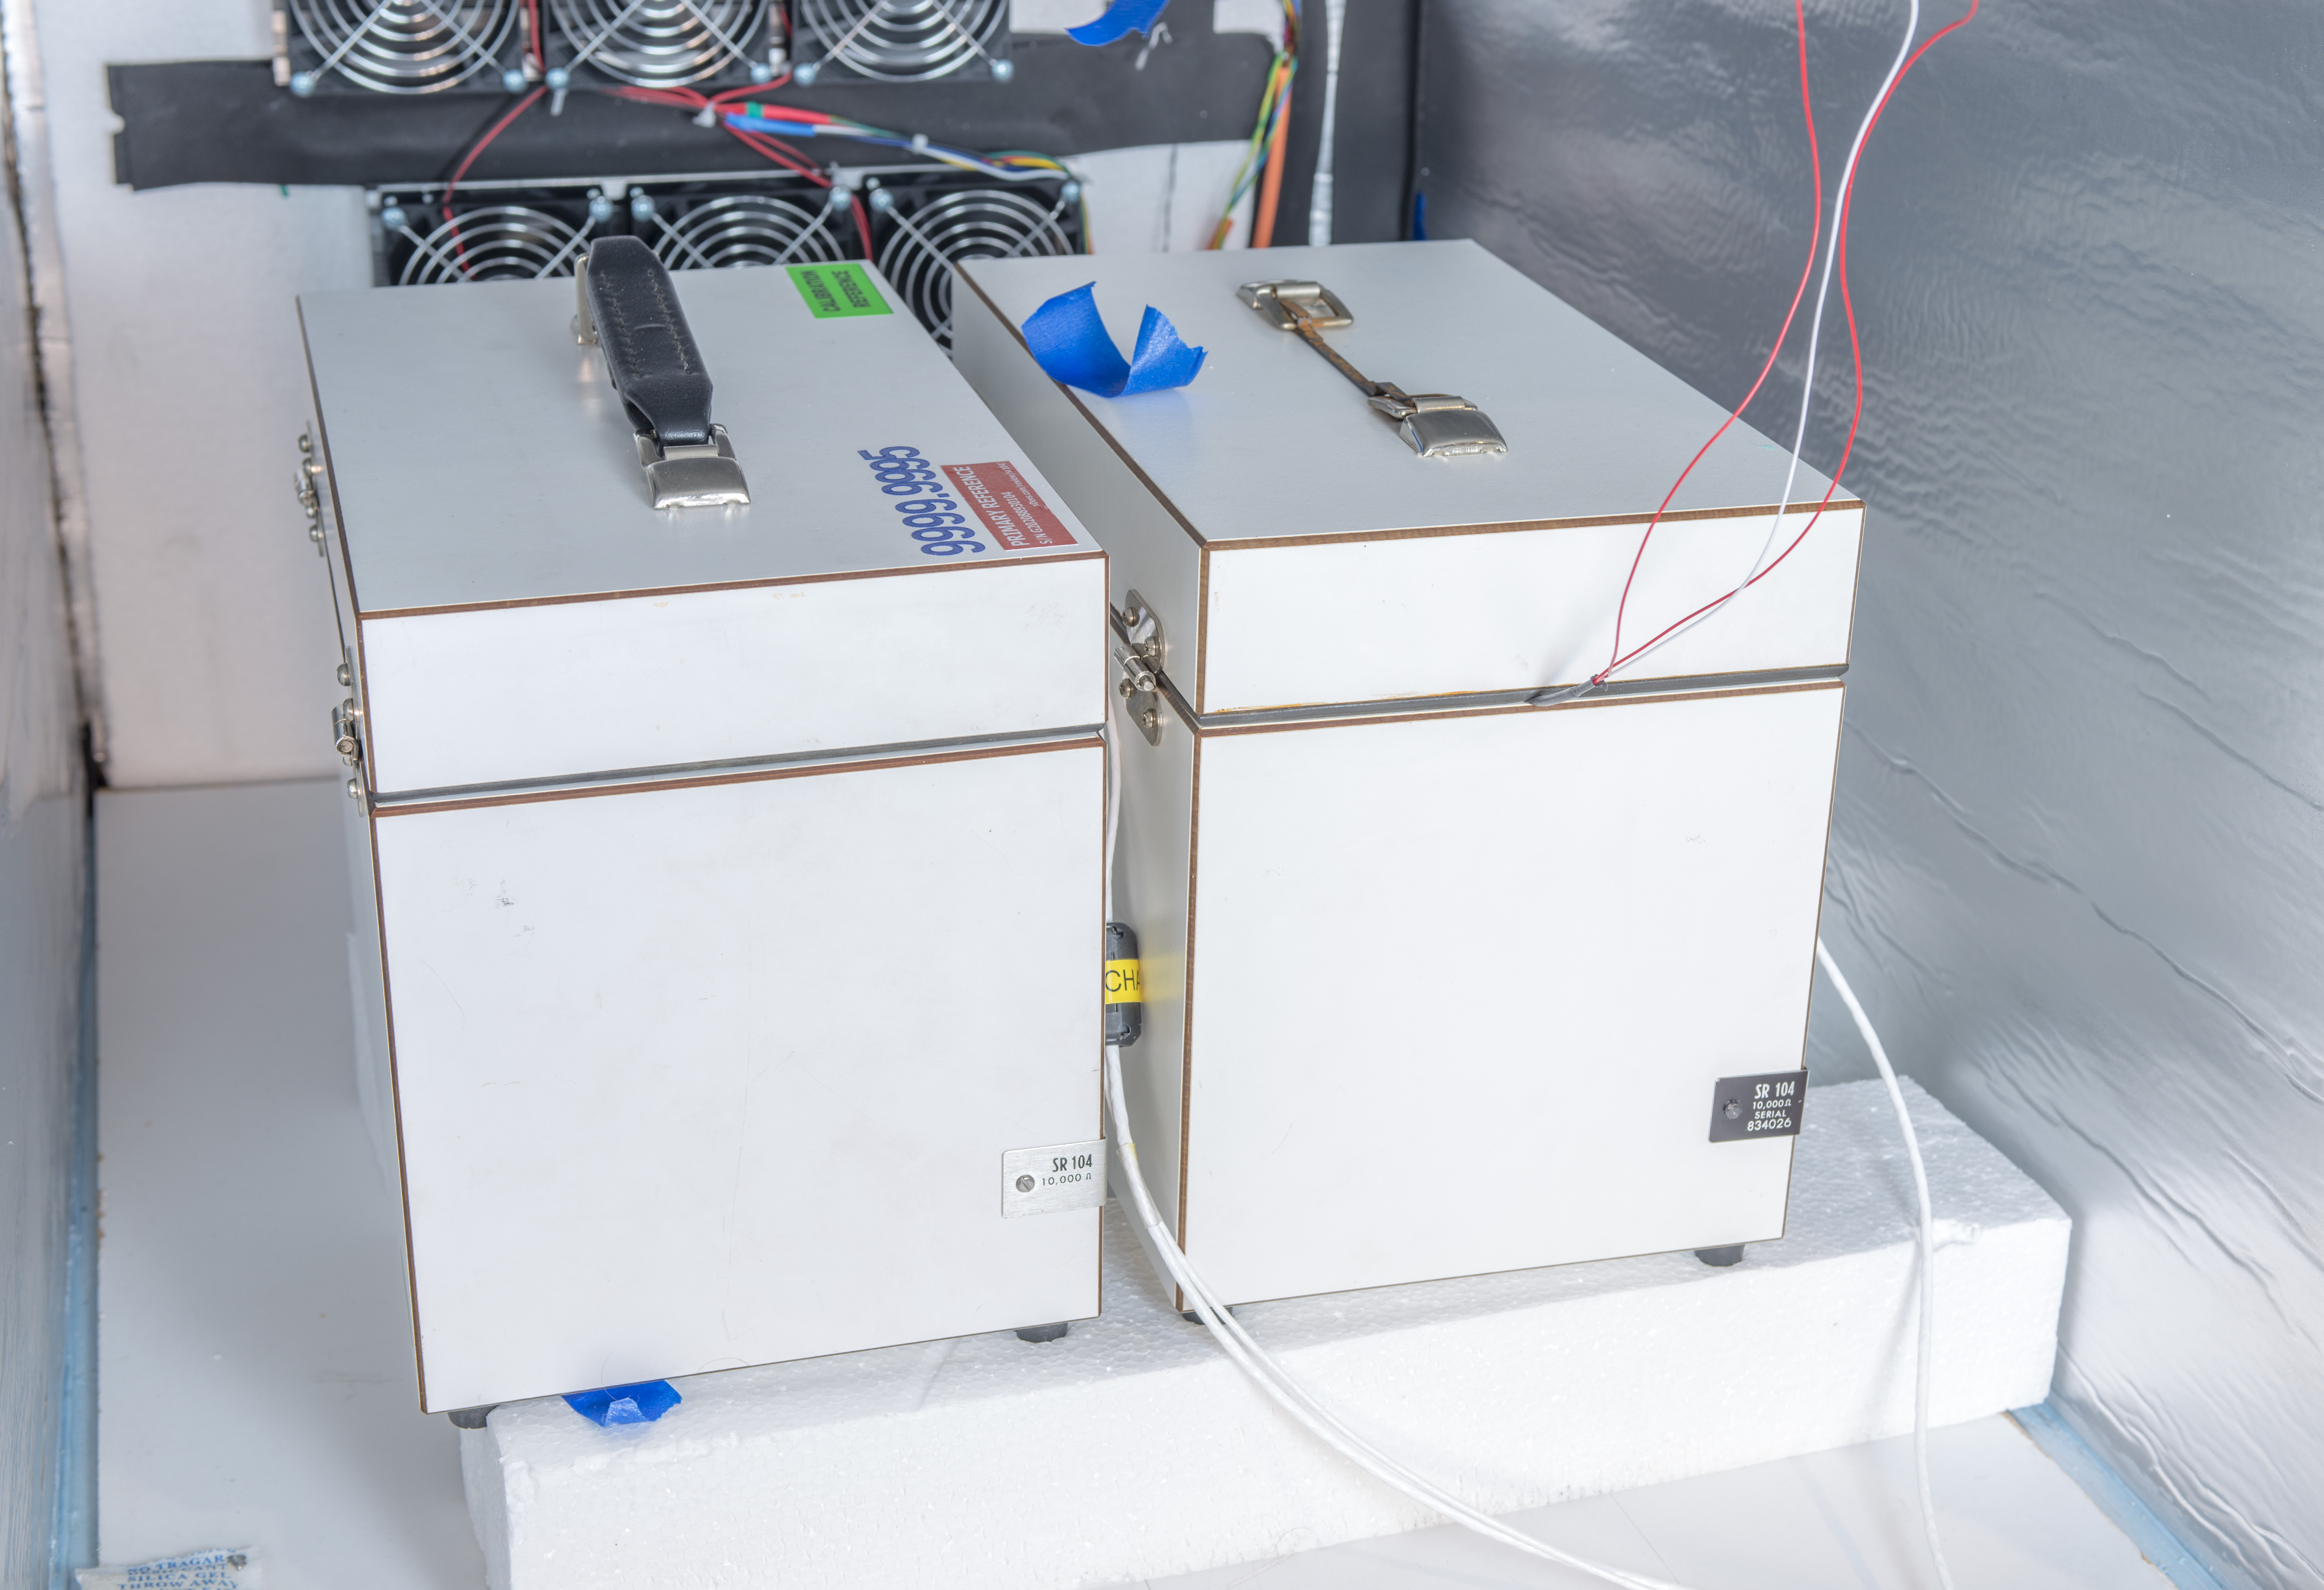
Image 33: DUT and REF SR104 in chamber
3rd check standard (Fluke SL935) used as the verification source to ensure that Datron 1281 does not have stability or thermal coefficient issues on its own. All three used inputs on Datron 1281 were calibrated and gain corrected to obtain same reading to allow good resistance transfers with three 10 kΩ standards.
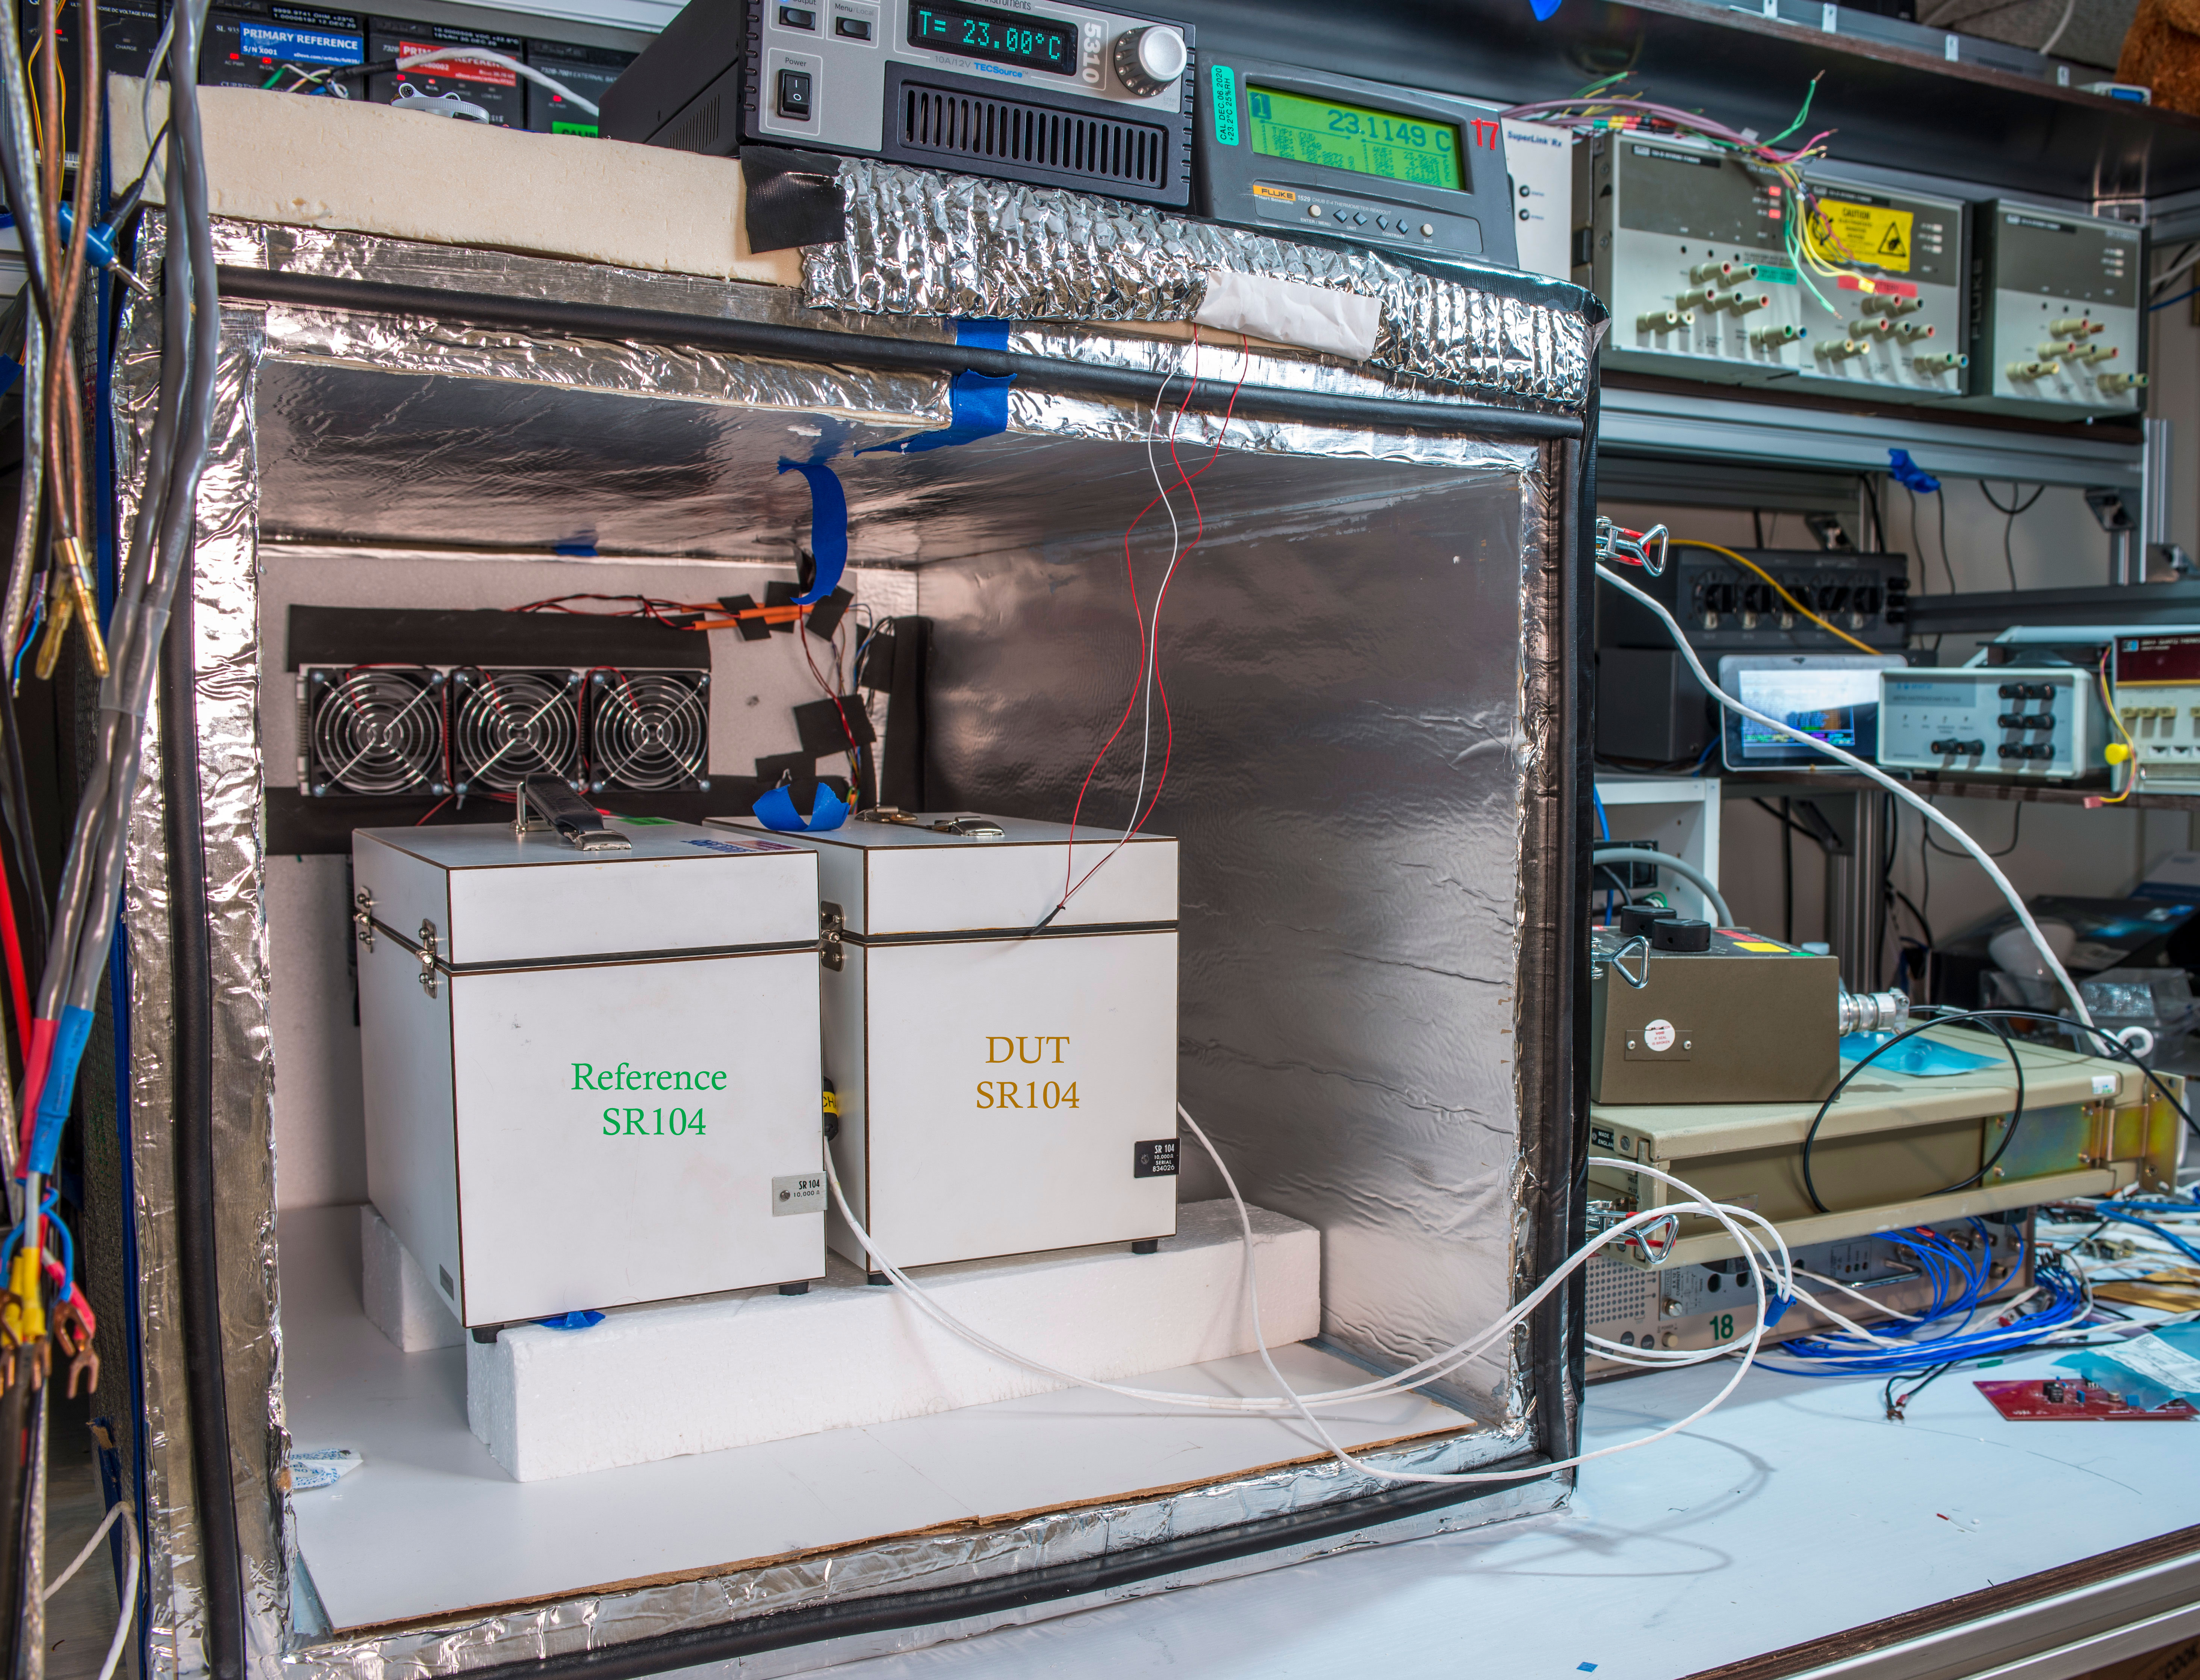
Image 34: Both SR104 ready for measurements
DUT SR104 internal temperature was measured with calibrated Fluke 1529 Chub-E4 thermometer readout and Omega RTDCAP-100A platinum 100 Ω PRT. PRT sensor was inserted in DUT SR104 thermometer well. Lids on both SR104 standards were closed to protect terminals from air drafts and reduce thermal gradients.
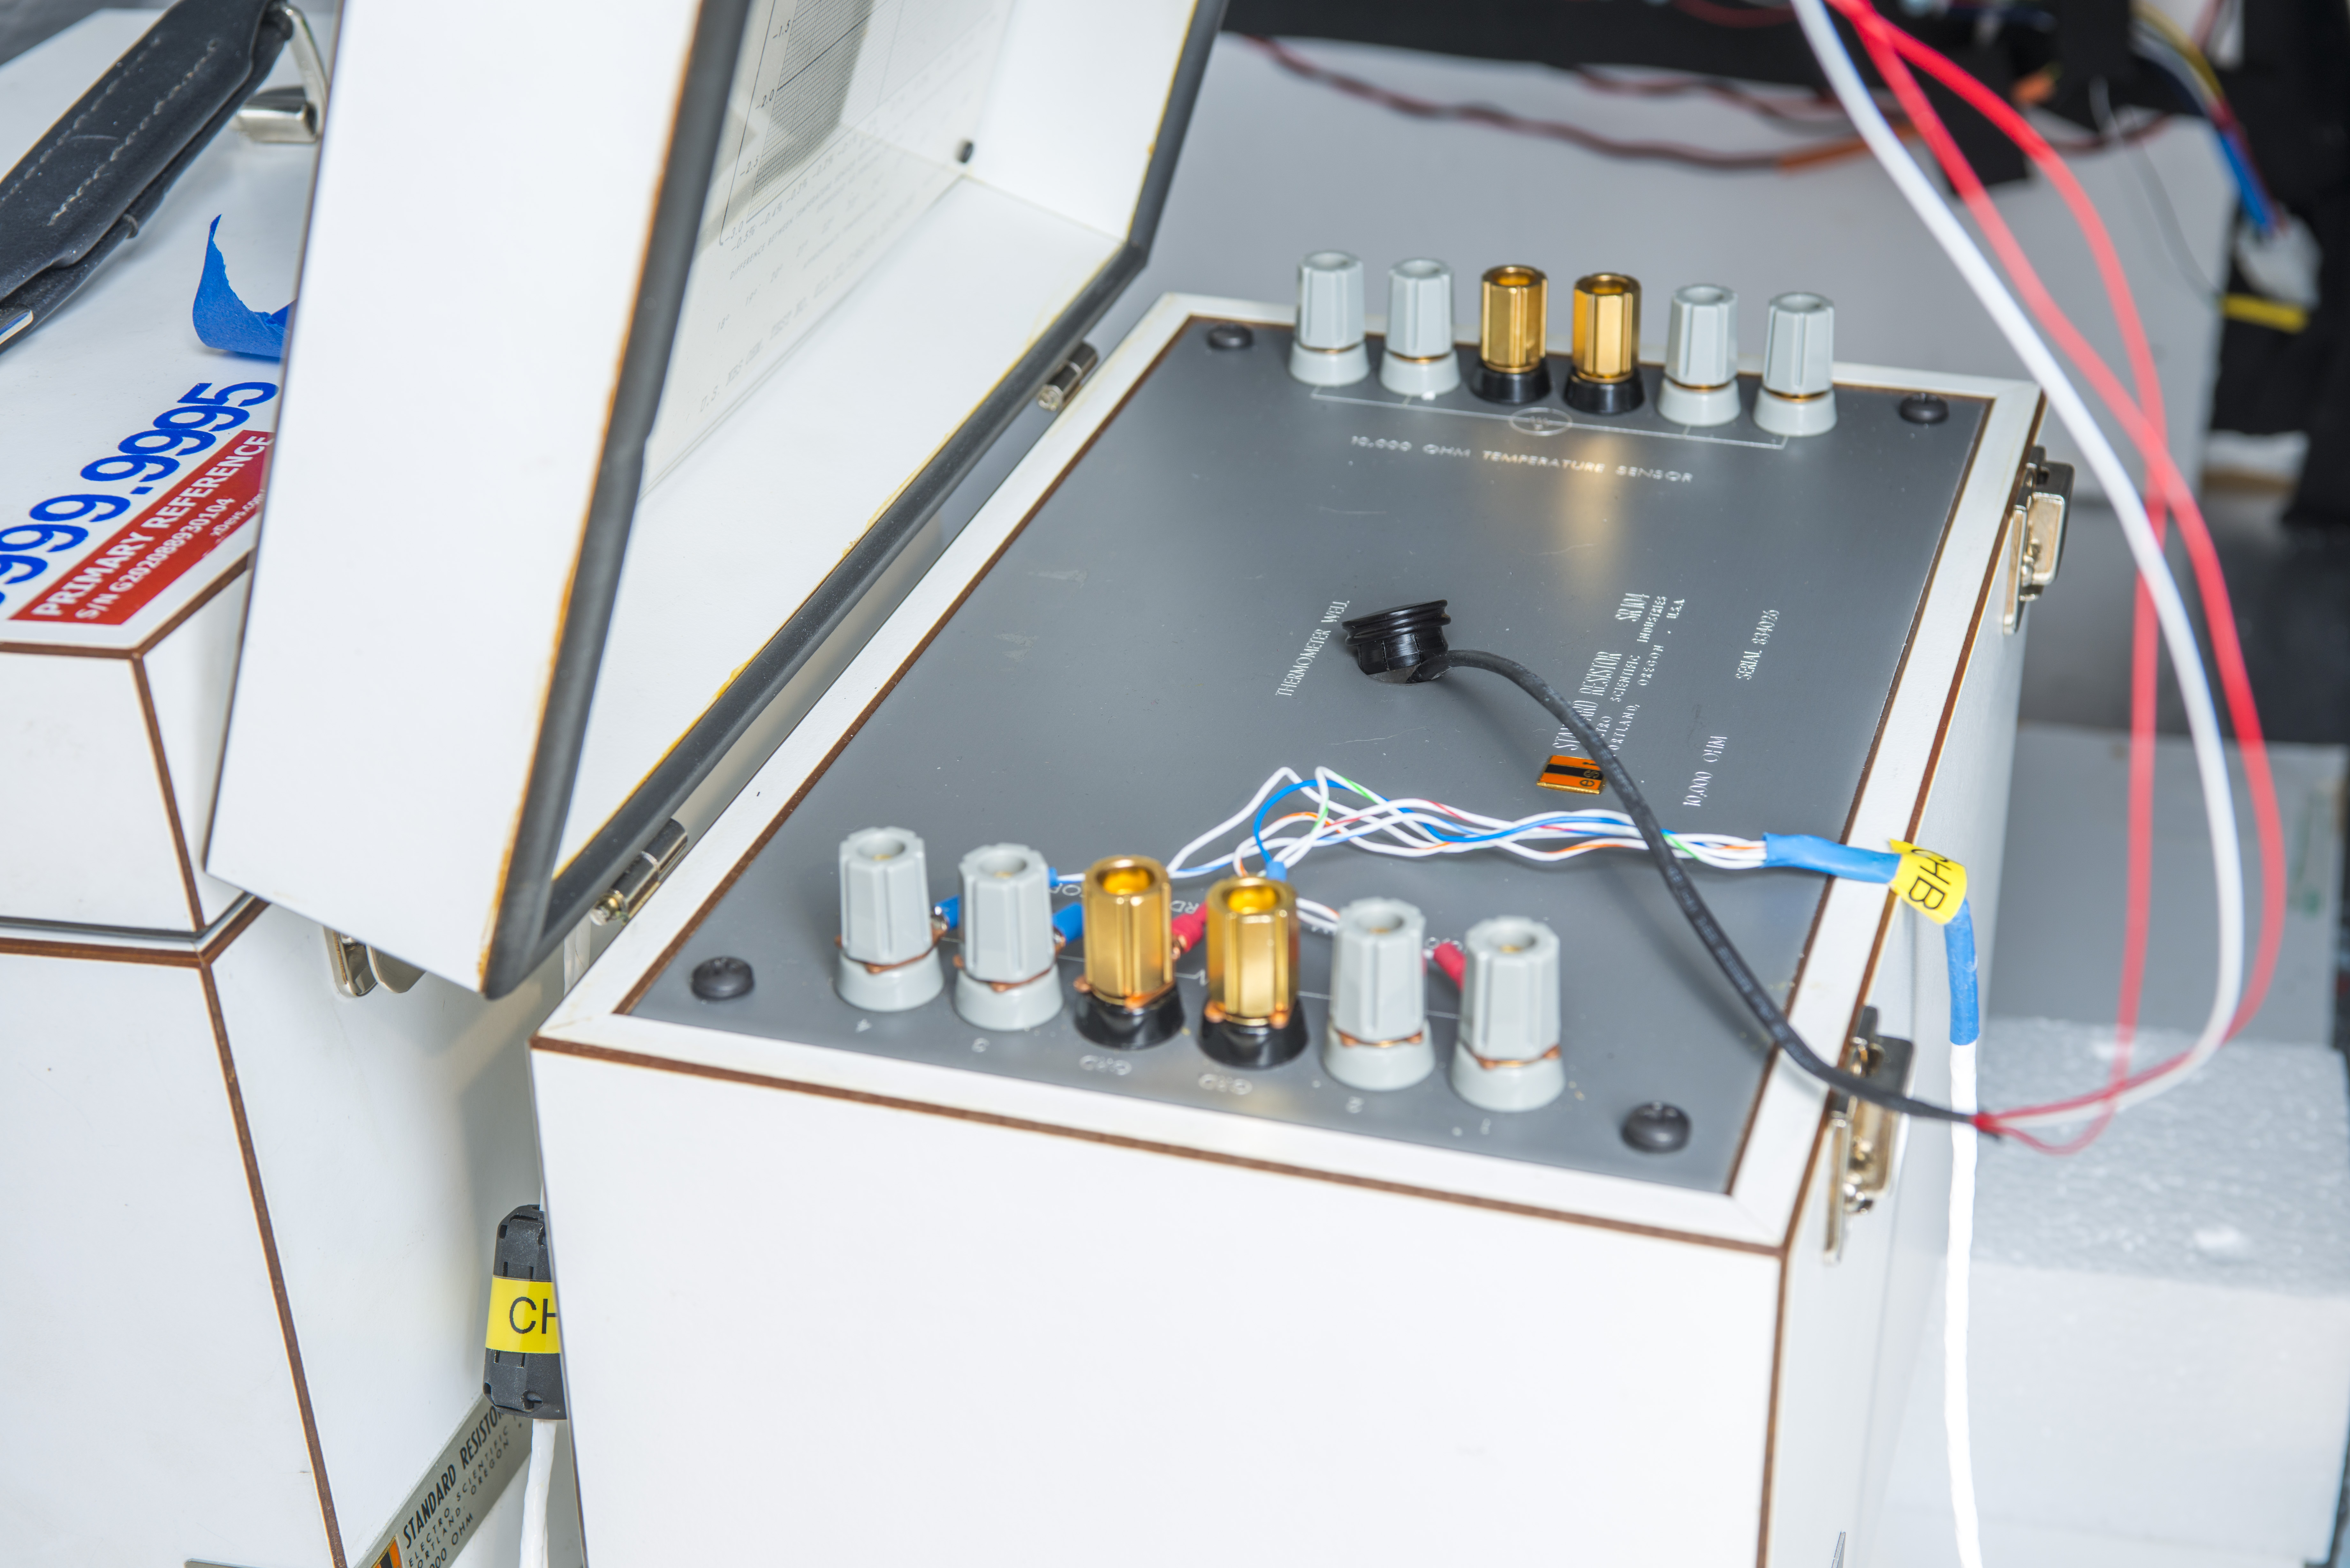
Image 35: Installed PRT sensor for temperature coefficient measurement
Test run was automated using xDevs.com’s Python app TECKIT and Keysight E5810A GPIB interface . Initial temperature in airbath was set to +18 °C then temperature was slowly increased to +23 °C where it was kept for 4 hours. Next temperature ramped to peak +28 °C to hold for 8 hours. Then thermal slope was reversed and final temperature +18 °C was obtained again. Temperature slope speed was fixed at 0.00694 °C/minute. Settings used for TECKIT are:
sv_start            = 18.000     ; Chamber start temperature
sv_end              = 18.000     ; Chamber end temperature
peak_temp           = 28.000     ; Top soak temperature
delay_start         = 0          ; Delay before any operation start, seconds
slope               = 24         ; Hours, Time for slope (symmetric positive/negative) ramp
time_start          = 12         ; Hours, Initial hold temperature time, before positive slope starts
time_dwell          = 4          ; Hours, Dwell temperature duration time at peak-start/2 temperatures
time_hold           = 8          ; Hours, Hold temperature duration time once reached peak_temp
time_end            = 12         ; Hours, Final temperature duration once ramp-down finished
slope_shape         = lymex_step ; Advanced shape type, lymex_step = soak time_start in middle of the ramps
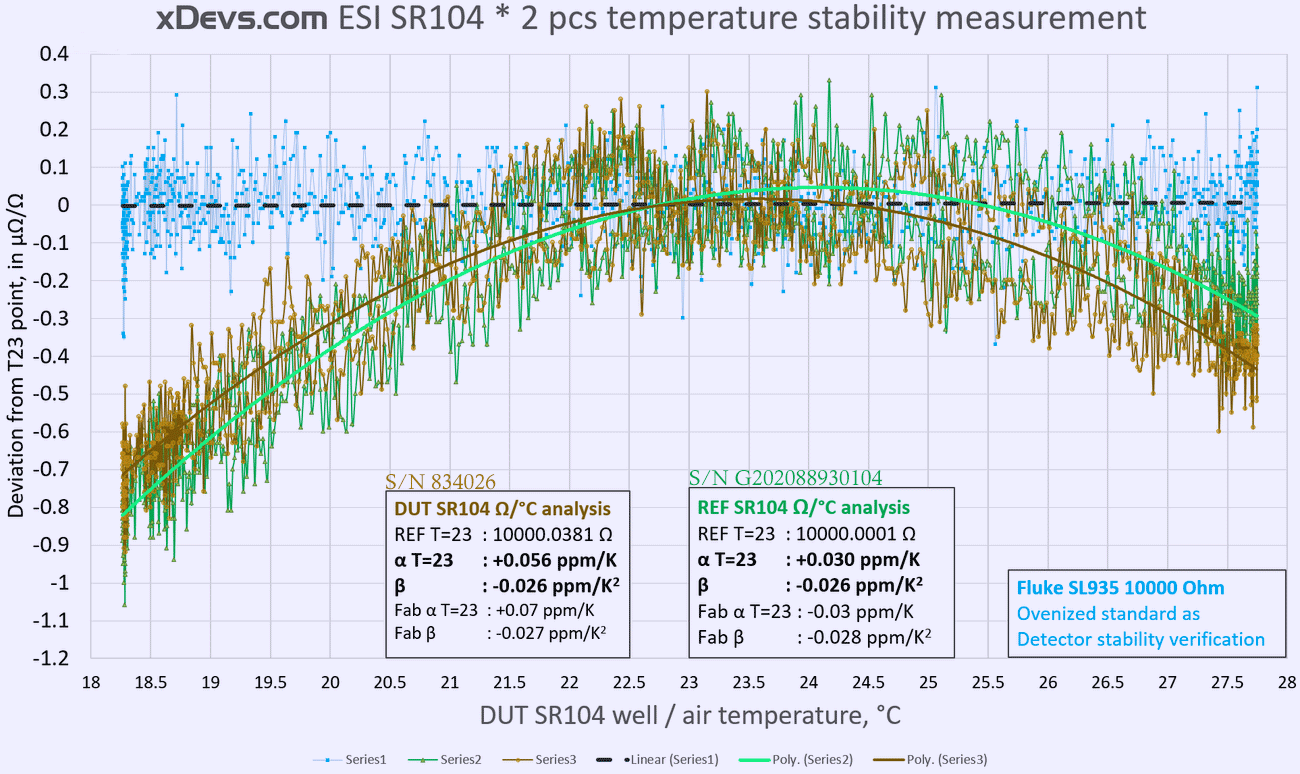
Image 36: Resistance temperature coefficient results after 84 hour run.
Results are pretty good. First we can notice relatively large amount of noise due to DMM internal current source and low voltage amplifier noise. Overall noise is about 0.3 µΩ/Ω peak to peak. There is also slight hysteresis, which suggests that wire-wound resistive element inside ESI SR104 may require some longer time to recover after 10 °C excursion. This test took 84 hours. Mostly such long time is due to large mass of the oil in SR104’s tank. Such mass caused long thermal delay around 9 hours during the test.
First we can check green reference SR104 data. It was last calibrated year ago by PI on 3/17/2020. Standard was assigned with value 10000.0041 Ω at test current 300 µA with uncertainty ±0.15 µΩ/Ω, but I have low confidence in this result, as previous history on this standard and our own measurement transfers suggest value around 10000.0026 Ω ±0.2 µΩ/Ω instead.
Re-calibration in June 8, 2021 at Measurements International lab with amazingly low ±0.1 µΩ/Ω uncertainty confirmed my ESI SR104 value at 10000.0028 Ω. Calibration was performed in MI 9300 air bath chamber at fixed +23.00 °C ±50 mK. Transfer was performed with Measurements International 6010D DCC bridge from their primary ESI SR104 resistance standard. Transfer resistor was oil-bath 1 kΩ unit.
Measurements International xDevs.com SR104 calibration on 6/8/2021
Three other ESI SR104 were also calibrated at same lab and same time and shipped all together. This helped to verify consistant results obtained between labs.
Temperature, relative humidity and pressure inside shipping Pelican iM3075 case and SR104 standards was recorded at all times before, during and after shipping between labs.
Back to previous results. Obtained measurement at temperature point +23 °C equals 10000.0001 Ω ±0.3ppm. Temperature coefficient from lid factory certificate is outlined on a plot with label “Fab α” and “Fab β” values. Measured and calculated α and β shown in bold font. Reference SR104 (green color on plot) have opposite sign α value but β match almost exactly.
52 year old ESI SR104 under test (“DUT” label and plot in brown color) has deviation from nominal +3.81 µΩ/Ω (assigned 10000.0381 Ω ±0.85 µΩ/Ω new value). Measured and calculated α temperature coefficient value is slightly lower than factory (+0.056 µΩ/Ω/°C vs +0.070 µΩ/Ω/°C). β is almost exact match here as well.
Next step would be to use these unicorn SR104s calibrated routinely by high-end metrology lab and verify our in-house transfer results. External calibration will also help to keep xDevs.com’s resistance measurement uncertainty low. Hopefully, we can confirm agreement to better than ±0.4 µΩ/Ω with good confidence margins.
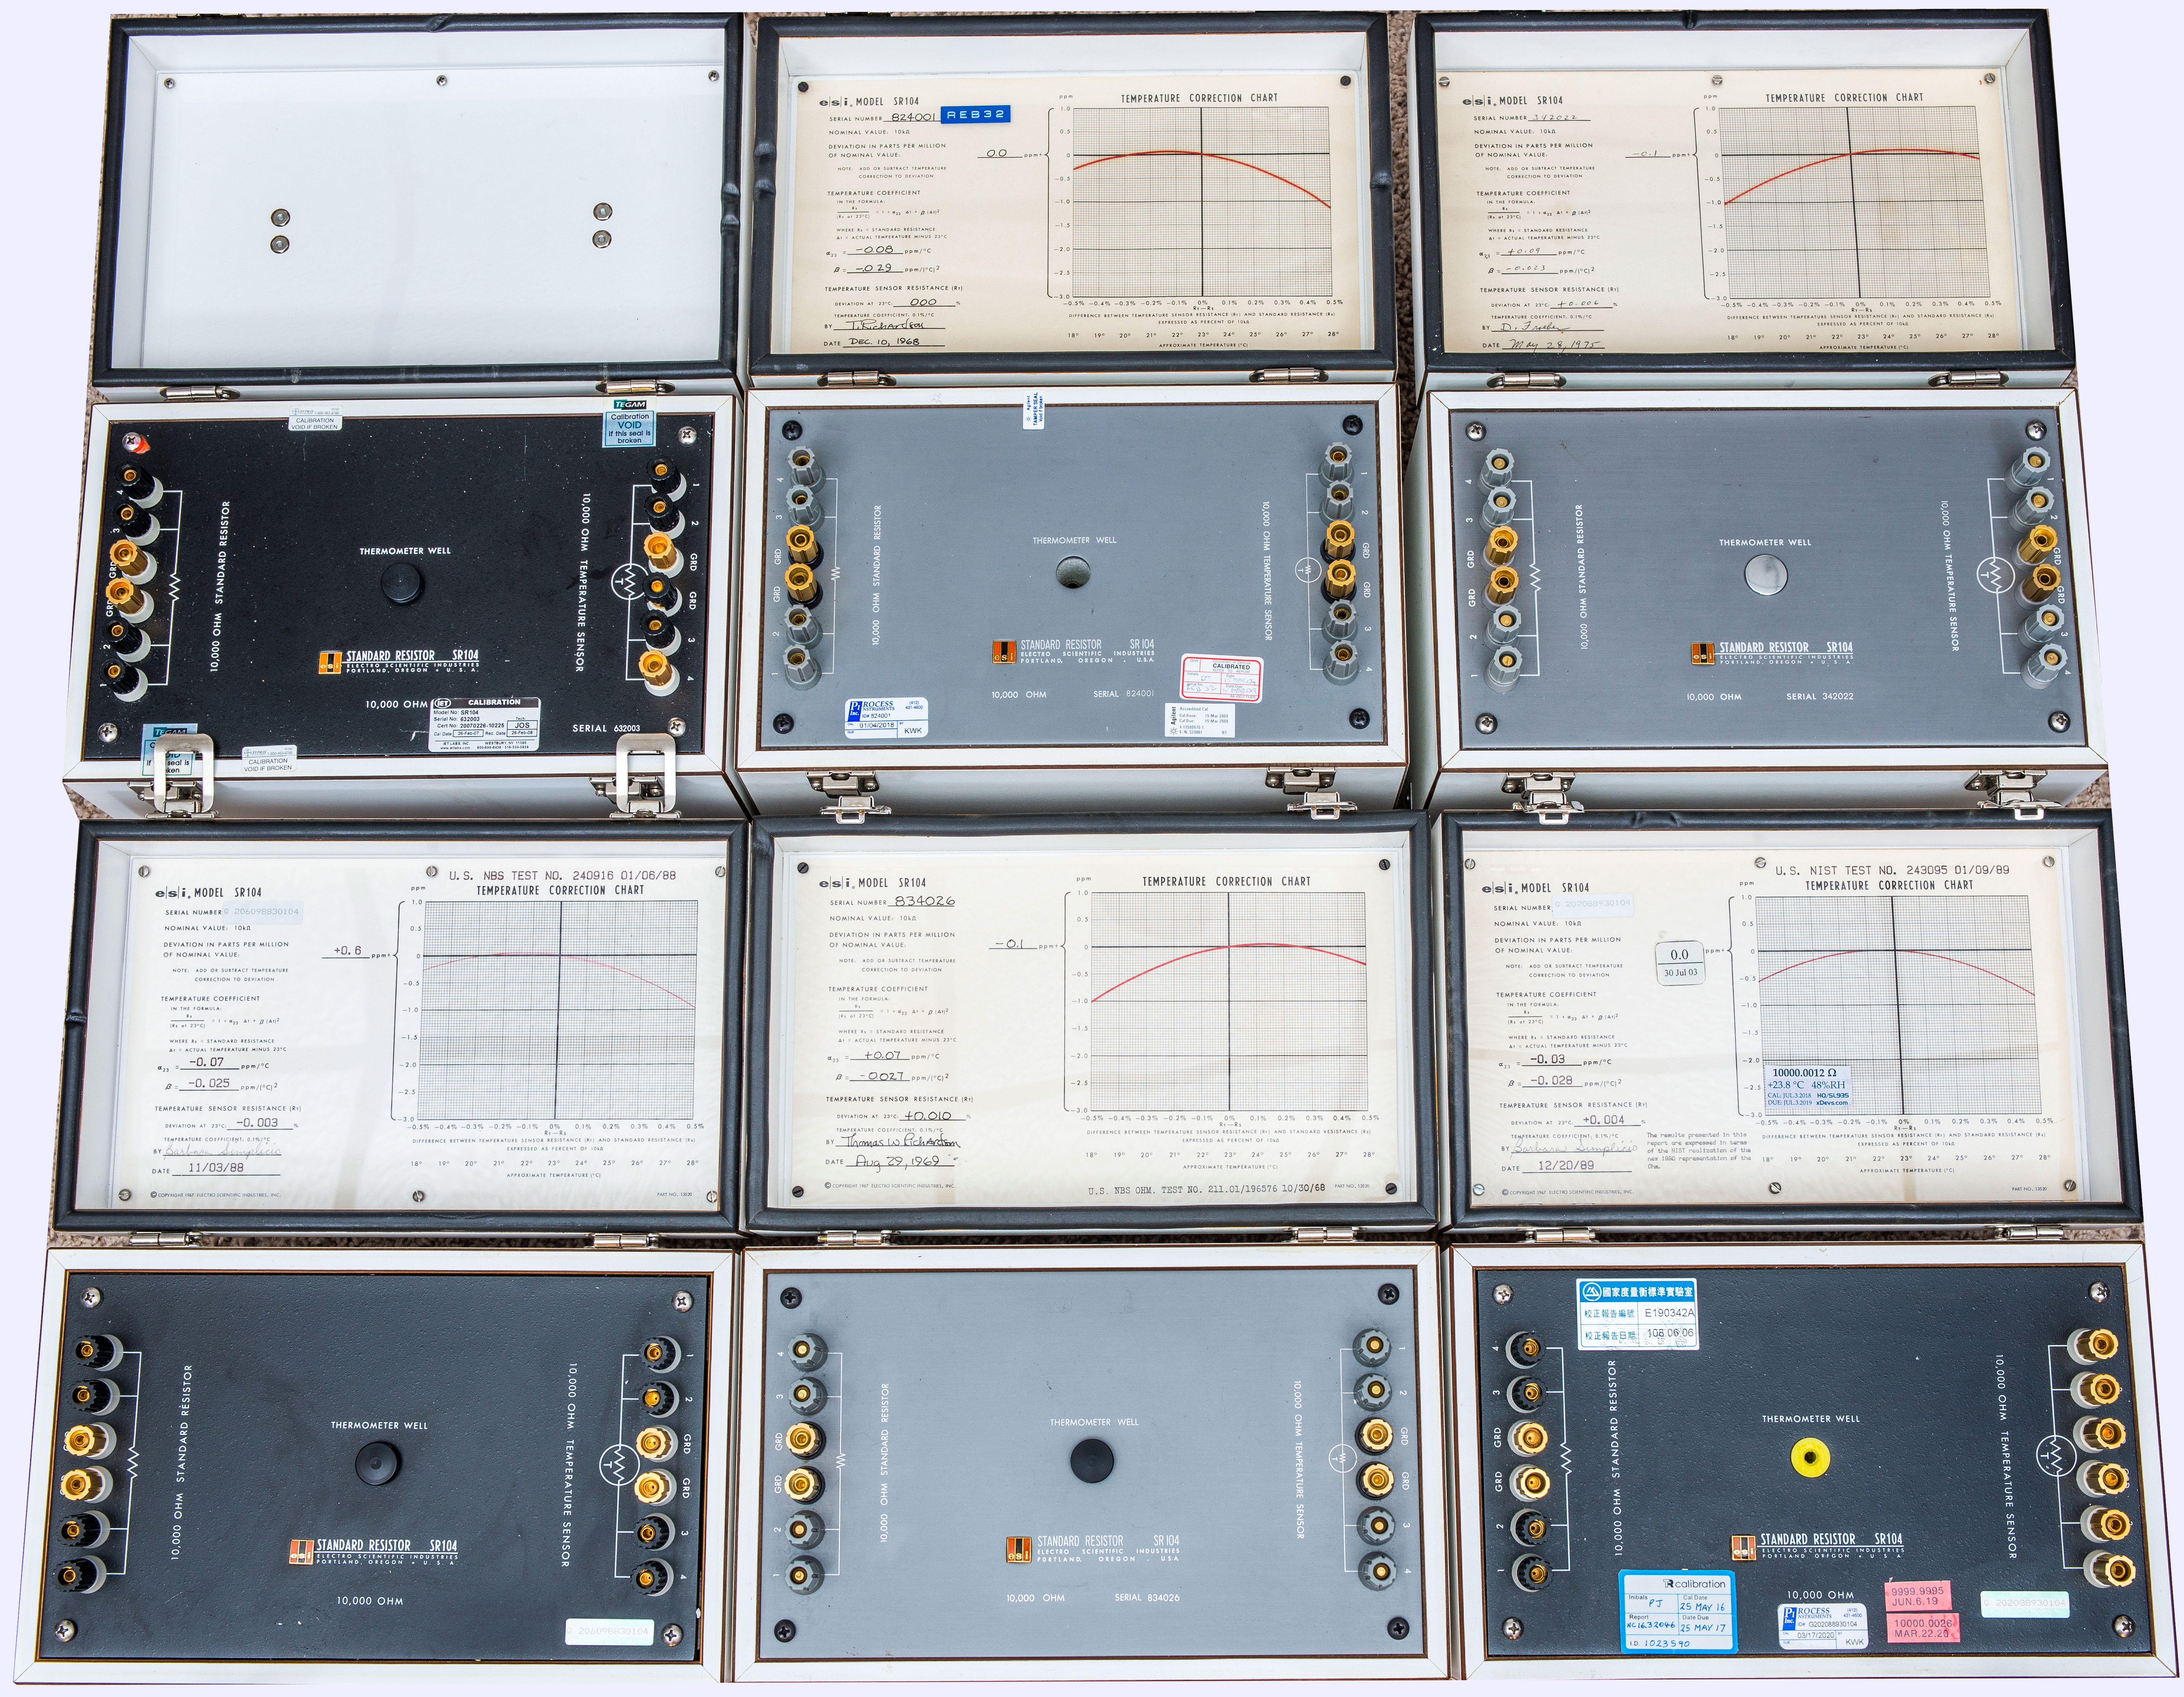
Image 36: Collection of SR104 standard during intercomparison meetup
SR104 was again recalibrated using Measurements International 6000A BVD resistance bridge using recent external calibration by MI lab for transfer S/N 948019 SR104. Using this data the current 25.MAY.2024 output value of xDevs.com SR104 was assigned as 10000.0025 Ω ±0.18 µΩ/Ω.
ESI SR104 standard, S/N G206098830104
Since 2021 xDevs had two SR104 standards from Tom to perform long-term stability tests and performance verification. This S/N G206098830104 unit was calibrated by Measurements International in 2021.
ESI SR104 S/N 632003 performance benchmarks
This standard was tested for NLab and did not have factory calibration label. Date of manufacture is unknown but should be earlier than 1995 year, it might be TEGAM-branded ESI SR104.
Metal label outside still bears ESI logo.
Some stickers from past xDevs transfers are present on the resistor.
Top left bolt has security epoxy, which is not common sight on ESI SR104 units.

Handle was replaced by the owner at some point as well since original was very broken. More about that in this chapter
Posts are in decent shape, given the age of the standard.
TCR was measured at xDevs lab in mini-TEC chamber with a help of Measurements International 6010B and transfer 1010 Ω ovenized standard.
After 264 hours of the slow temperature sweep sequence I’ve obtained resulting values for α = +0.014 µΩ/Ω/K and β = -0.026 µΩ/Ω/K2. 76k points were accumulated during this measurement experiment. Temperature sensor output from DUT ESI SR104 was measured by HP 3458A DMM. Temperature sensor output deviation at +23.0 °C was measured at 10000.76 Ω or +0.0076 % from nominal.
| Model and serial | Calibration date | Assigned value | Uncertainty | Calculated drift | Notes | Age |
|---|---|---|---|---|---|---|
| SR104 632003 | 8.AUG.2021 by xDevs | 9999.9988 Ω | ± 0.5 µΩ/Ω | ? µΩ/Ω, ? µΩ/Ω/a | Transfer DMM, 0.5 mA | N/A |
| SR104 632003 | 26.APR.2021 by xDevs | 9999.9991 Ω | ± 0.9 µΩ/Ω | ? µΩ/Ω, ? µΩ/Ω/a | Transfer Fluke 8508A, 0.1 mA | N/A |
| SR104 632003 | 19.DEC.2024 by xDevs | 9999.9986 Ω | ± 0.25 µΩ/Ω | ? µΩ/Ω, ? µΩ/Ω/a | 6000A BVD vs reference SR104, 0.5 mA | Ref |
RAW data points used for processing and analysis are all available in this EXCEL-file .
All these measurements were relative so additional corrections per previous calibration on 6000A BVD system were applied prior to analysis. Same data in graphical format relative to thermal well temperature PT100 sensor:
Same dataset relative to the internal SR104 temperature output readings from 3458A:
With all these measurement results we can make replacement label with current values. This would be starting reference point for future history collection on this standard.
Final looks with printed replacement label presented below.
ESI SR104 S/N 824001 performance benchmarks
| Model and serial | Calibration date | Assigned value | Uncertainty | Calculated drift | Notes | Age |
|---|---|---|---|---|---|---|
| SR104 824001 | 10.DEC.1968, factory | 9999.9942 Ω (corrected to SI1990) | ± 1.0 µΩ/Ω | Ref | Original factory label | Ref |
| SR104 824001 | 15.DEC.2024 by xDevs | 10000.0317 Ω | ± 0.2 µΩ/Ω | +3.75 µΩ/Ω, +0.067 µΩ/Ω/a | 6000A BVD vs reference SR104, 0.5 mA | 20459 days |
| SR104 824001 | 16.DEC.2024 by xDevs | 10000.0312 Ω | ± 0.2 µΩ/Ω | +3.70 µΩ/Ω, +0.066 µΩ/Ω/a | 6000A BVD vs reference FSL935 , 0.5 mA | 20460 days |
ESI SR104 S/N 851029 performance benchmarks
Yet another SR104 standards performance was measured during RepairFest April 2023 . This SR104 was manufactured and calibrated in 1994 with serial number 851029. During factory calibration it was measured +1.0 µΩ/Ω high at cardinal +23.0 °C with rather high α = +0.18 µΩ/Ω/K and β = -0.030 µΩ/Ω/K2. Temperature sensor output deviation at +23.0 °C was measured at -0.009 %.
According to extra labels this standard was recalibrated in year 2000 with measured deviation +1.1 µΩ/Ω, with unknown uncertainty. Some photos of standard are available below for reference.
Image 40: N3 SR104 unit open
Image 41: N3 SR104 unit lid release
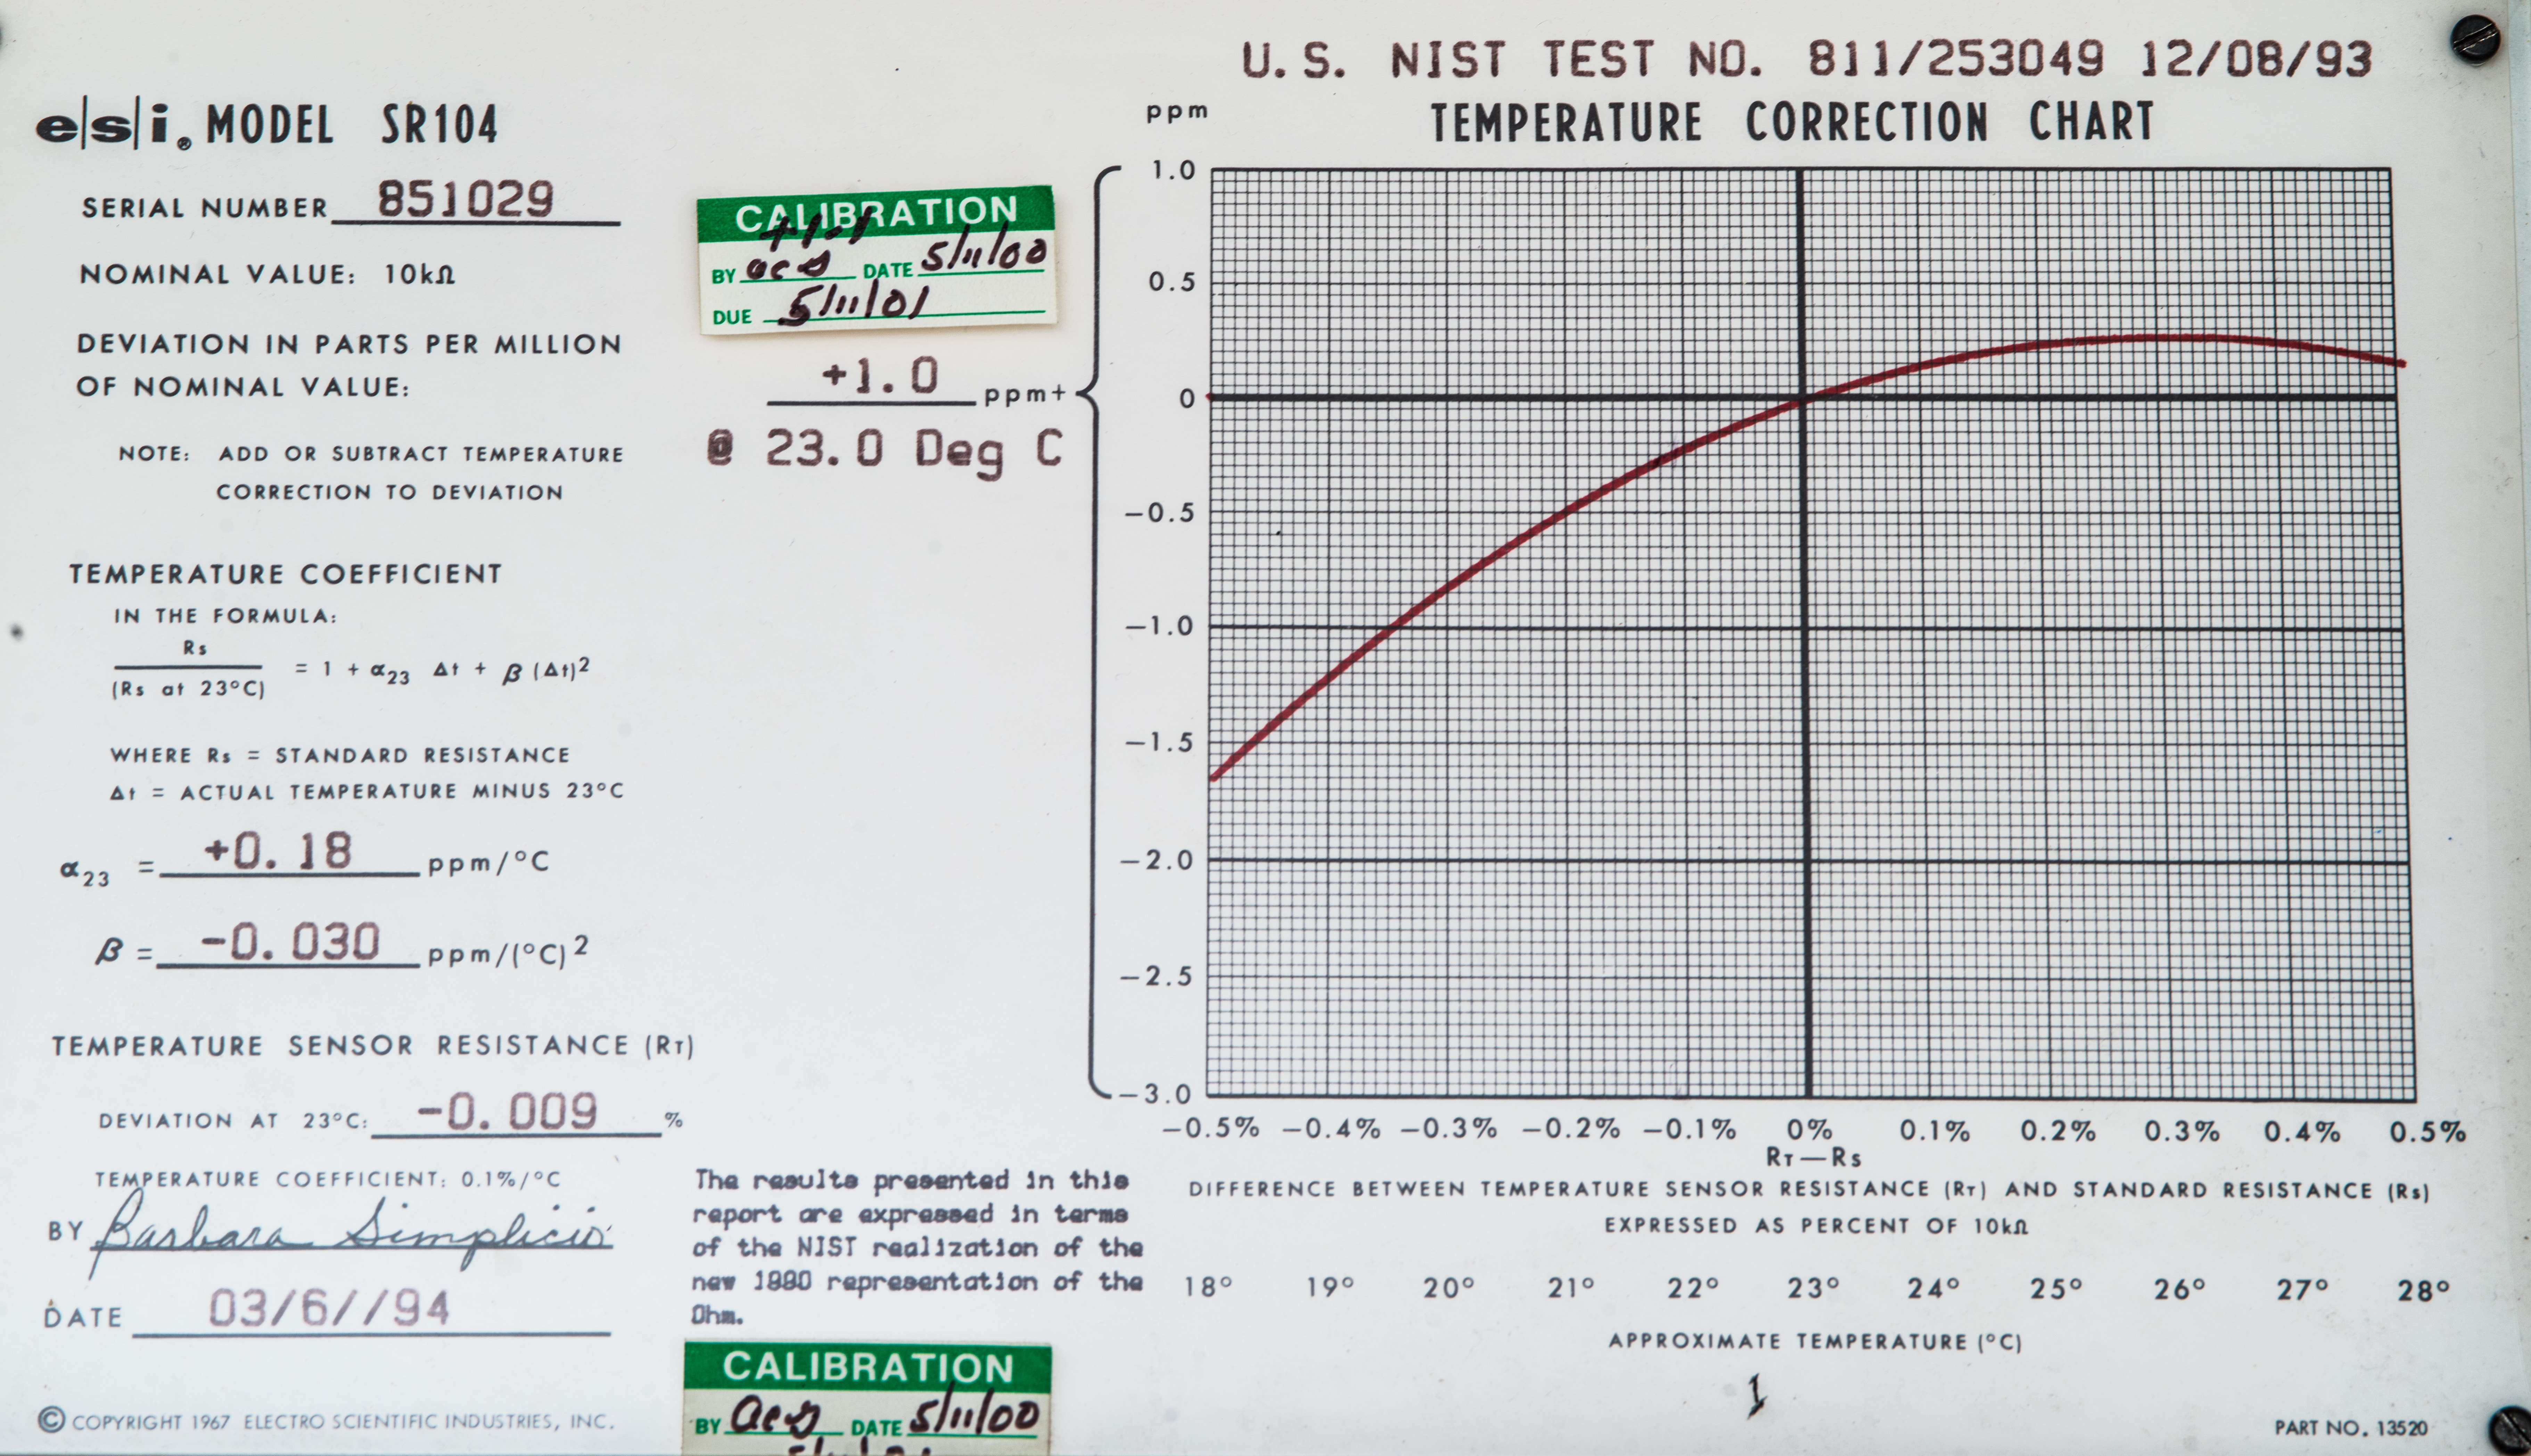
Image 42: N3 SR104 unit factory label
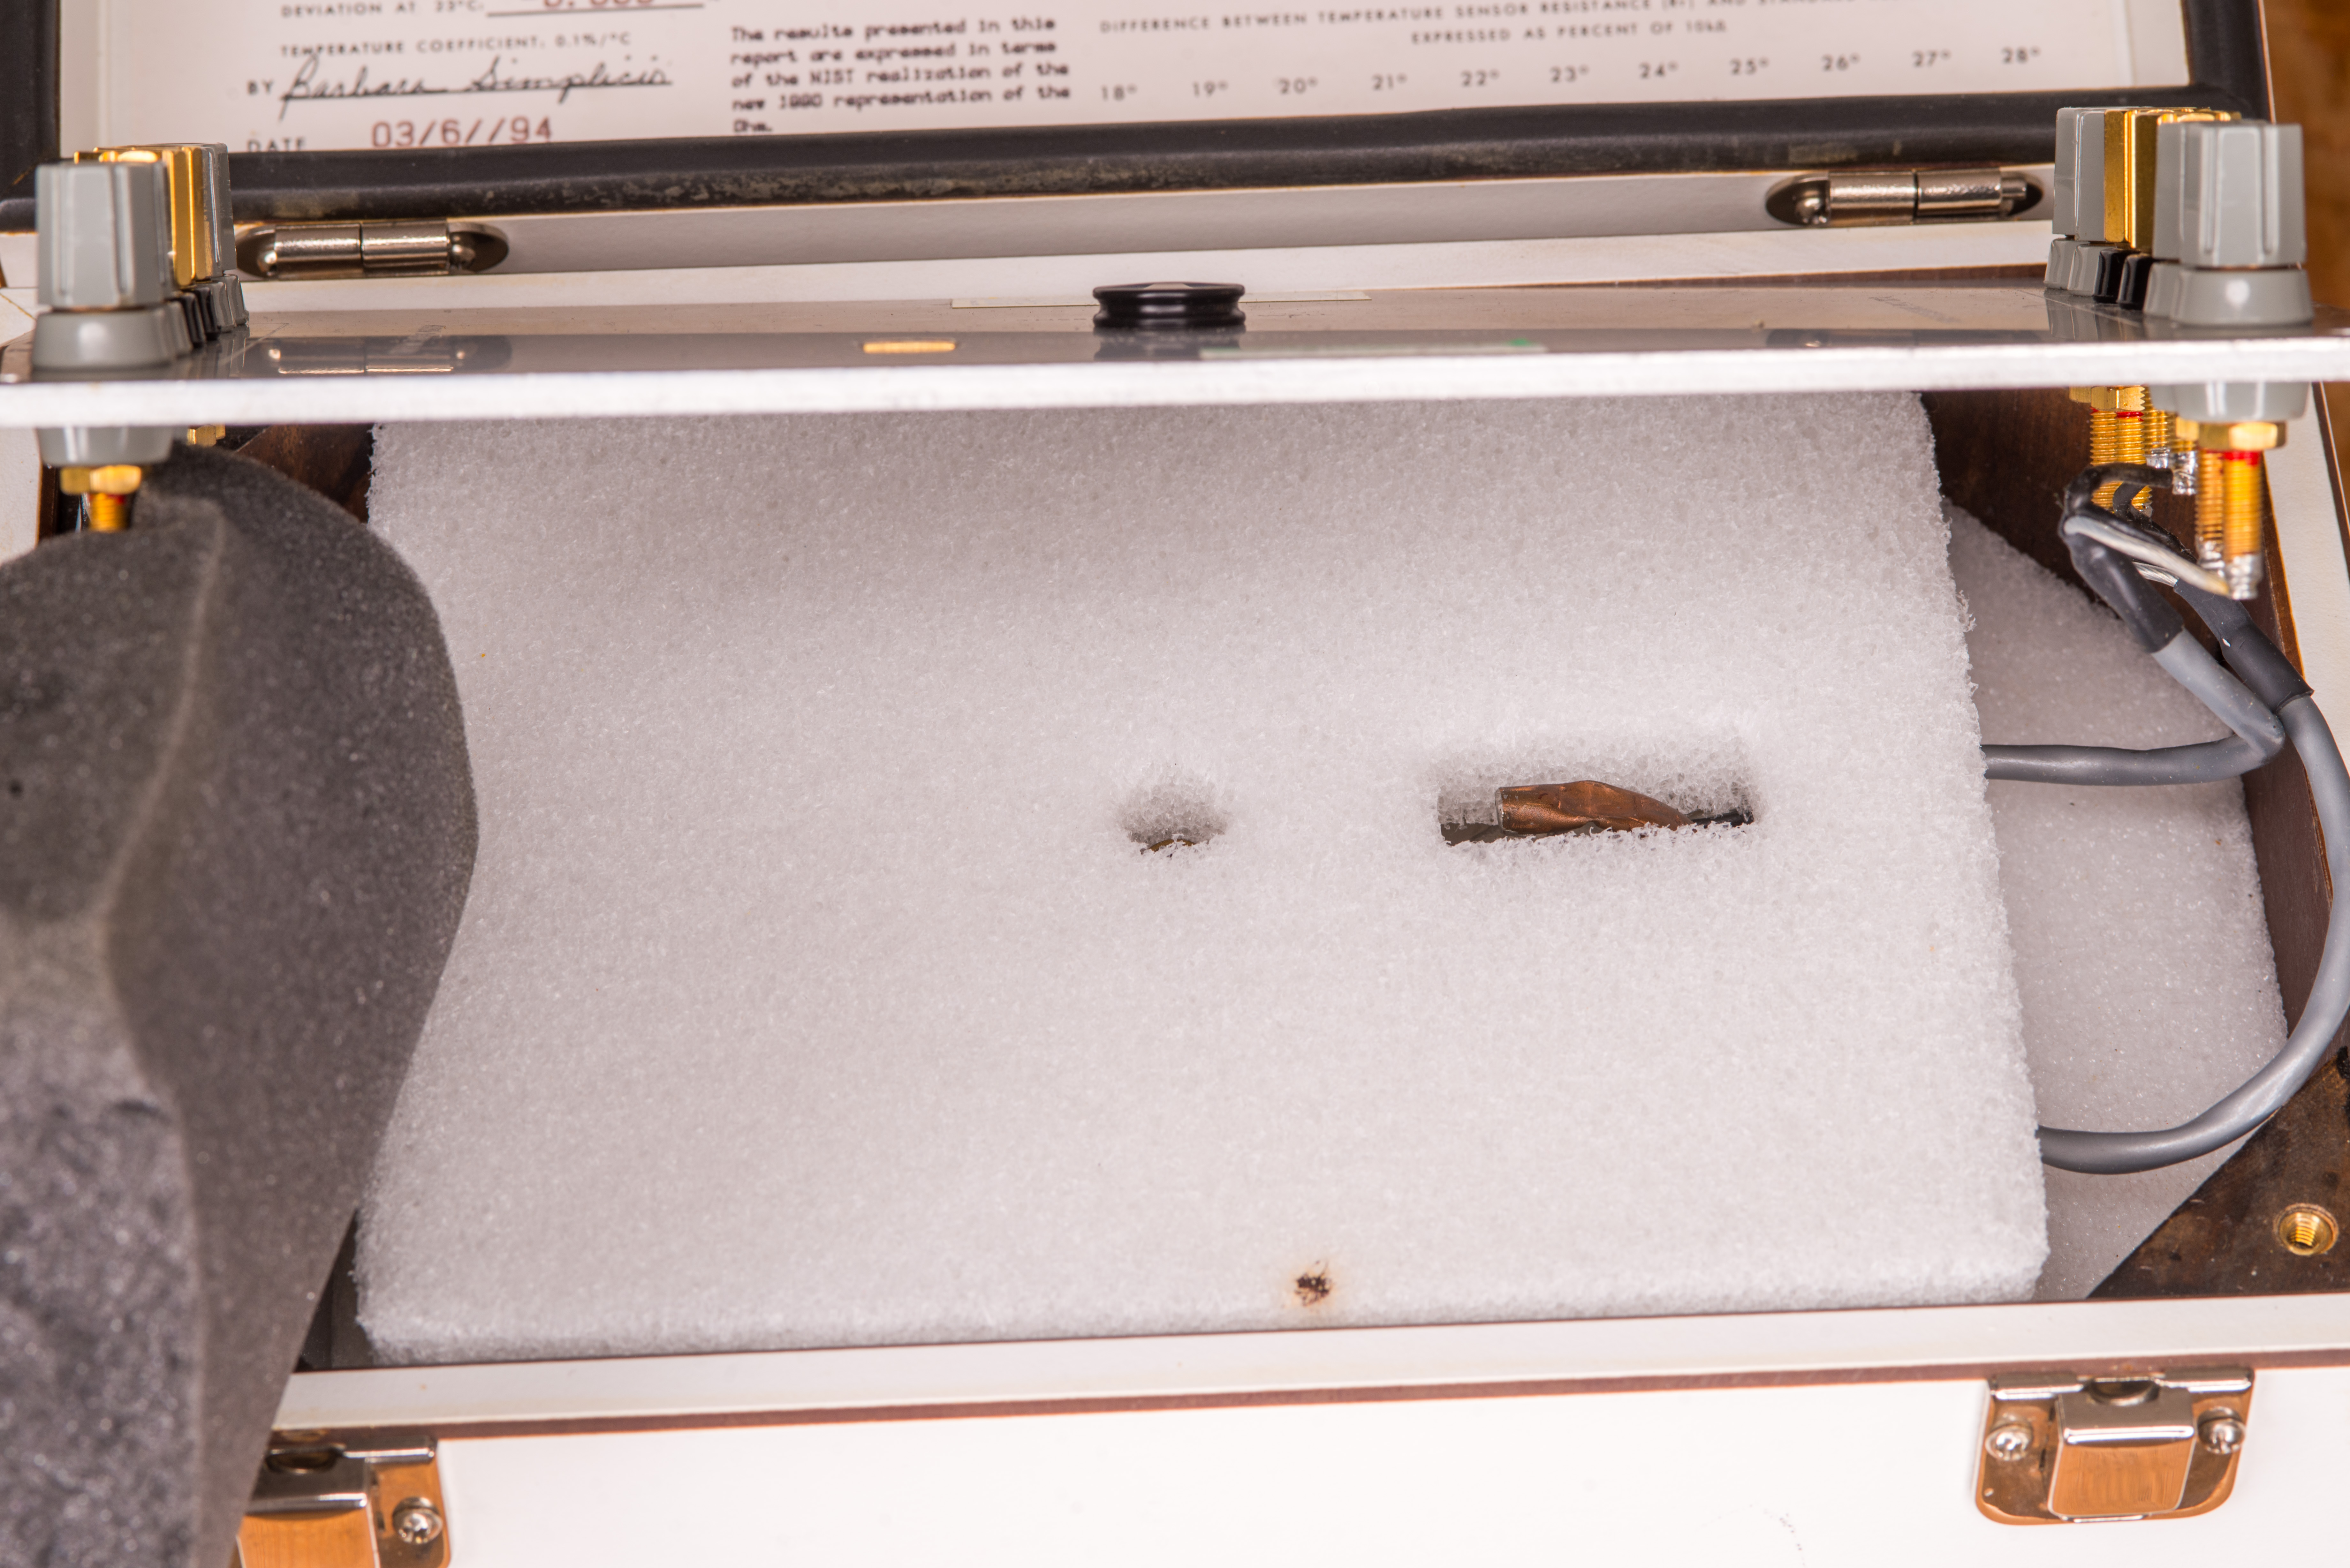
Image 43: N3 SR104 unit inner oil tank with elements
Interesting to note that serial number or batch number on the metal can is different to actual serial number on the lid. Threaded inserts were also stripped by previous users, perhaps somebody replaced the actual standard can in the box? Measurements will reveal if actual performance match the lid label or not.
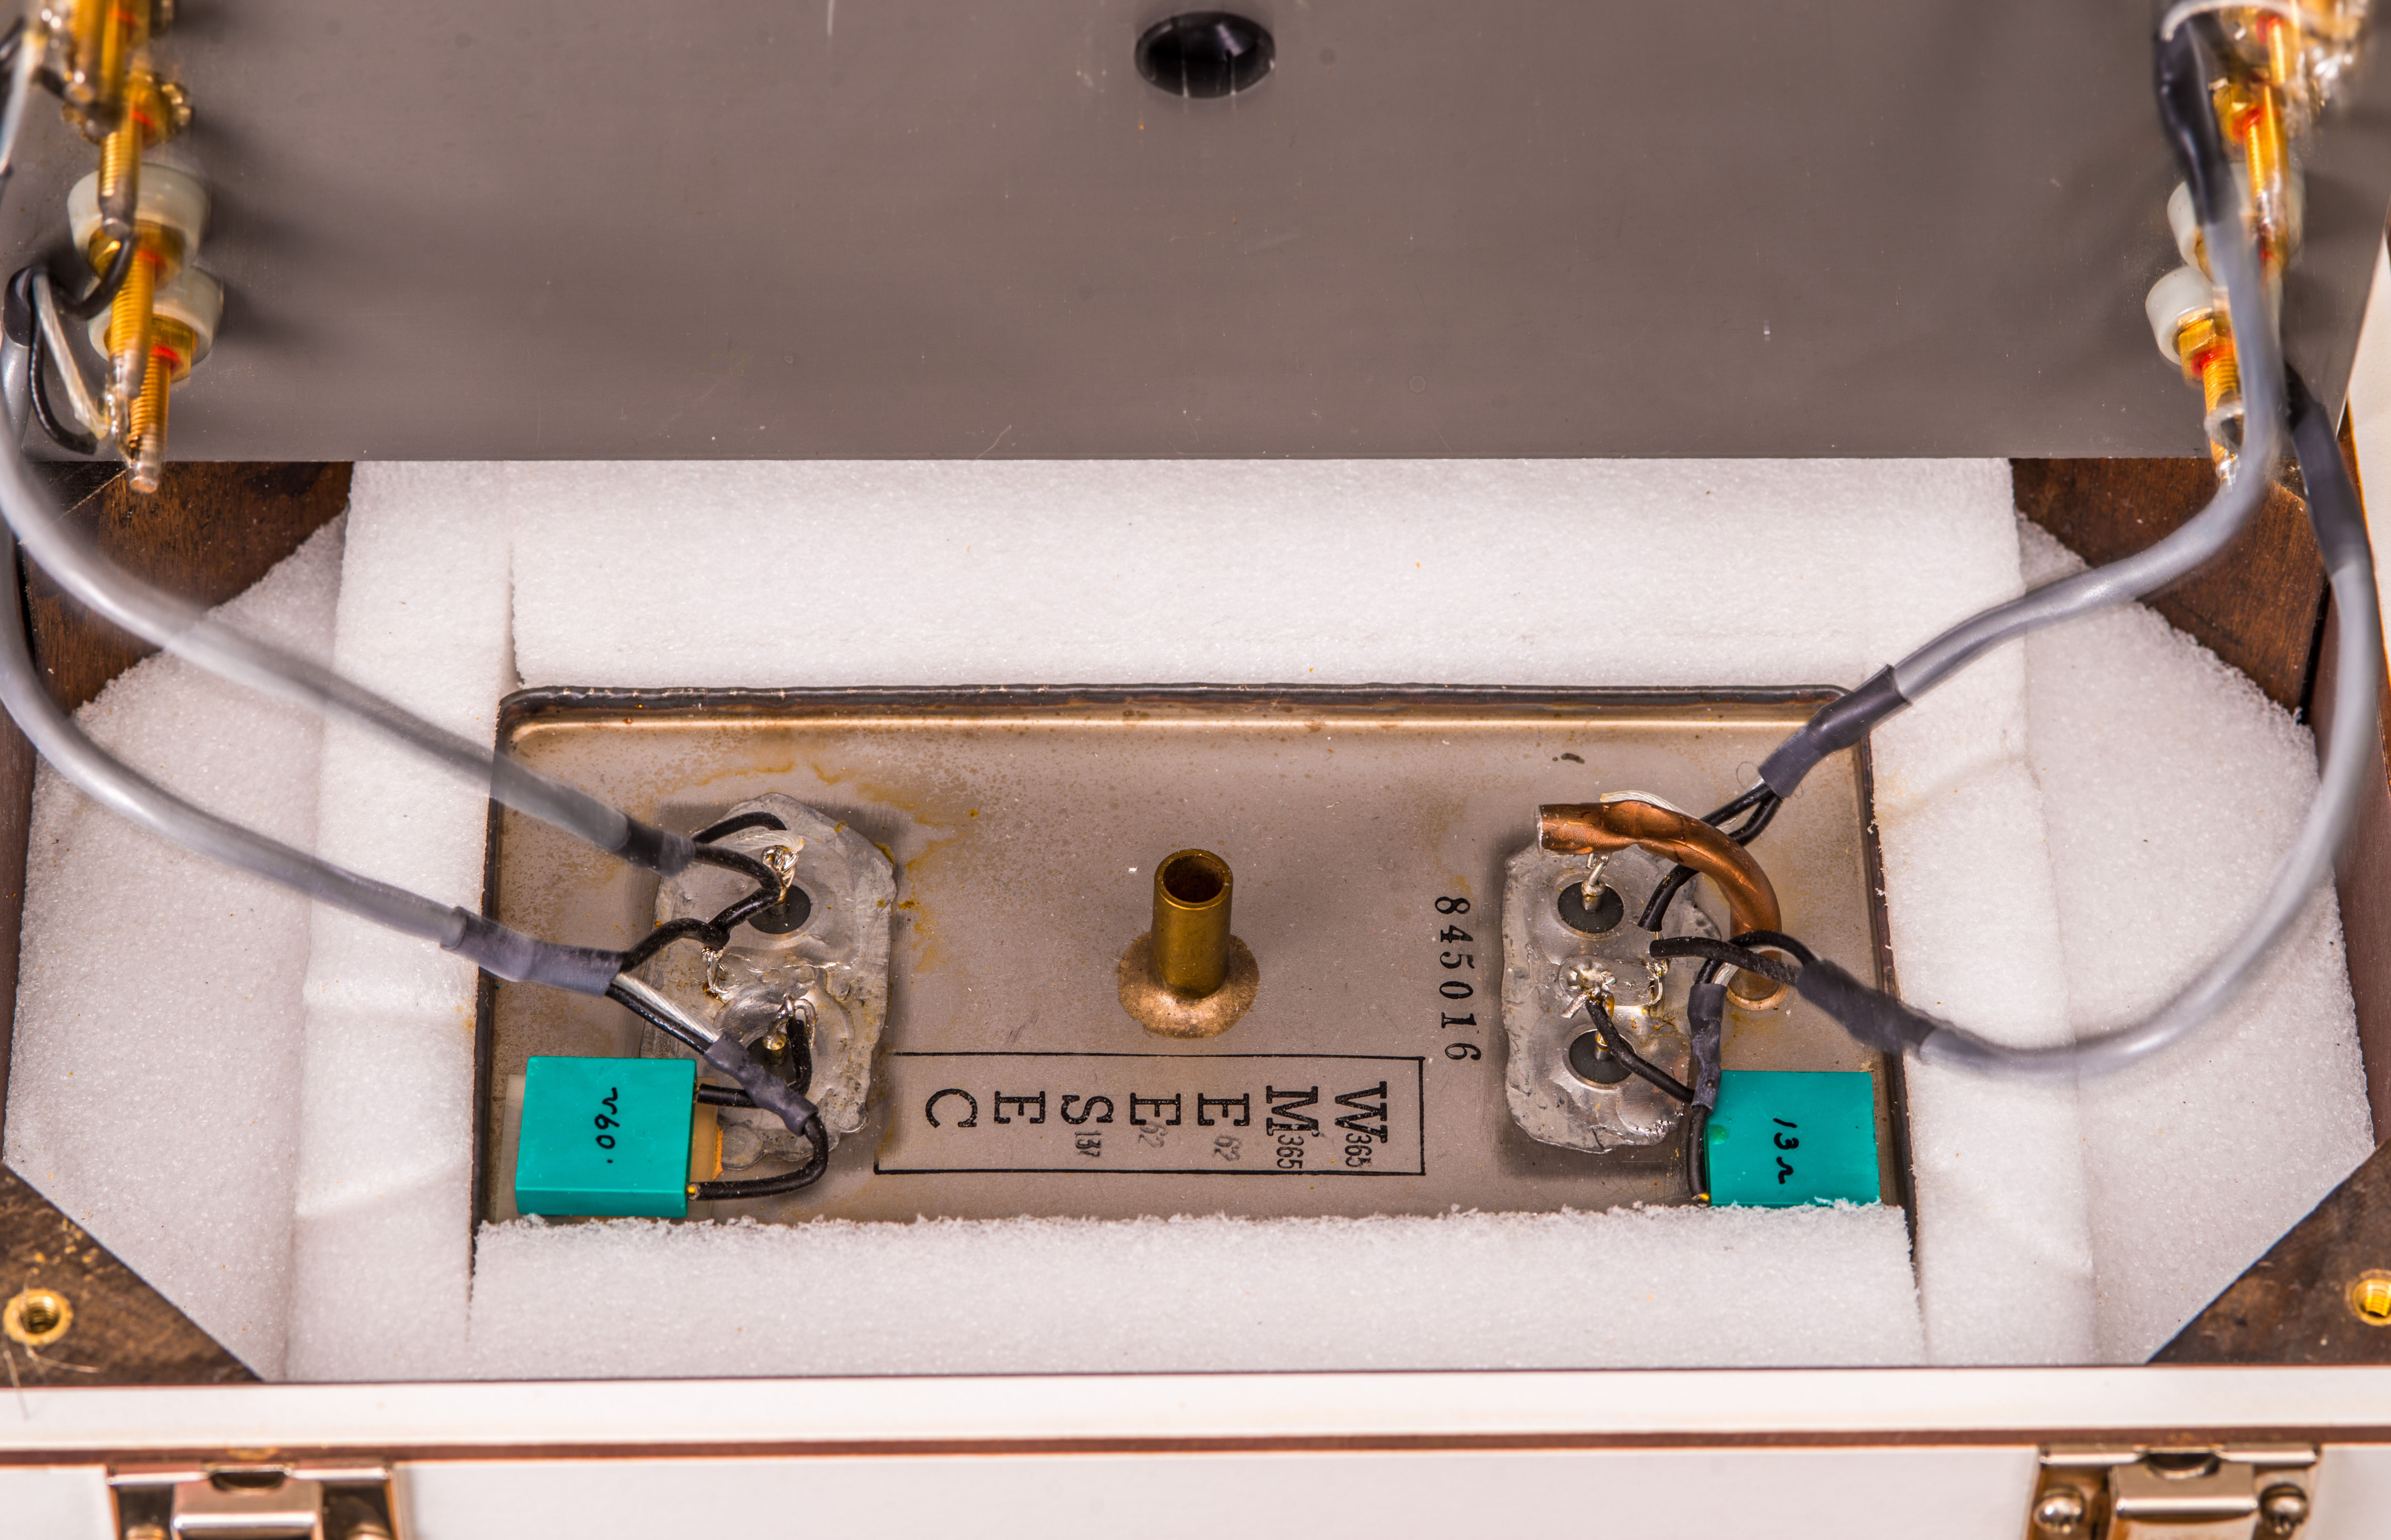
Image 44: Interesting label and mismatching serial number on a tank?
Link to datalog during measurements available here . Based on this calibration data we can now determine current temperature coefficient of the standard and make a new pretty label.
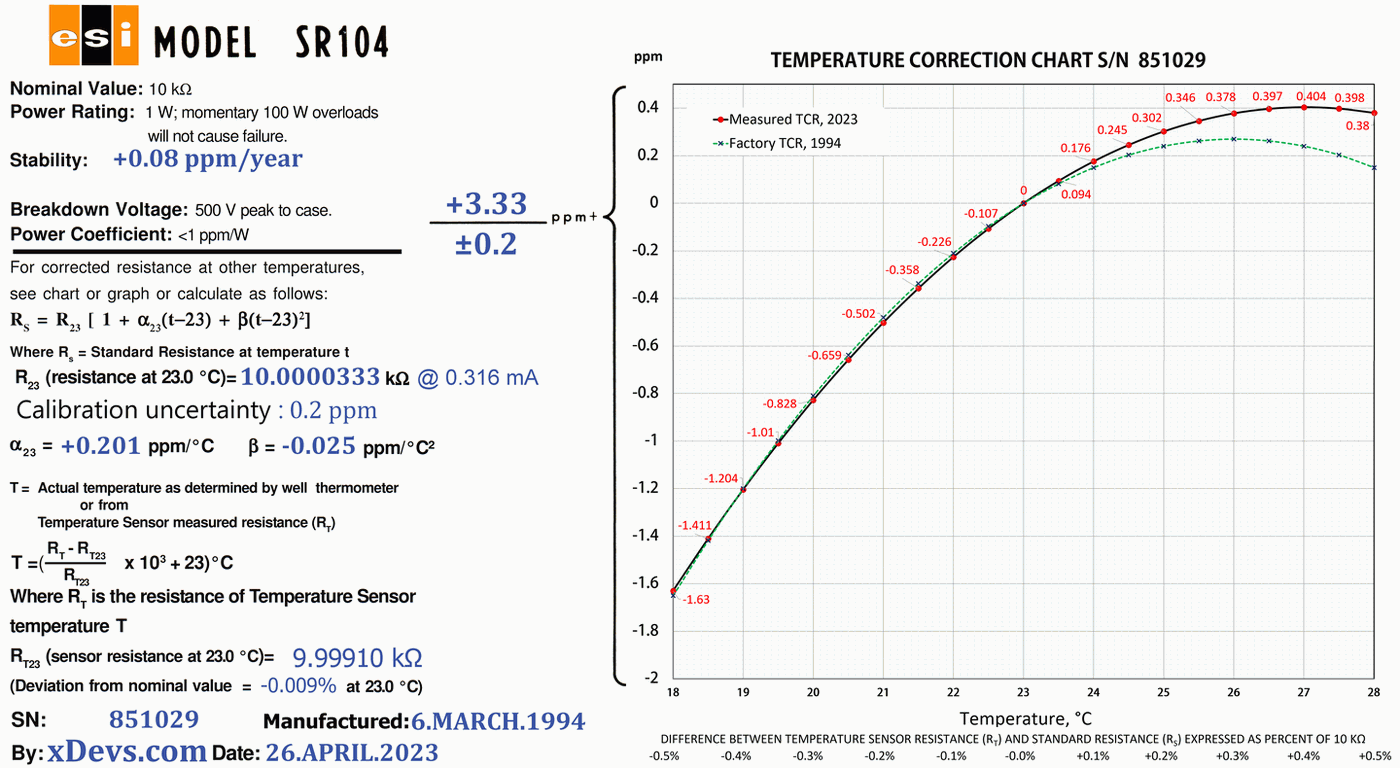
Image 45: New label printed for the lid, based on current calibration
Calibration sweep for temperature coefficient measurement on this SR104 was very slow due to very long settling time. Measurement started on April 26, 2023 at 10:45 am and finished May 5, 2023 on 1:02 am, totalling 656220 seconds (182 hours). Temperature in the air bath with test SR104 was controlled and set by software algorithm in xDevs.com TECKit Python open-source software.
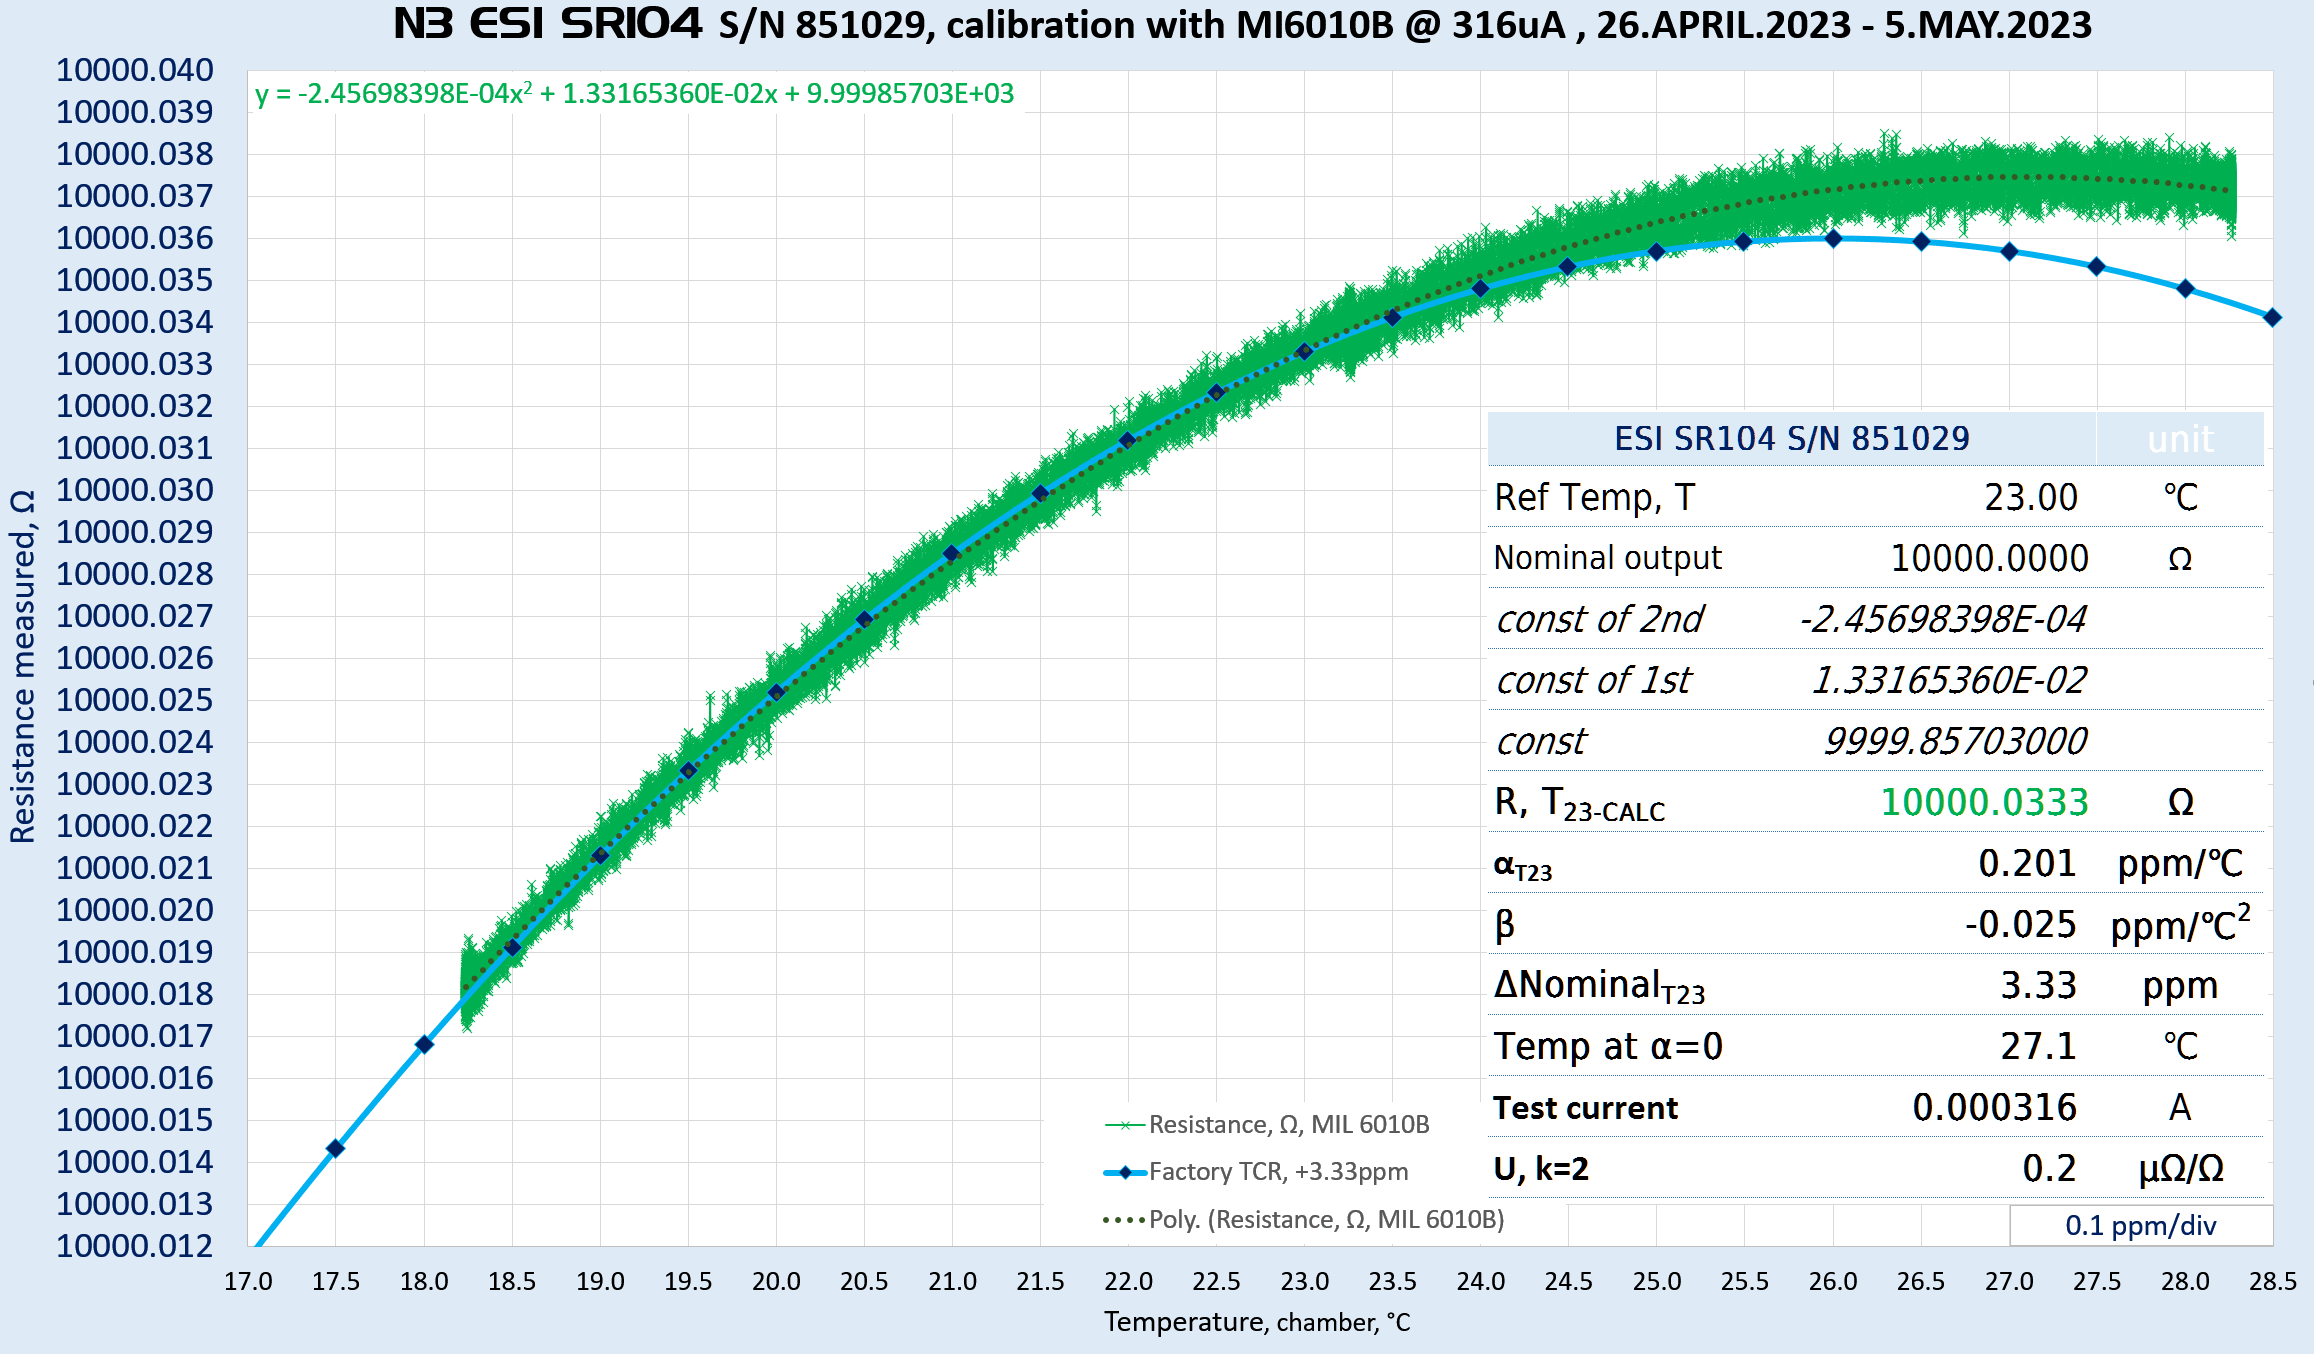
Image 46: Actual data points and polynominal calculation values
ESI SR104 S/N 342022 performance benchmarks
This old SR104 was manufactured in 1975 and much older than our first unit. It was recalibrated by Measurements International on June 10, 2021 and later by internal xDevs.com transfers with help of MI 6000A and MI 6010B bridges and transfer standards.
Final data as of August 2023 is updated and presented in charts below:
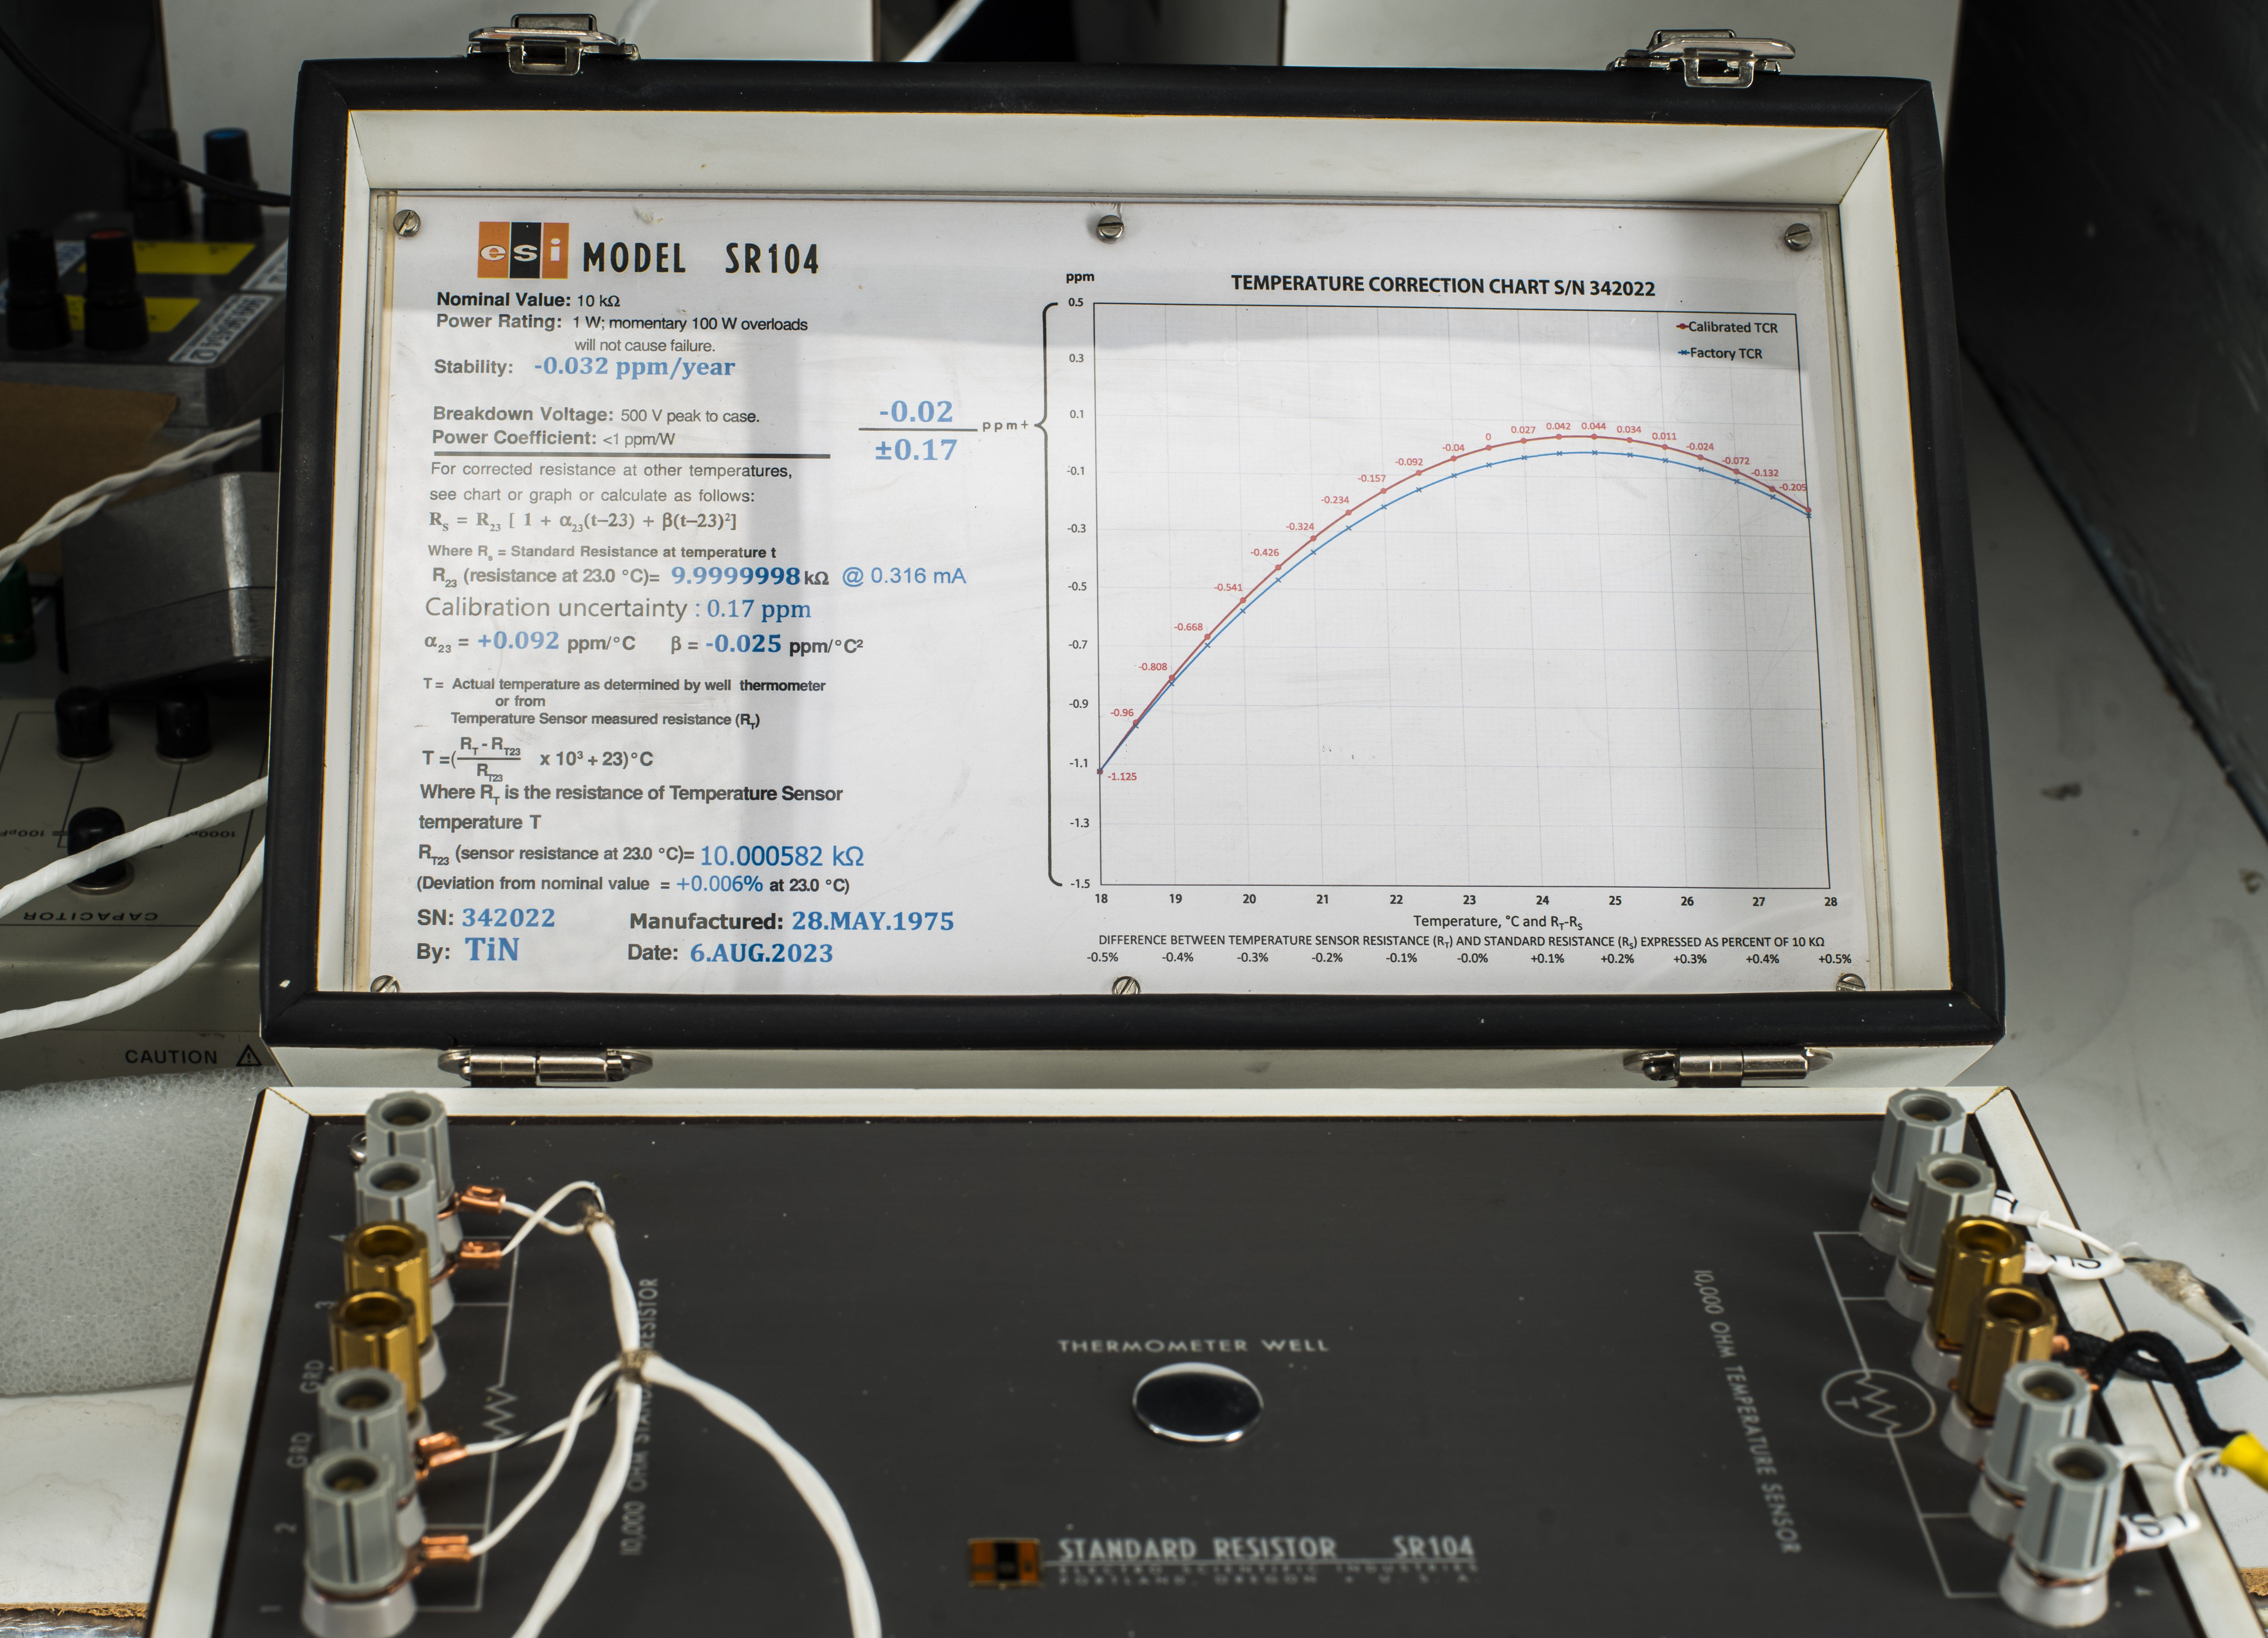
Image 47: SR104 S/N 342022
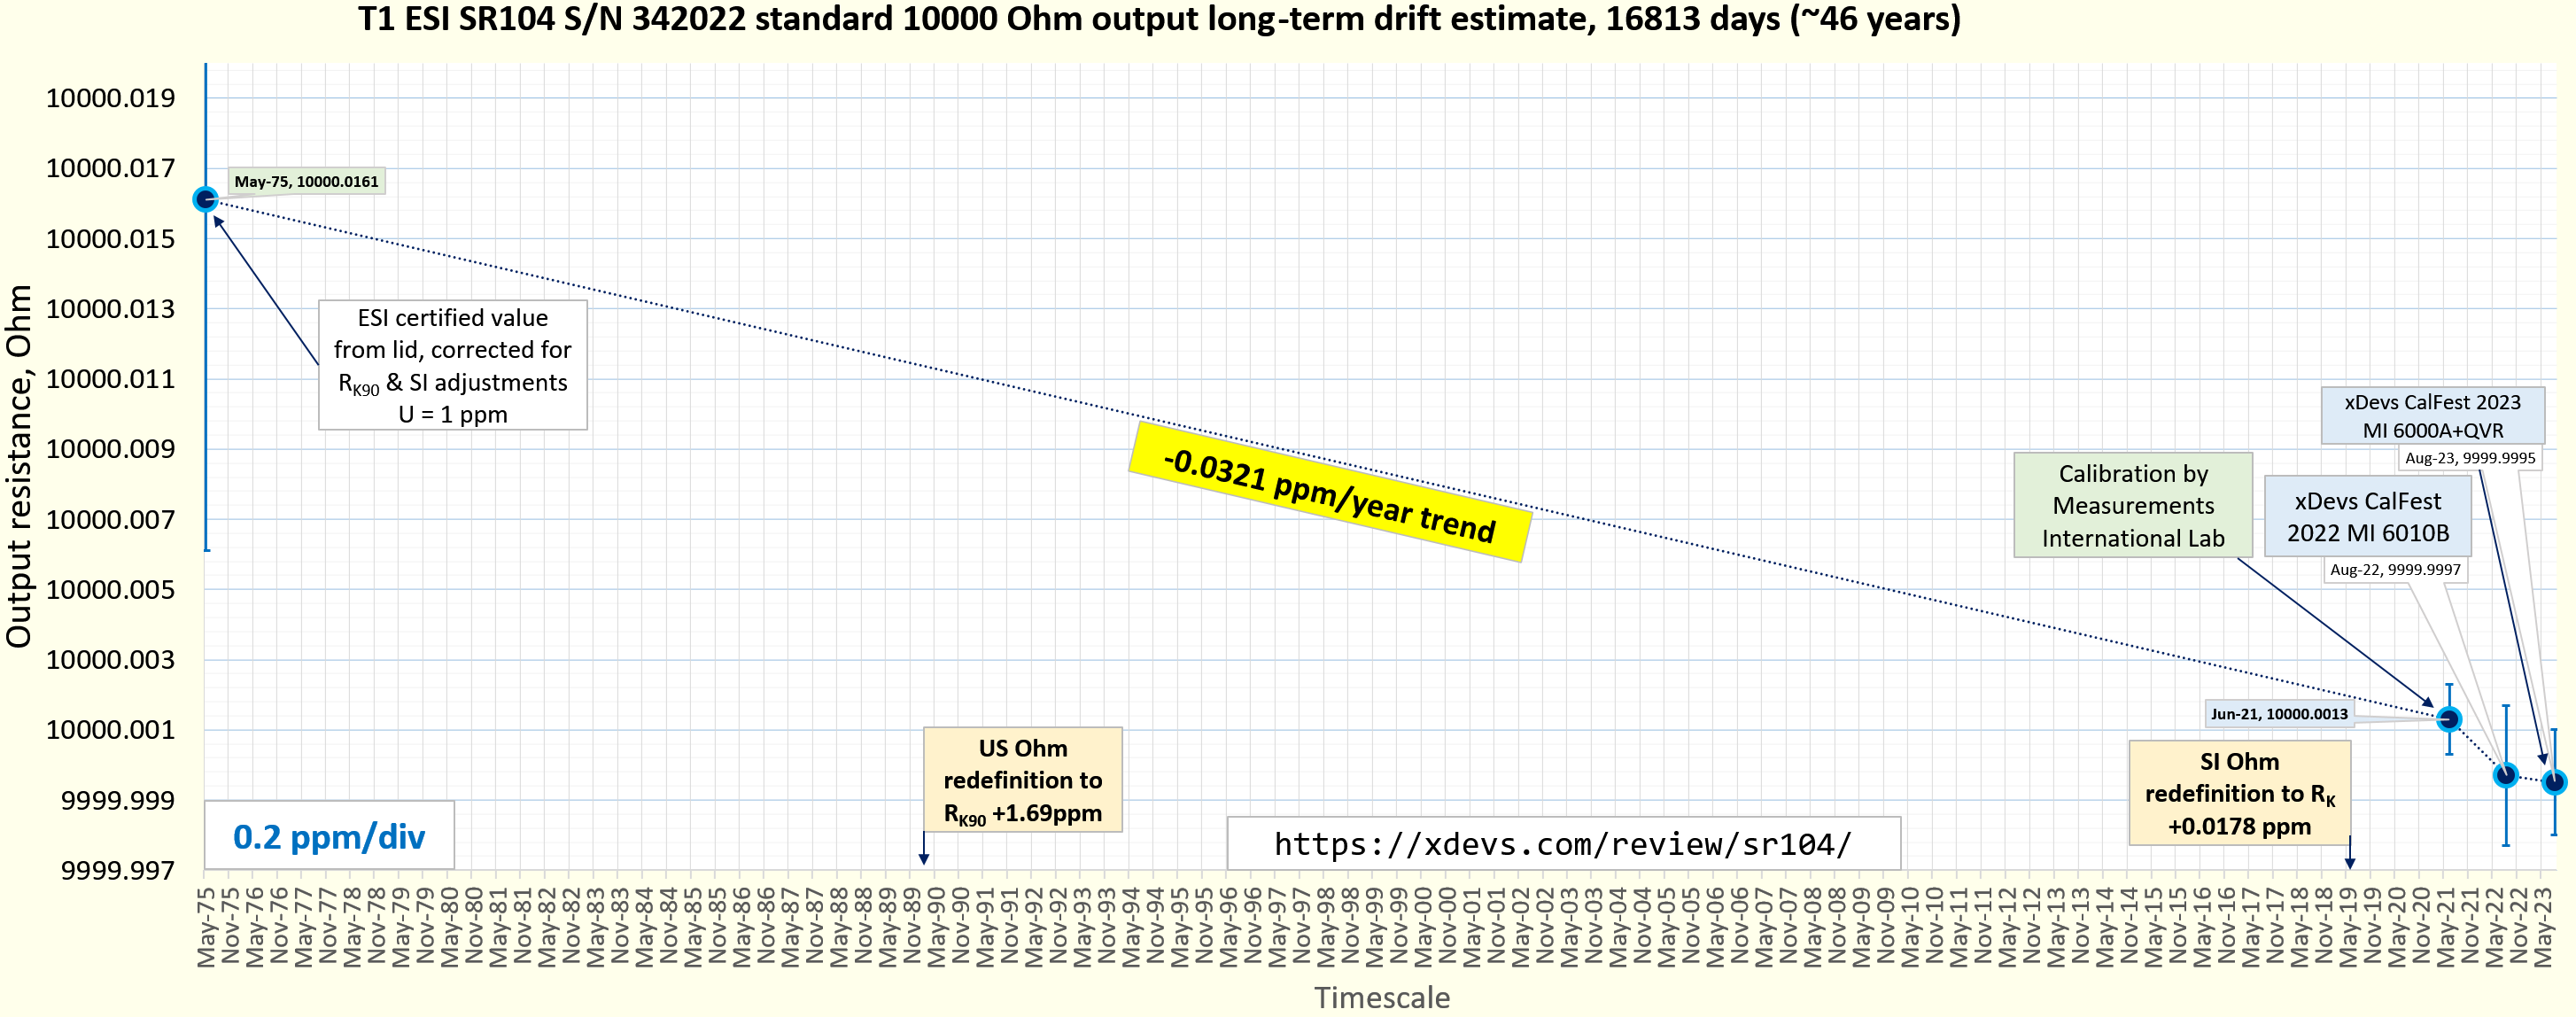
Image 48: T1 SR104 as finished
Uncertainty analysis of final transfer for SR104 S/N 342022 by Suncal from Sandia PSL
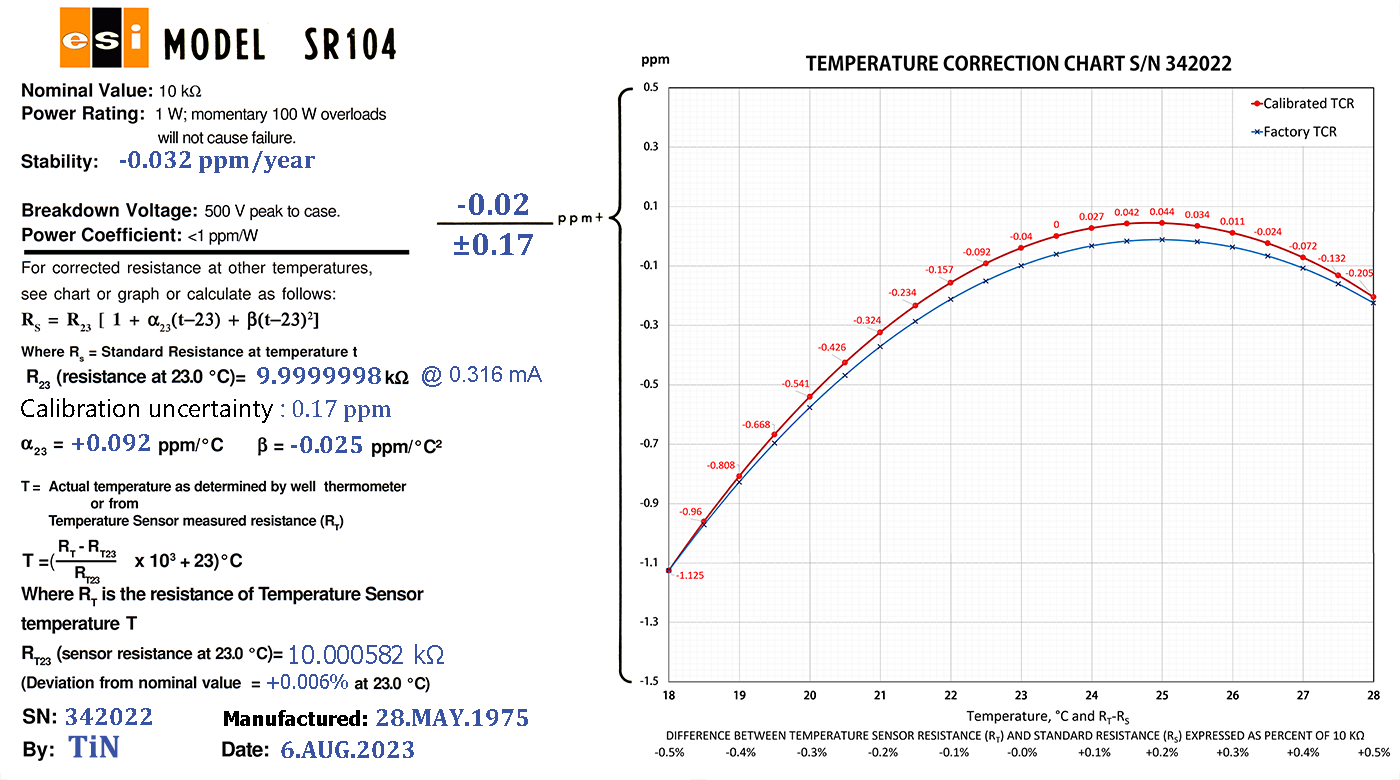
Image 49: Resistance standard with new label and updated values
ESI SR104 standard, S/N 734010
This sample of SR104 was received from secondary used market, manufactured and calibrated by factory on 29 January 1987, good 37 years ago
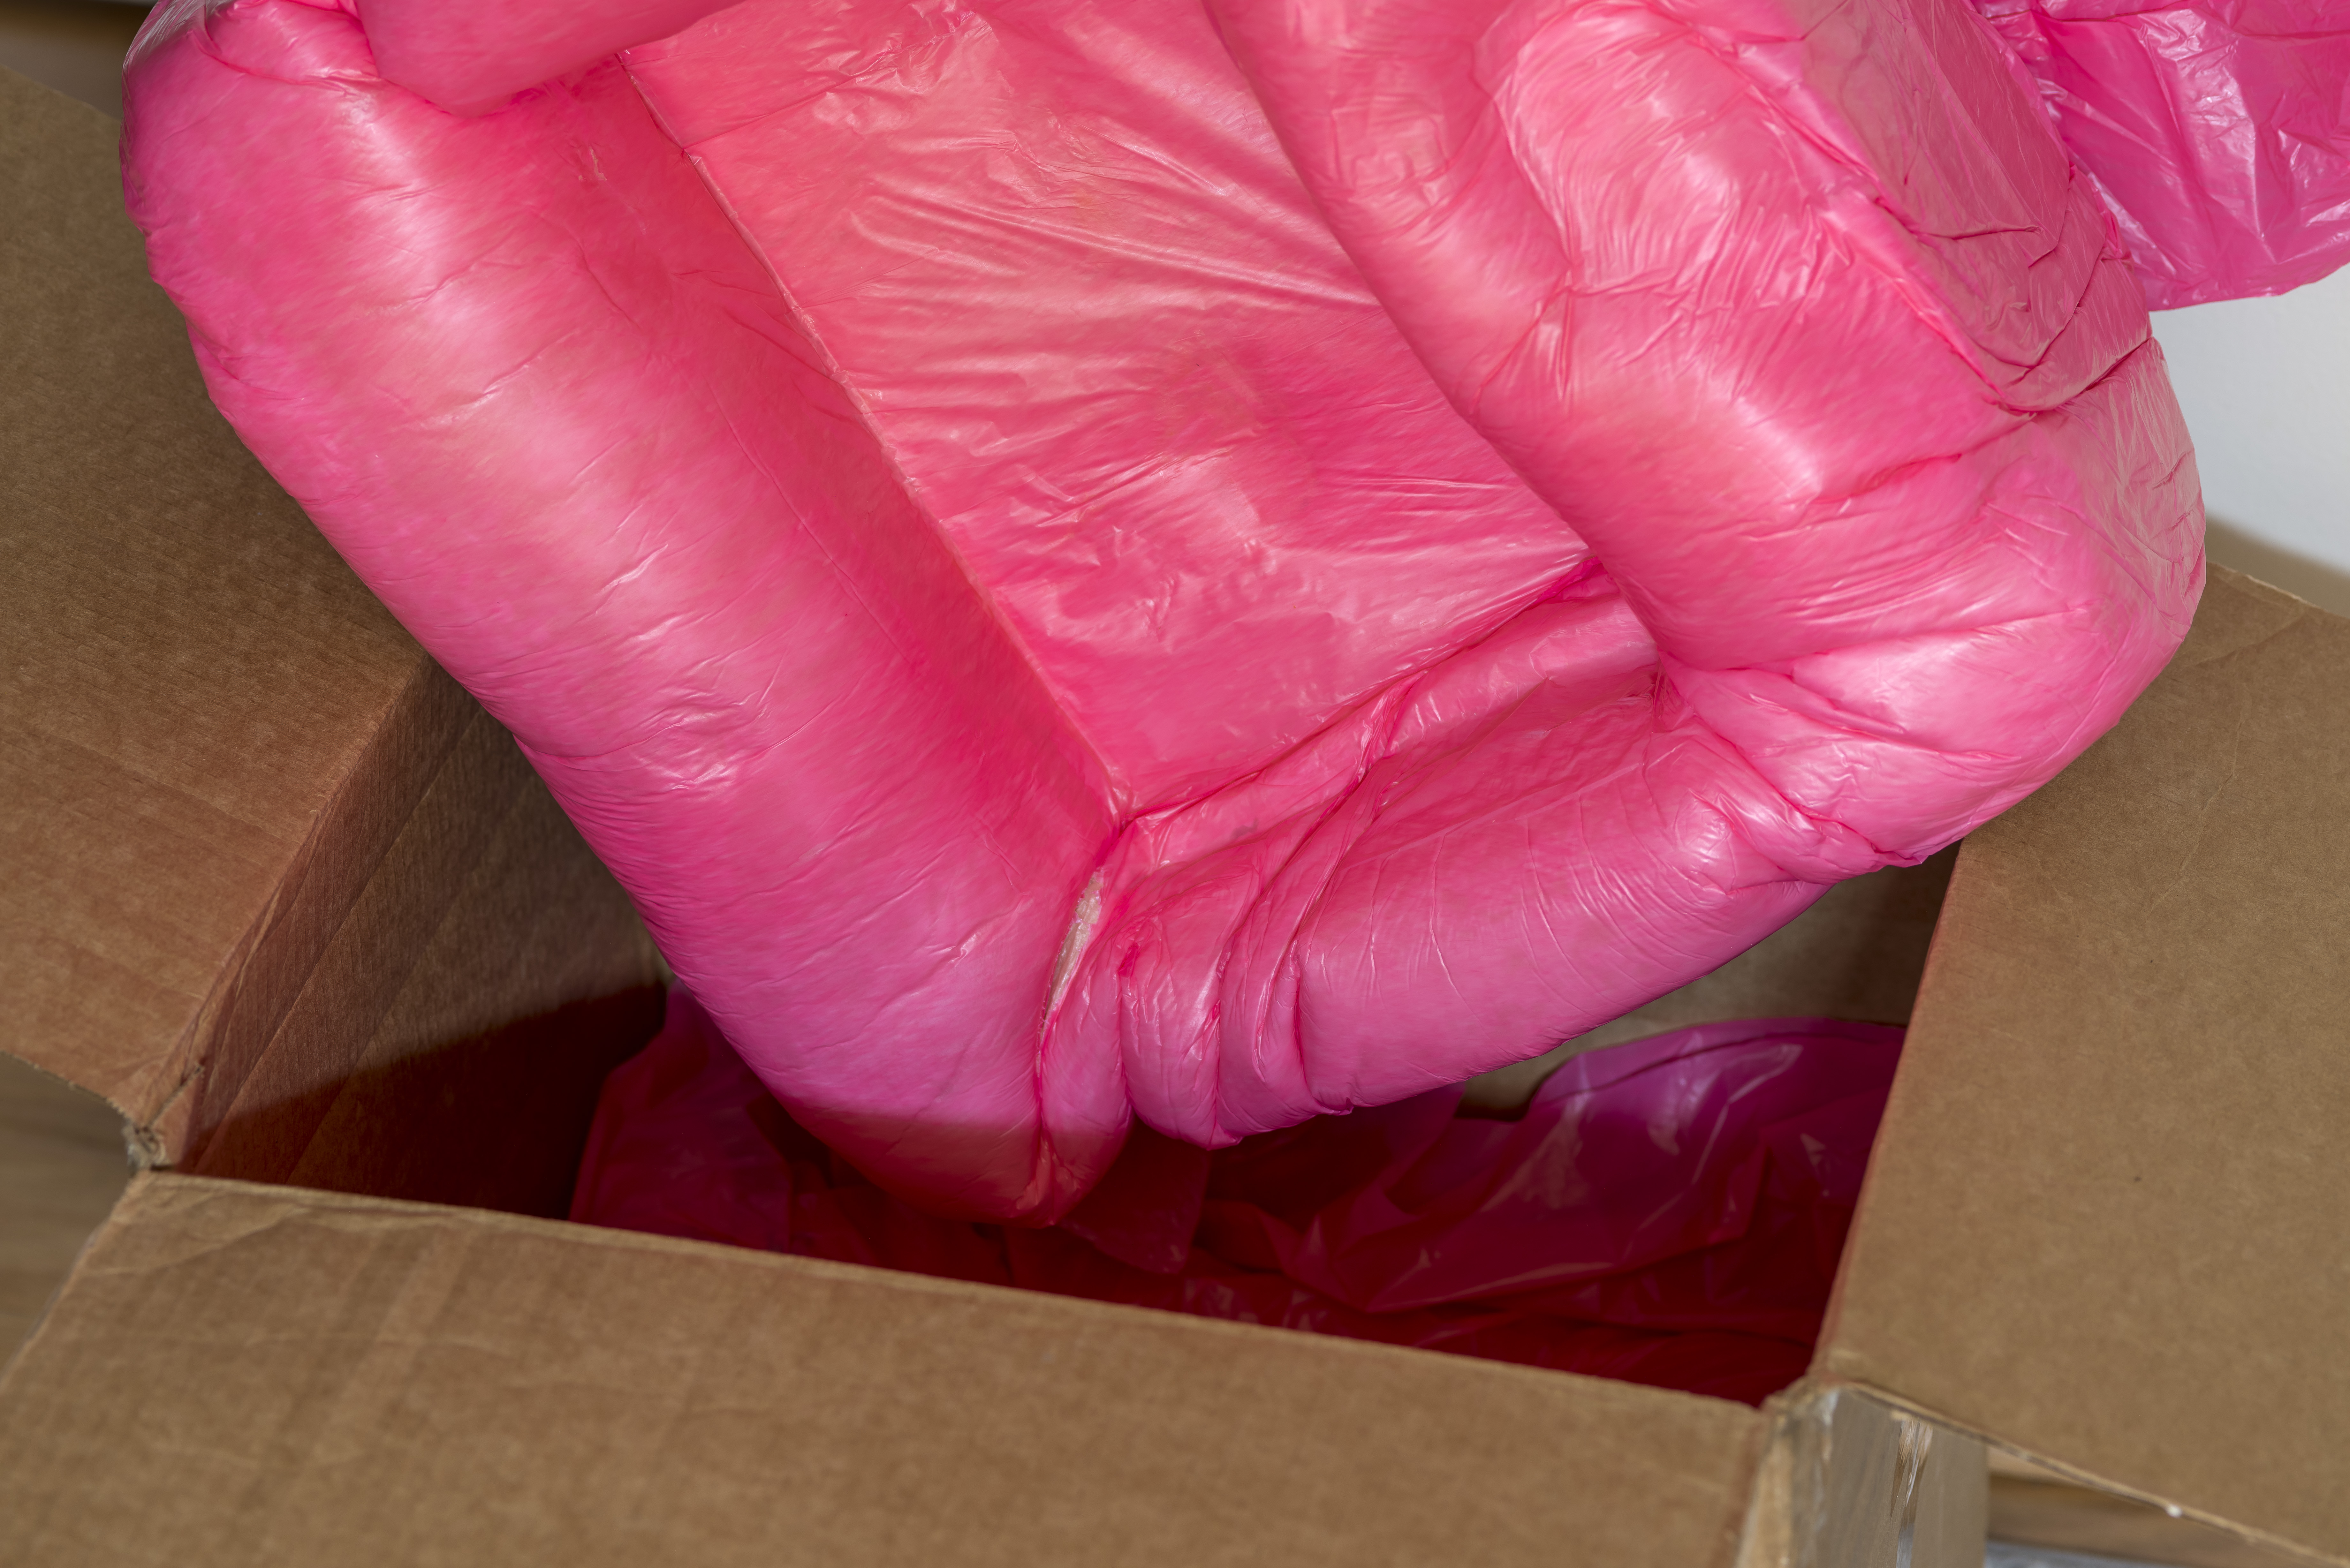
Image 50: Packing materials with expansion foam
It was very well packed, secured in the oversized box with plenty of expanding foam filled bags that hug the standard right in the center. One of the best ways to ship fragile test equipment in the regular postal service parsel.
SR104 itself was quite dirty with top leather handle destroyed in the past with only rused steel handle bars left flapping on the hinges. I’ve used 50/50 mix of isopropyl alcohol and water to clean up all outer surfaces.
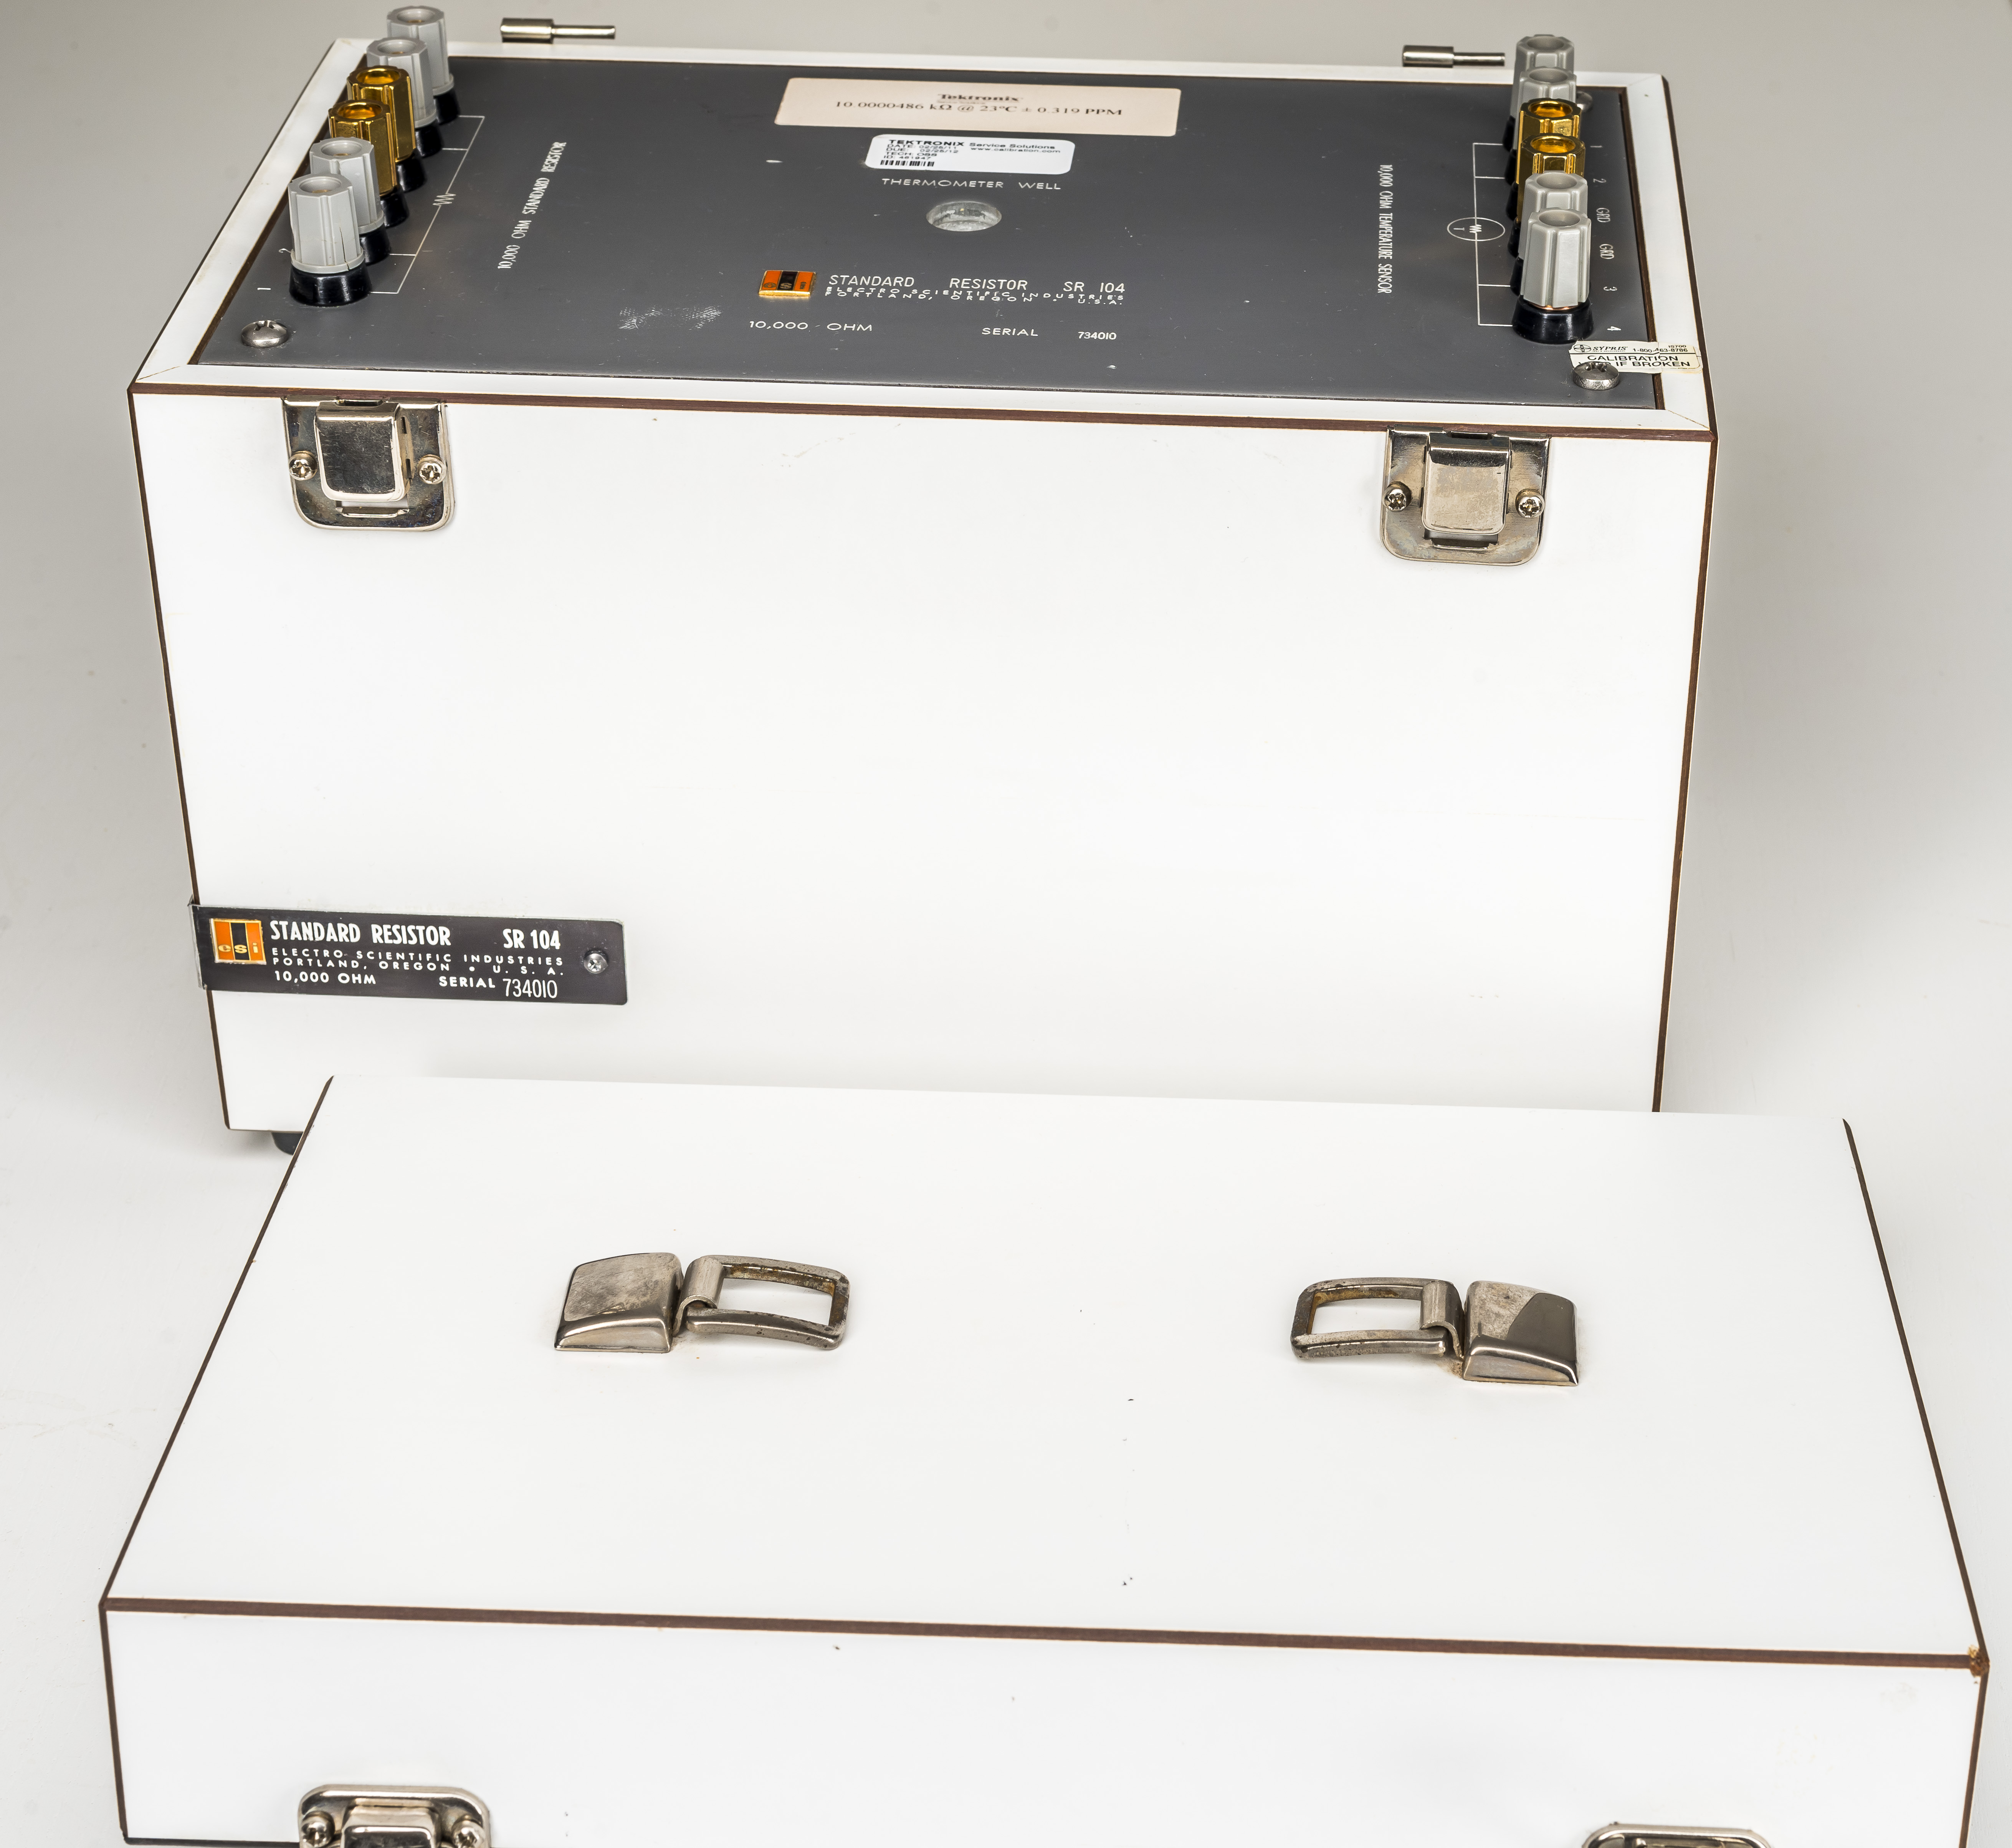
Image 51: Handle hinges on the top of SR104
This SR104 will need new handle to be in top shape again. Not a problem for our lab, as we always carry SR104 by supporting the bottom, just to get that extra feeling of safety and security :)
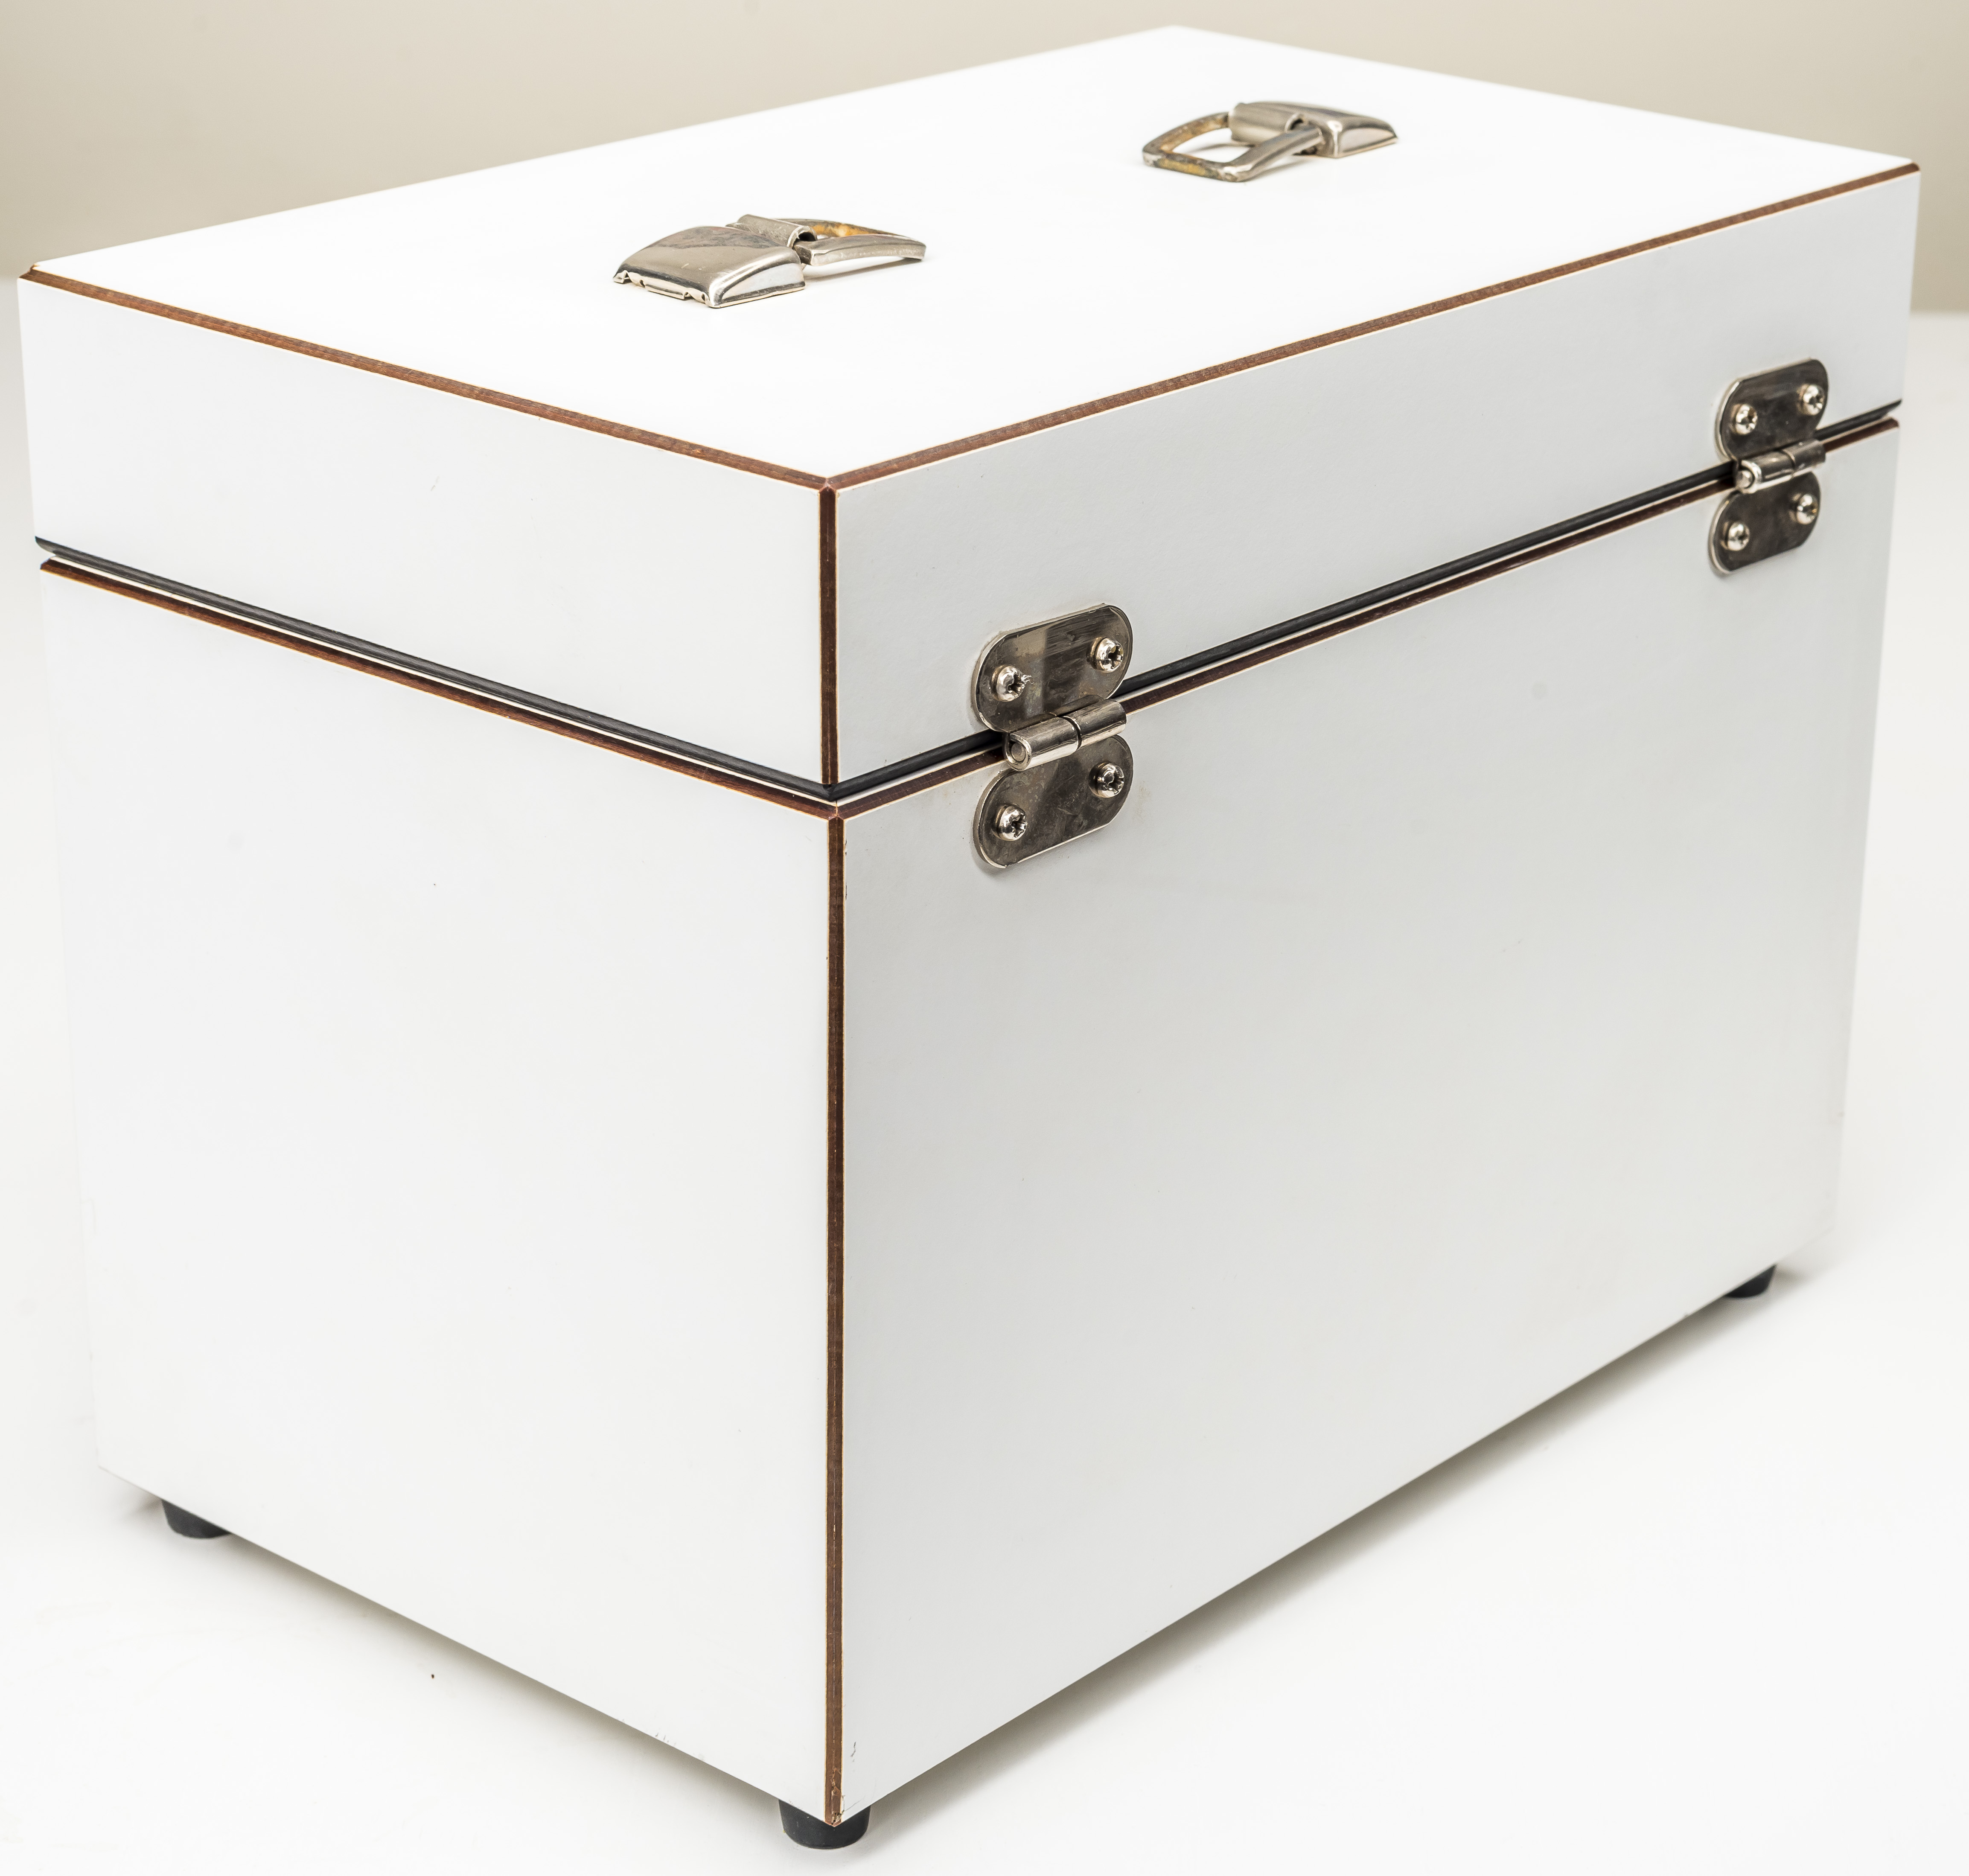
Image 52: SR104 S/N 734010 sides right
It cleaned up pretty good and left with just few blemishes here and there.
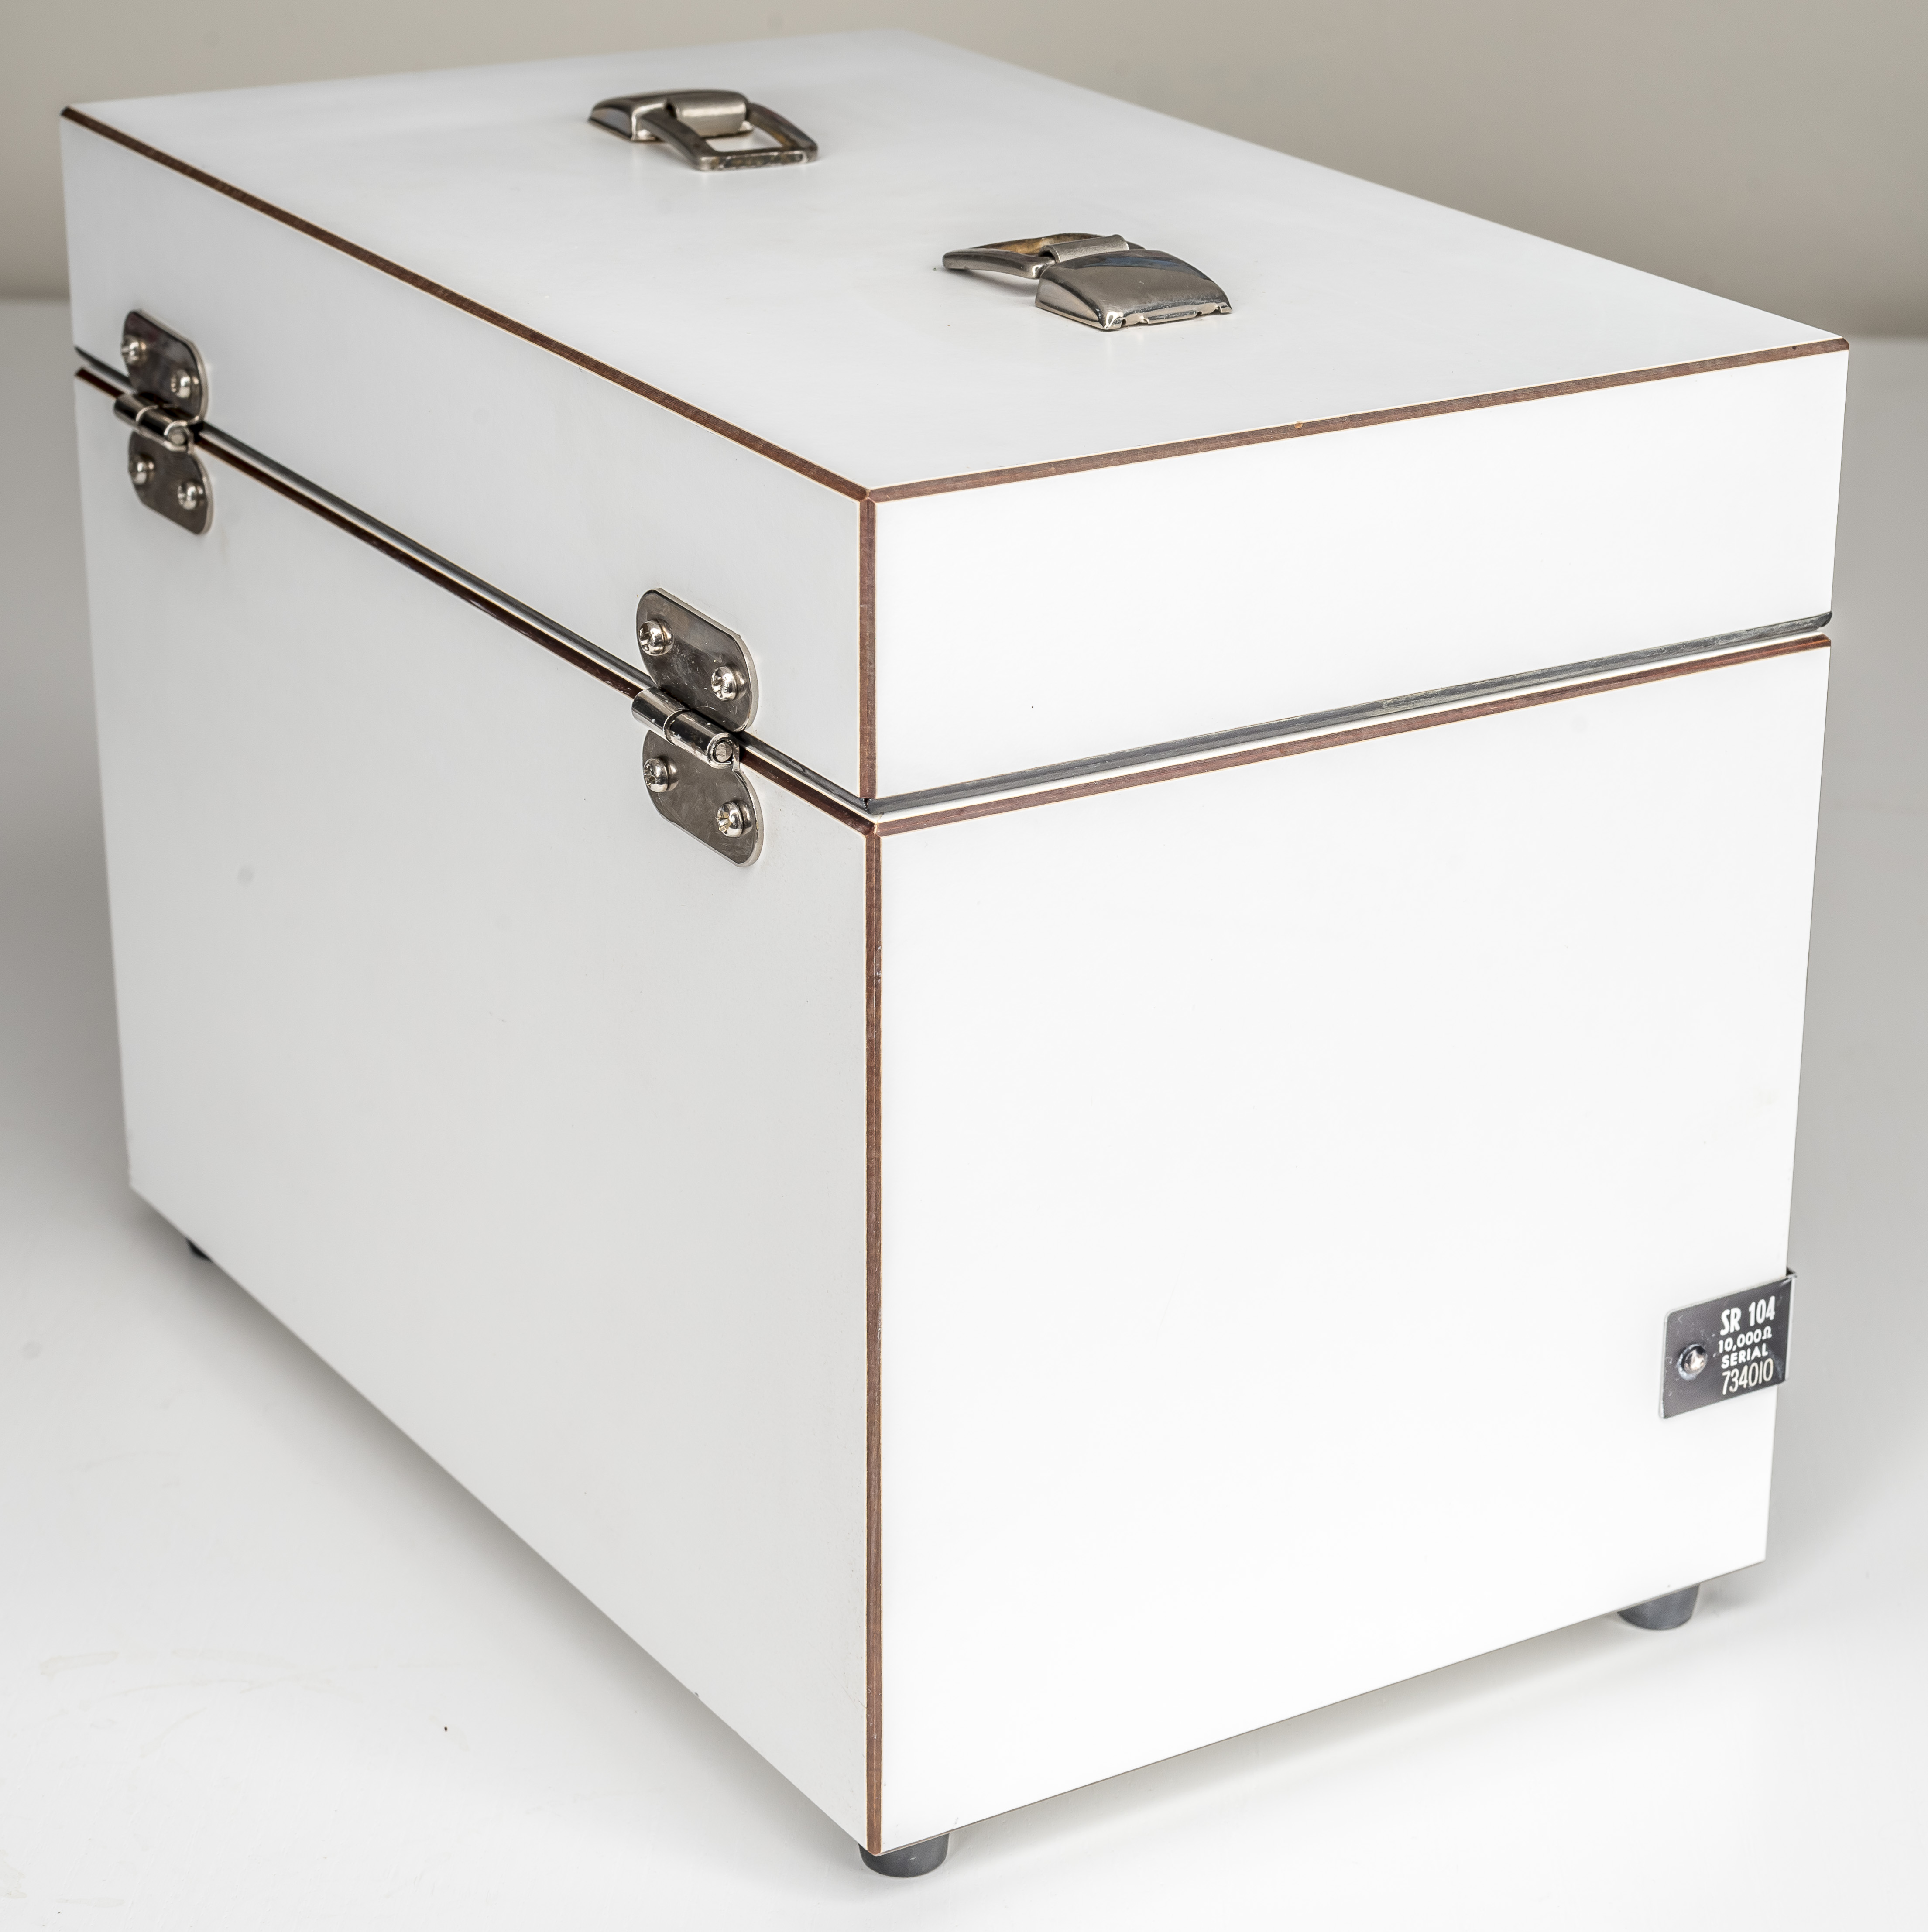
Image 53: SR104 S/N 734010 sides left
Lid with terminals sports few labels from newer Tektronix calibration, dated 25 February 2011. Larger label have useful value 10000.0486 Ω at +23 °C with uncertainty 0.319 µΩ/Ω. We can use this value later to calculate drift over time estimate. There is one more label by Sypris Electronics but no any useful information available from there.
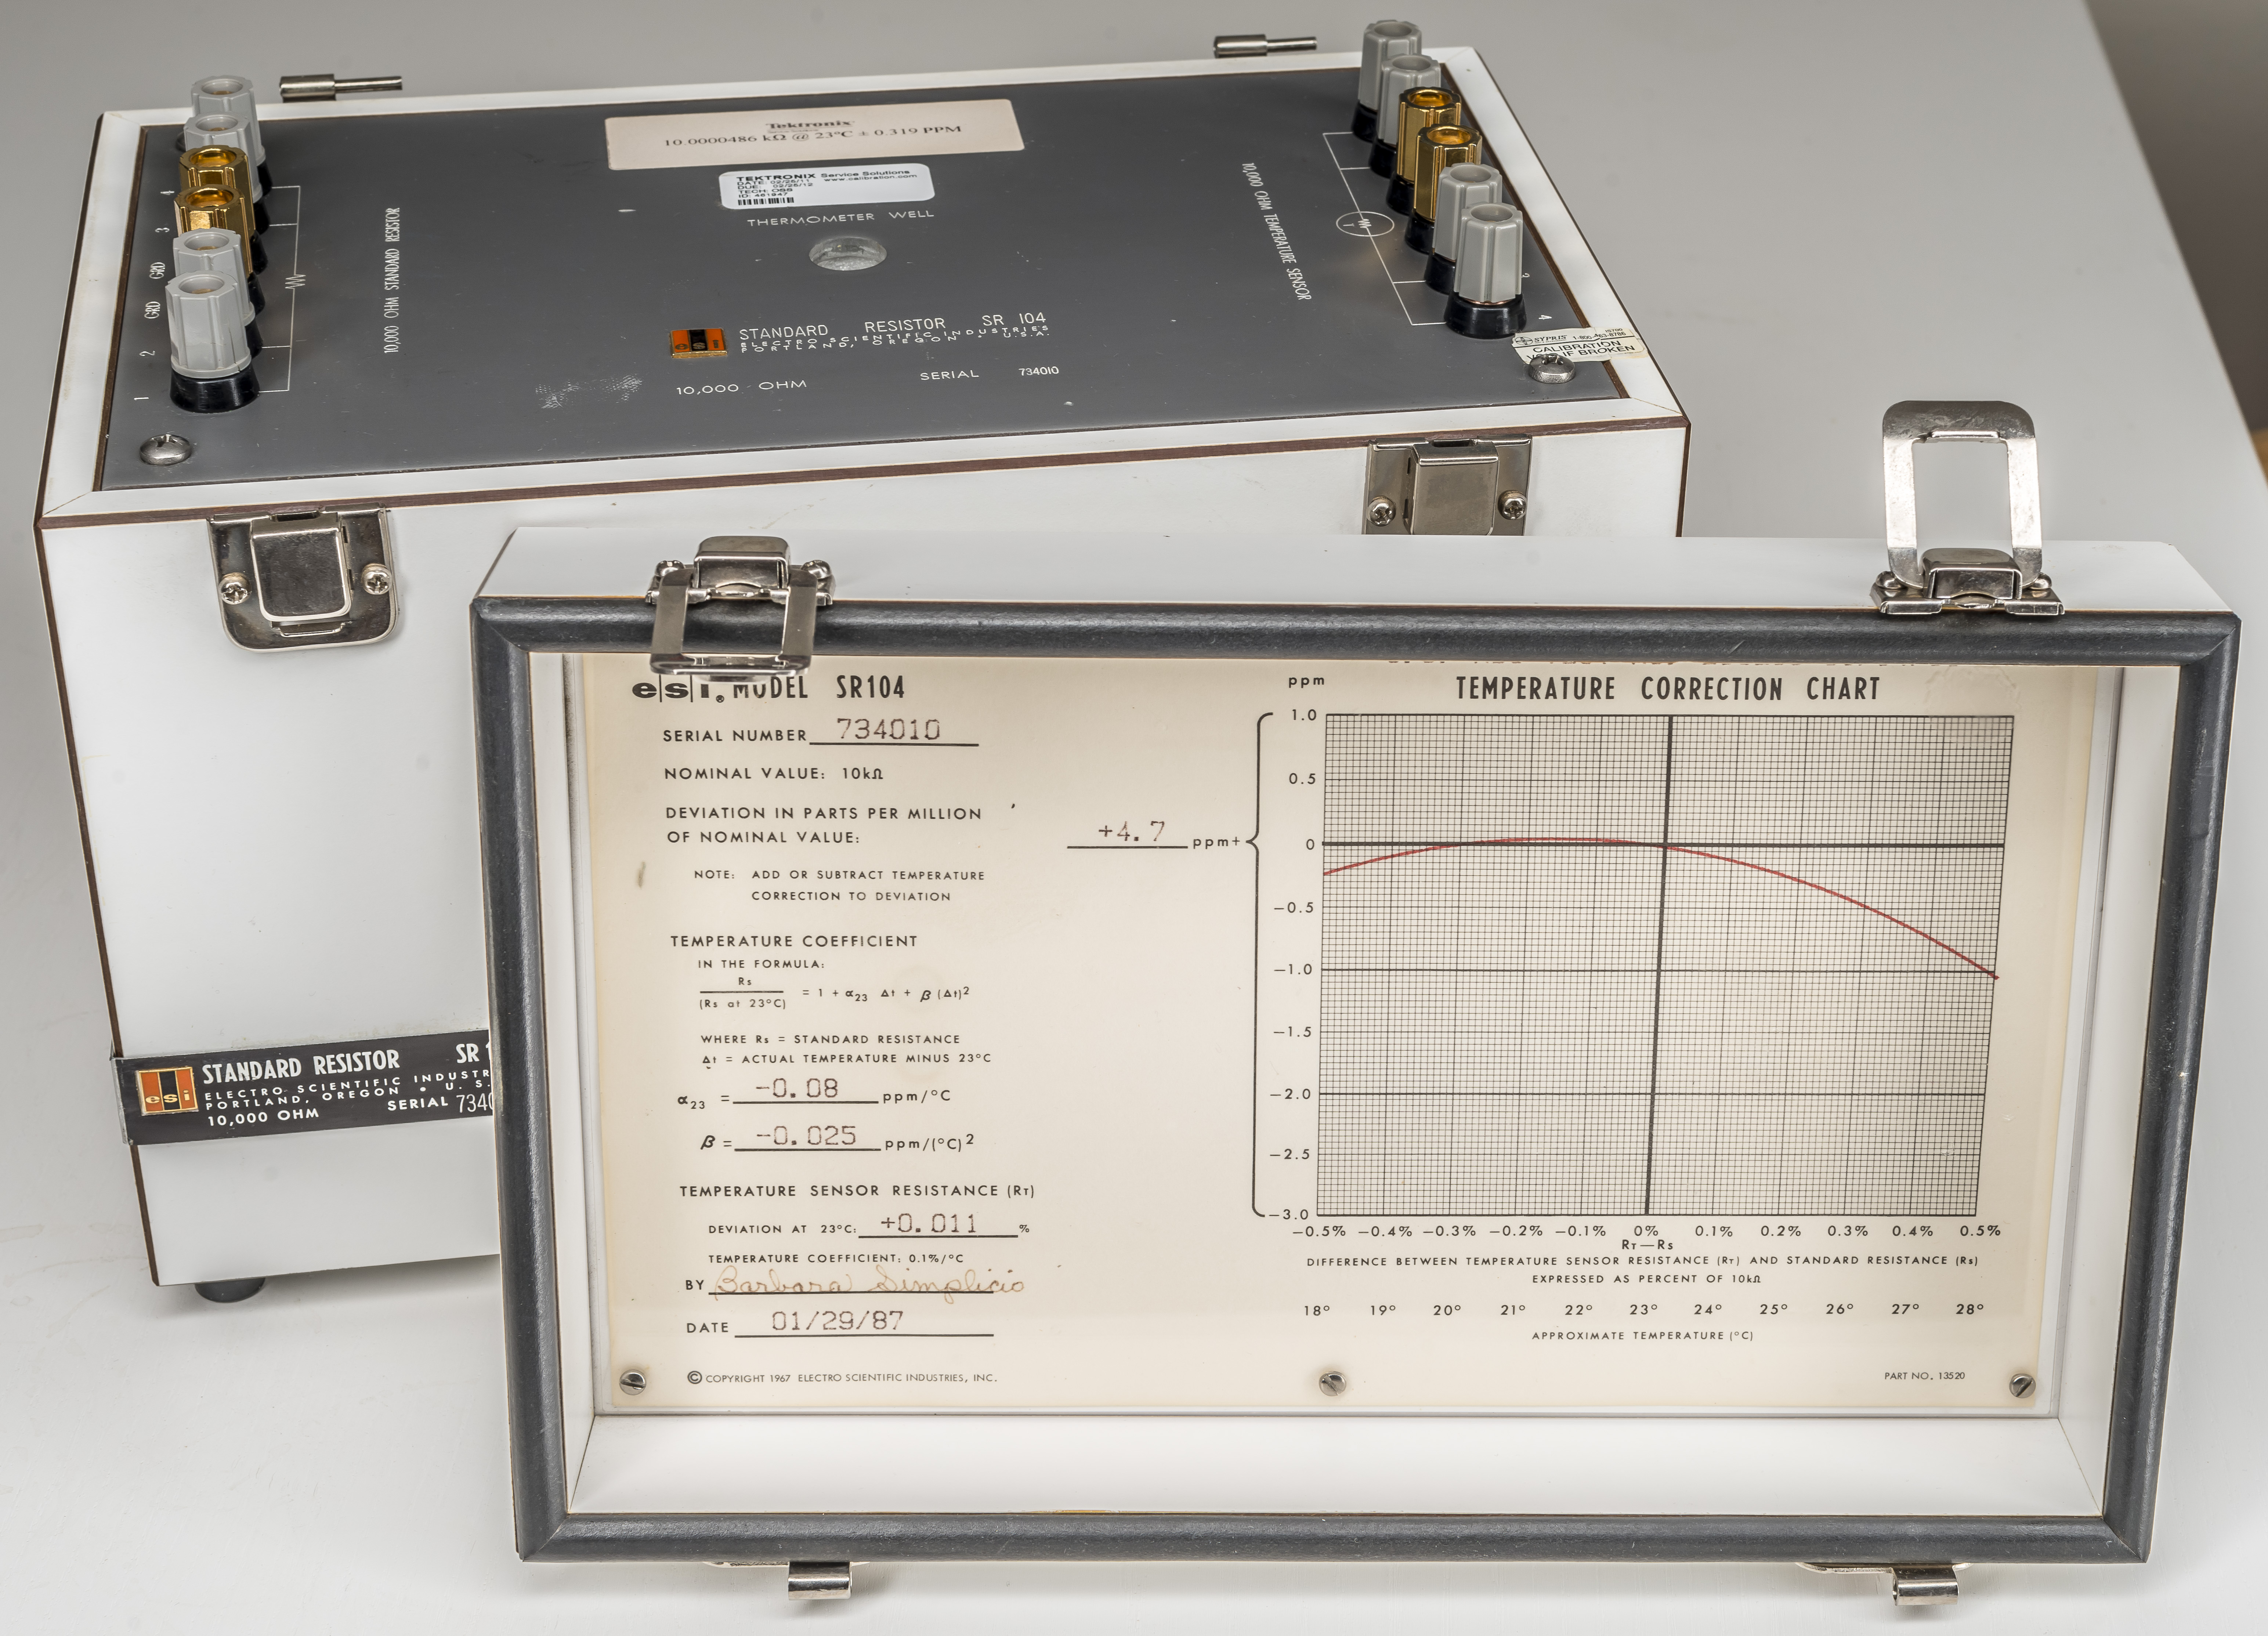
Image 54: SR104 lid removed
Top cover lid easily detaches from the steel hinged guides by sliding to the right. Keep this in mind when handling SR104 by the lid only, to avoid the heavy standard sliding off and falling. That might ruin a good day and years of history.
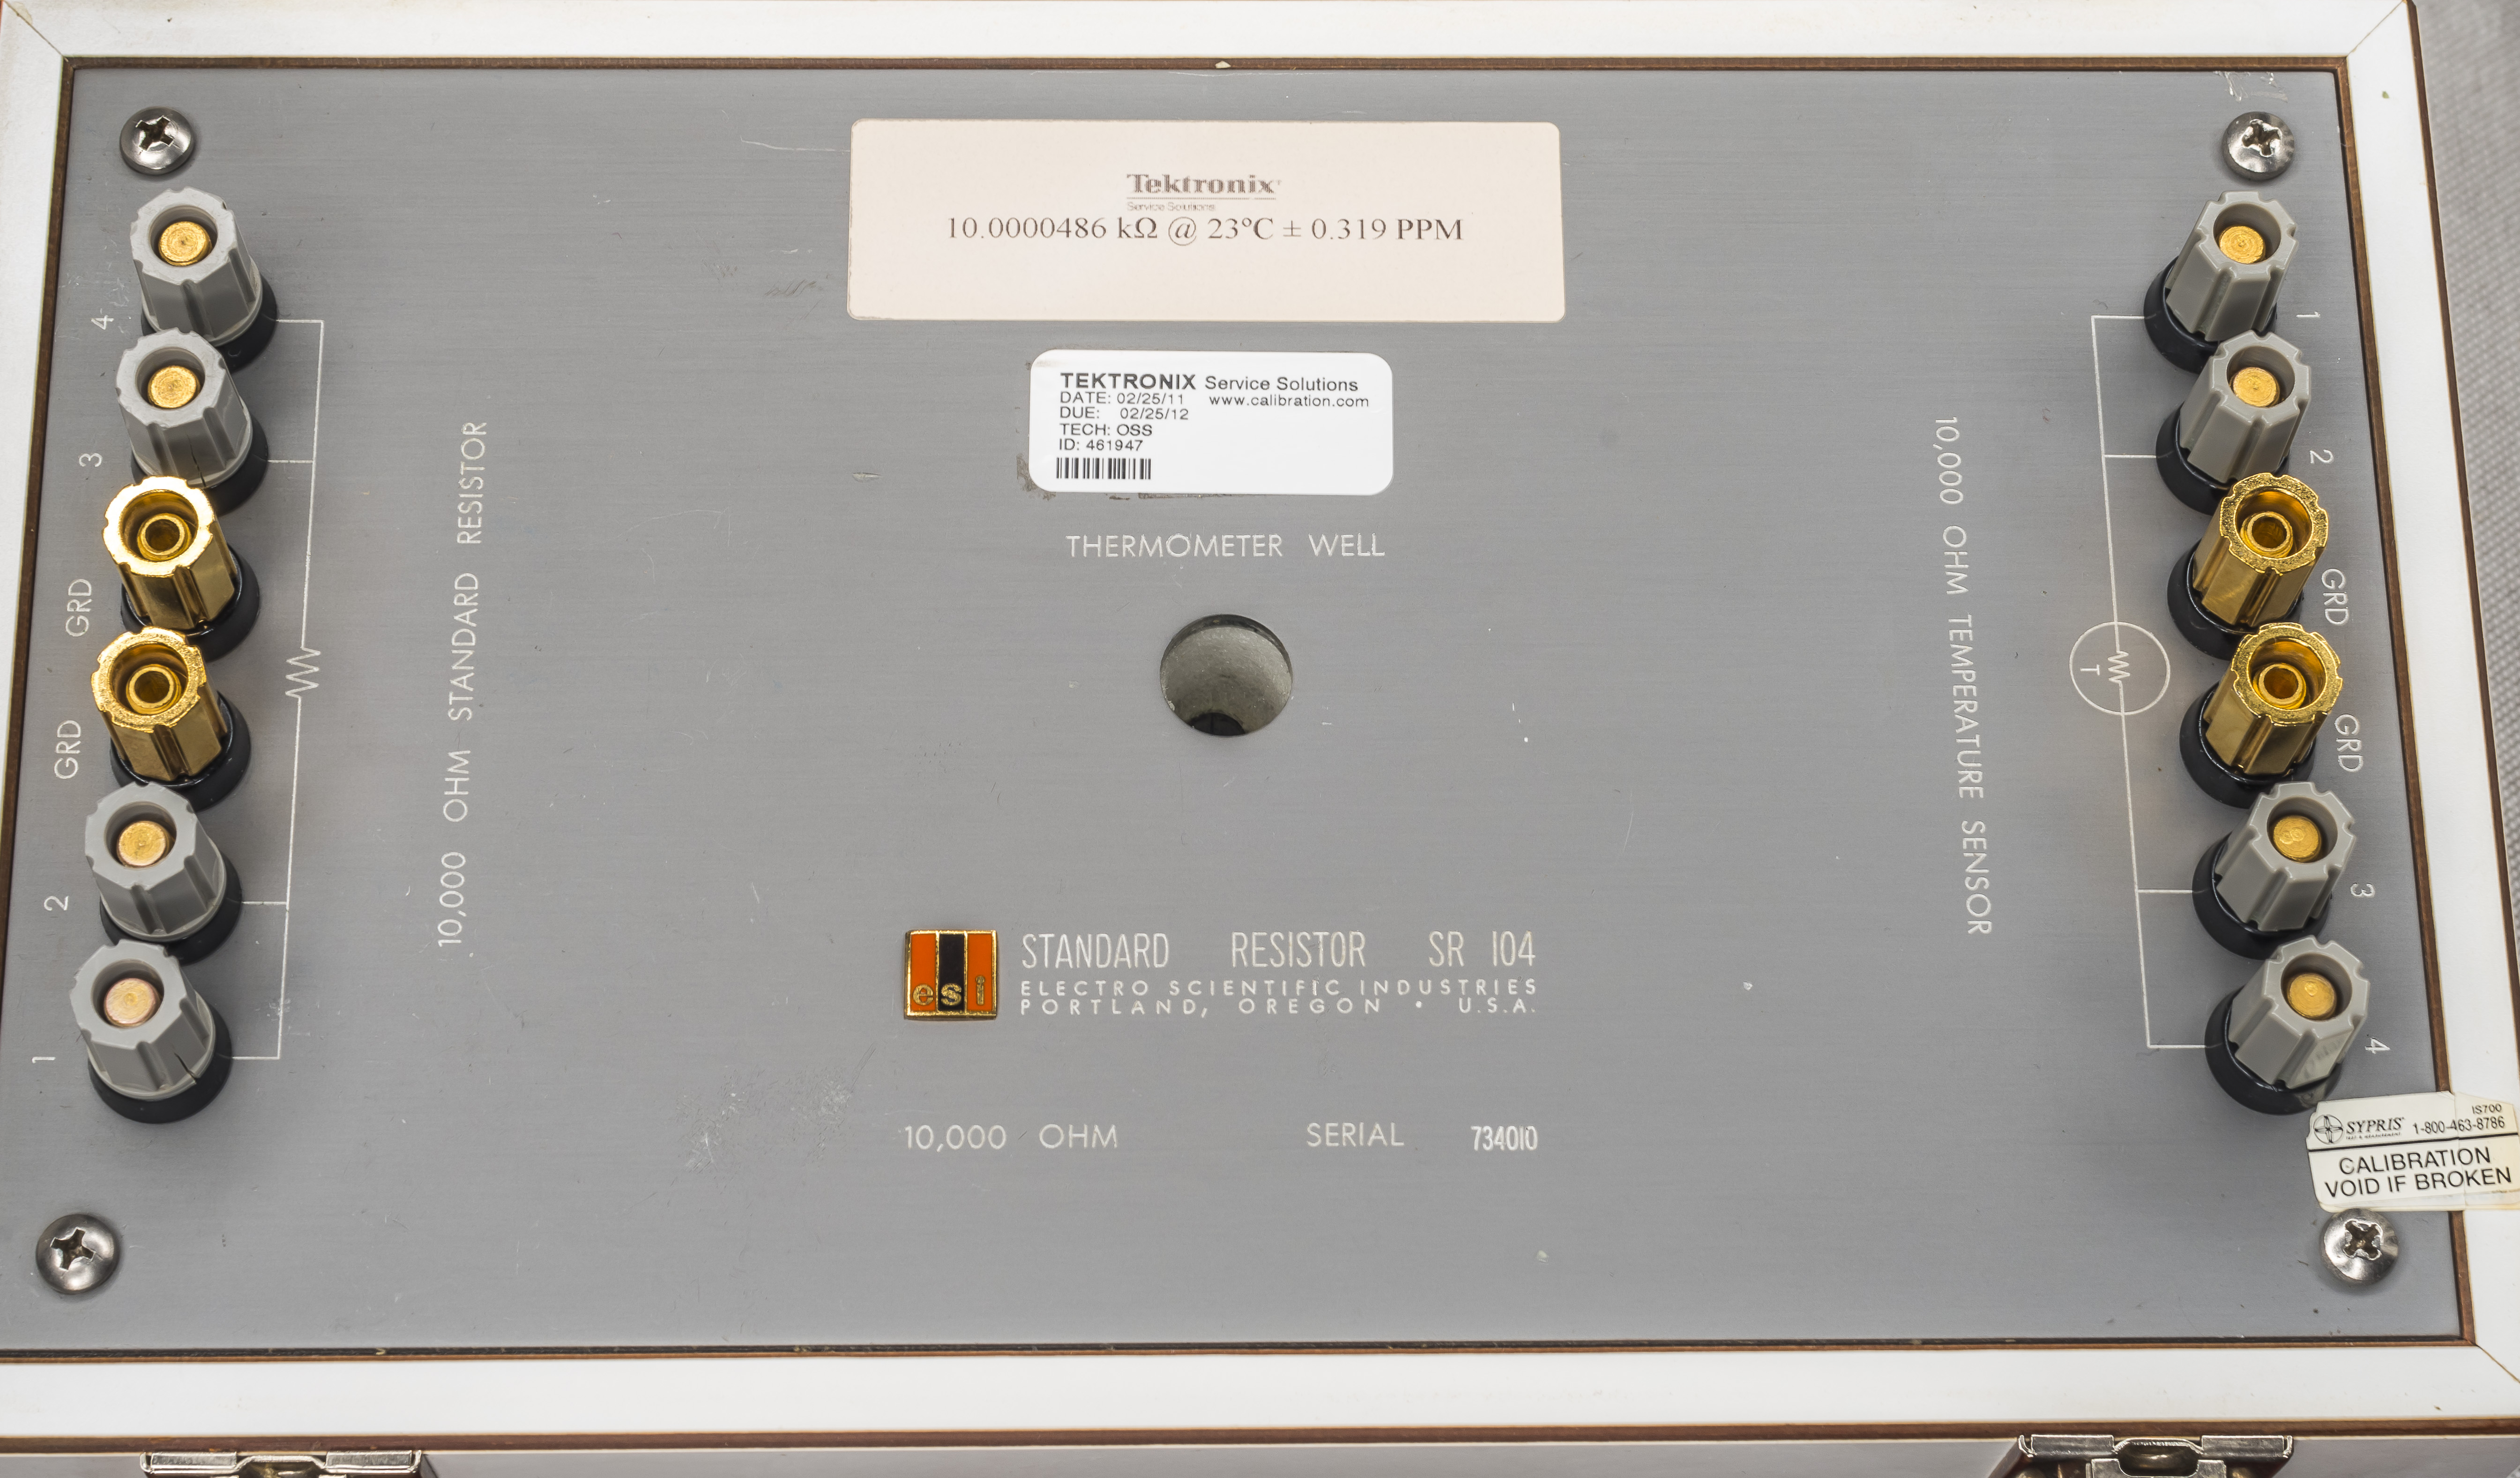
Image 55: SR104 S/N 734010 top surface with connection points and thermal well port
To avoid rusted steel bars from handle adding more scratches on the lid, I’ve removed them and put into bag to come with the box separately. No oil residues anywhere, so this unit was probably a shelf queen.
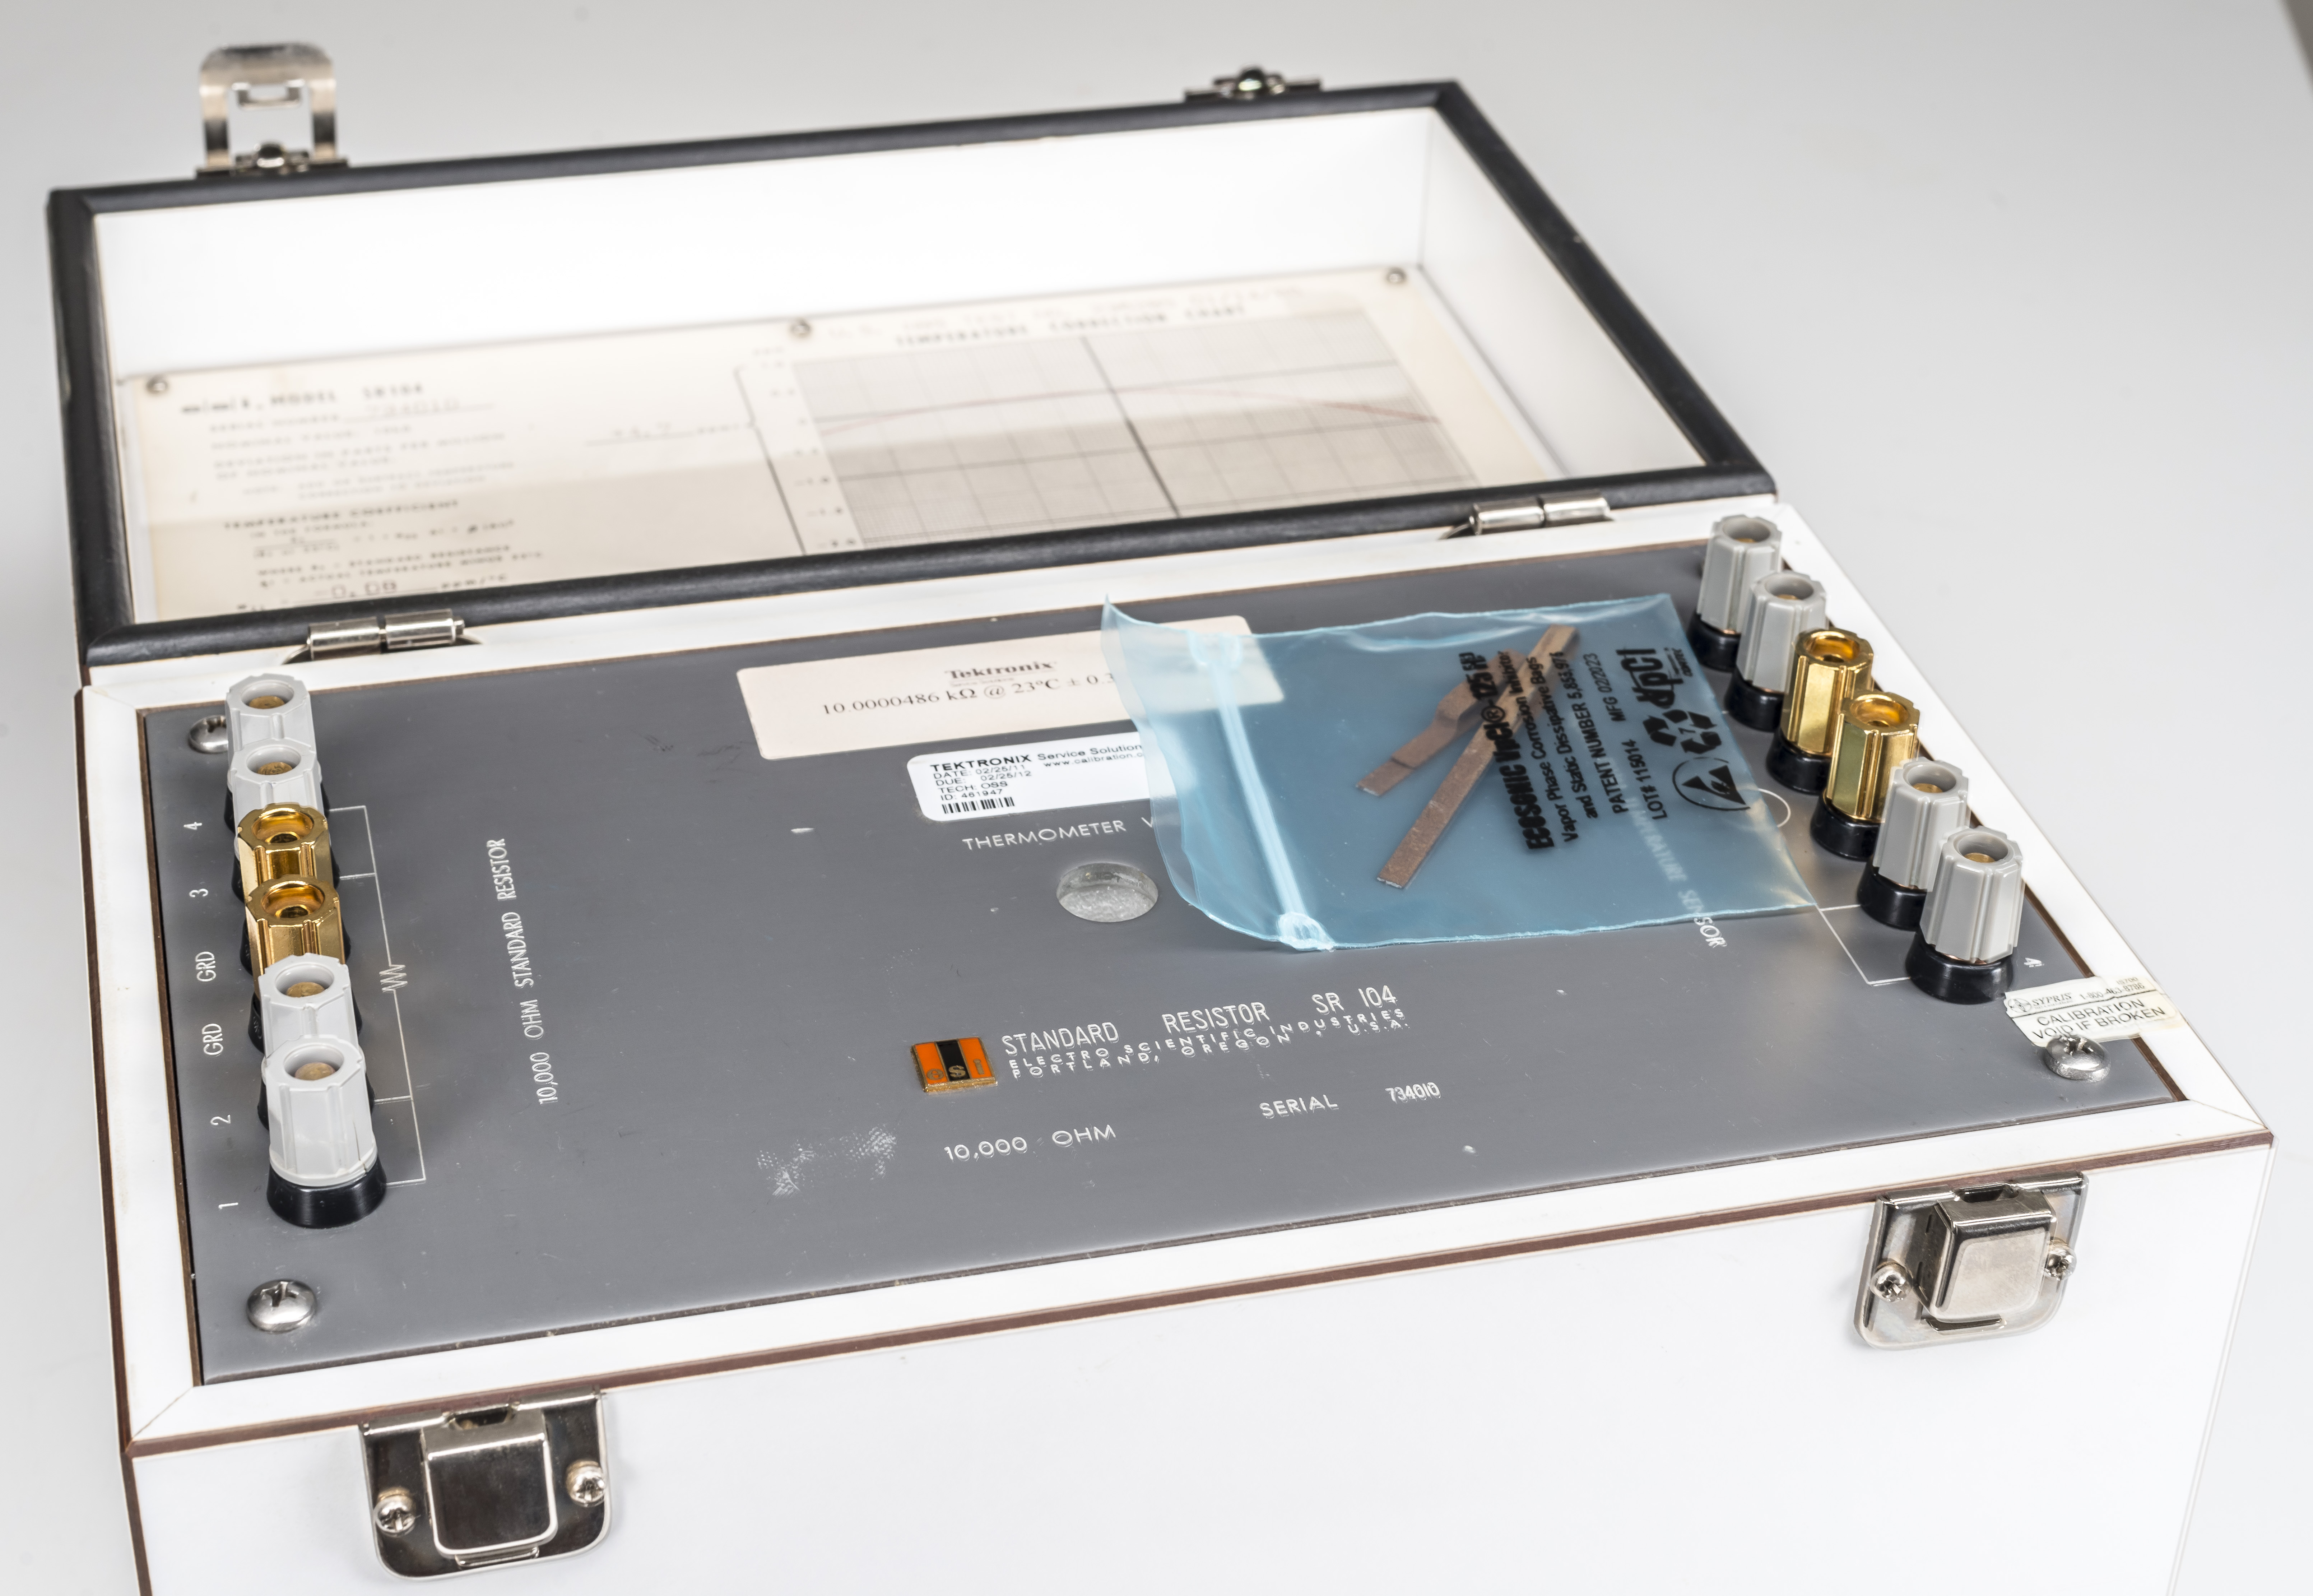
Image 56: Back with rusted steel bars used to support handle
Traditional SR104 label with data presents us with rather large temperature coeffients at α = -0.08 µΩ/Ω/K ; β = -0.025 µΩ/Ω/K2. RT deviation recorded at 0.011 % with standard TC 0.1%/K.
With these numbers this SR104 would need to be maintained inside +18 °C to +25 °C to stay within 0.25 µΩ/Ω window from the zero TC point. Calibration was signed by Barbara Simplicio on a good day of January 29, 1987. I wish for these days to have more names of the proud people, making modern instruments :).
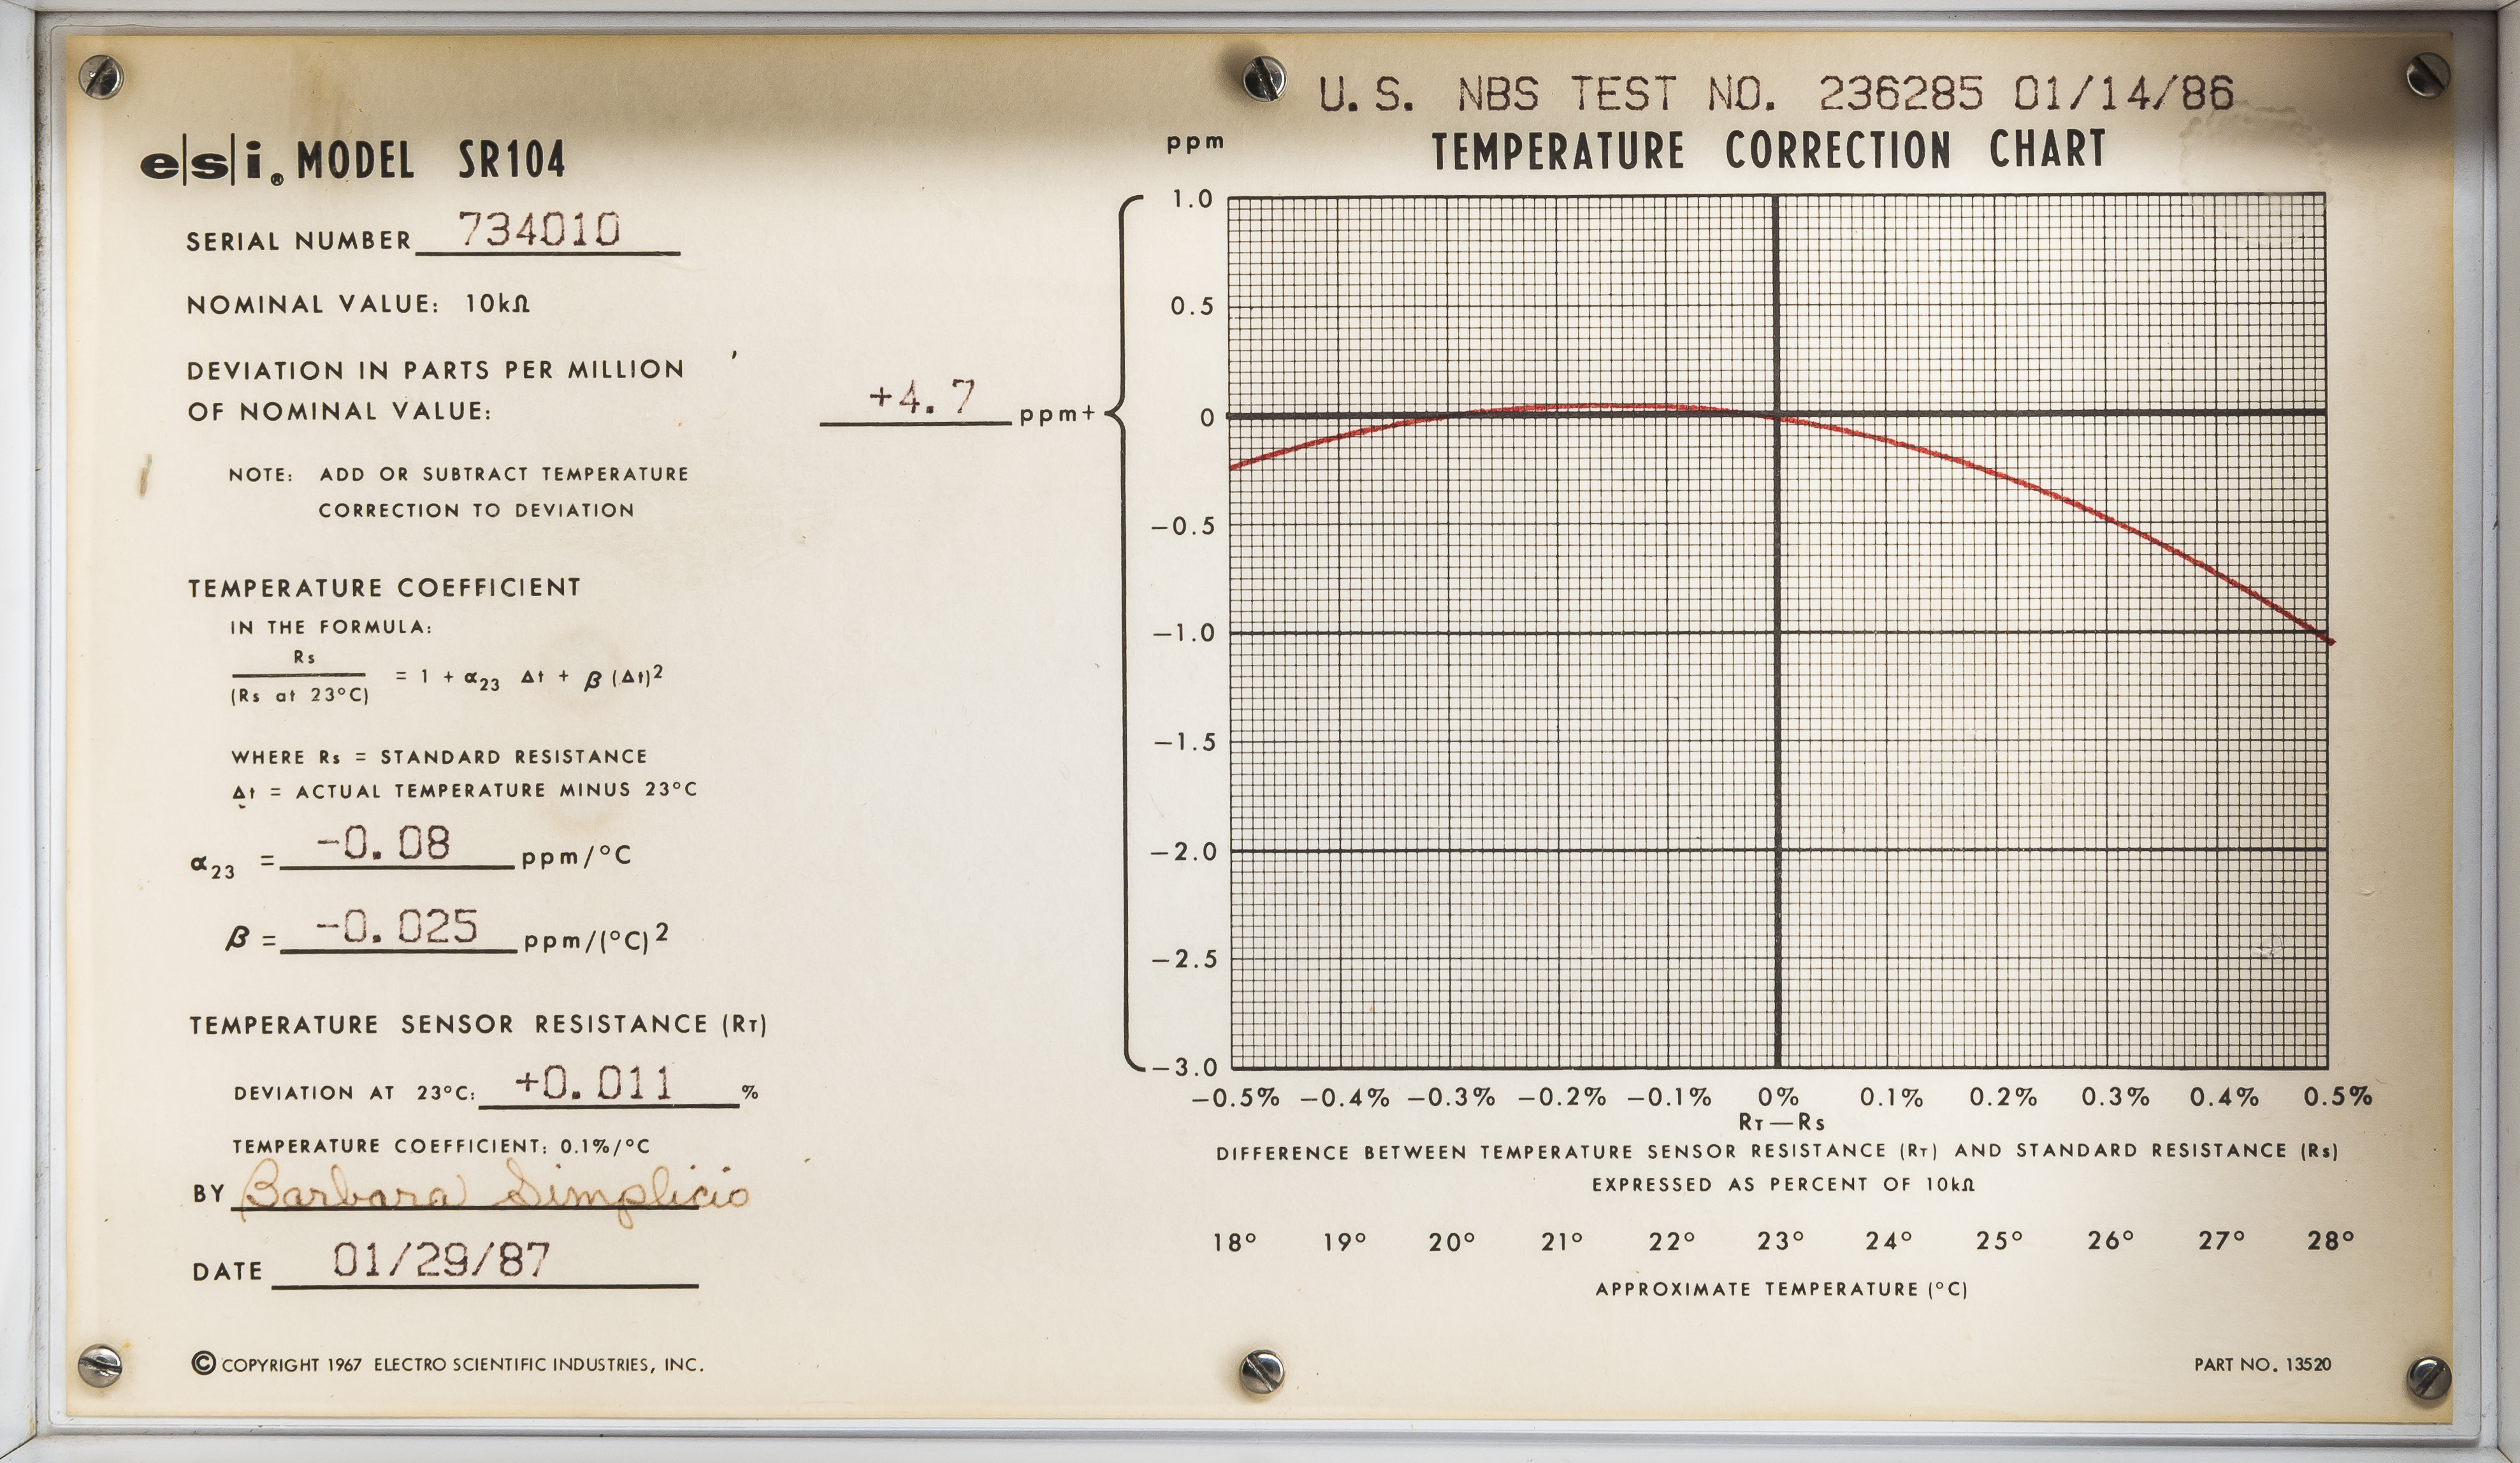
Image 57: SR104 S/N 734010 calibration certificate label
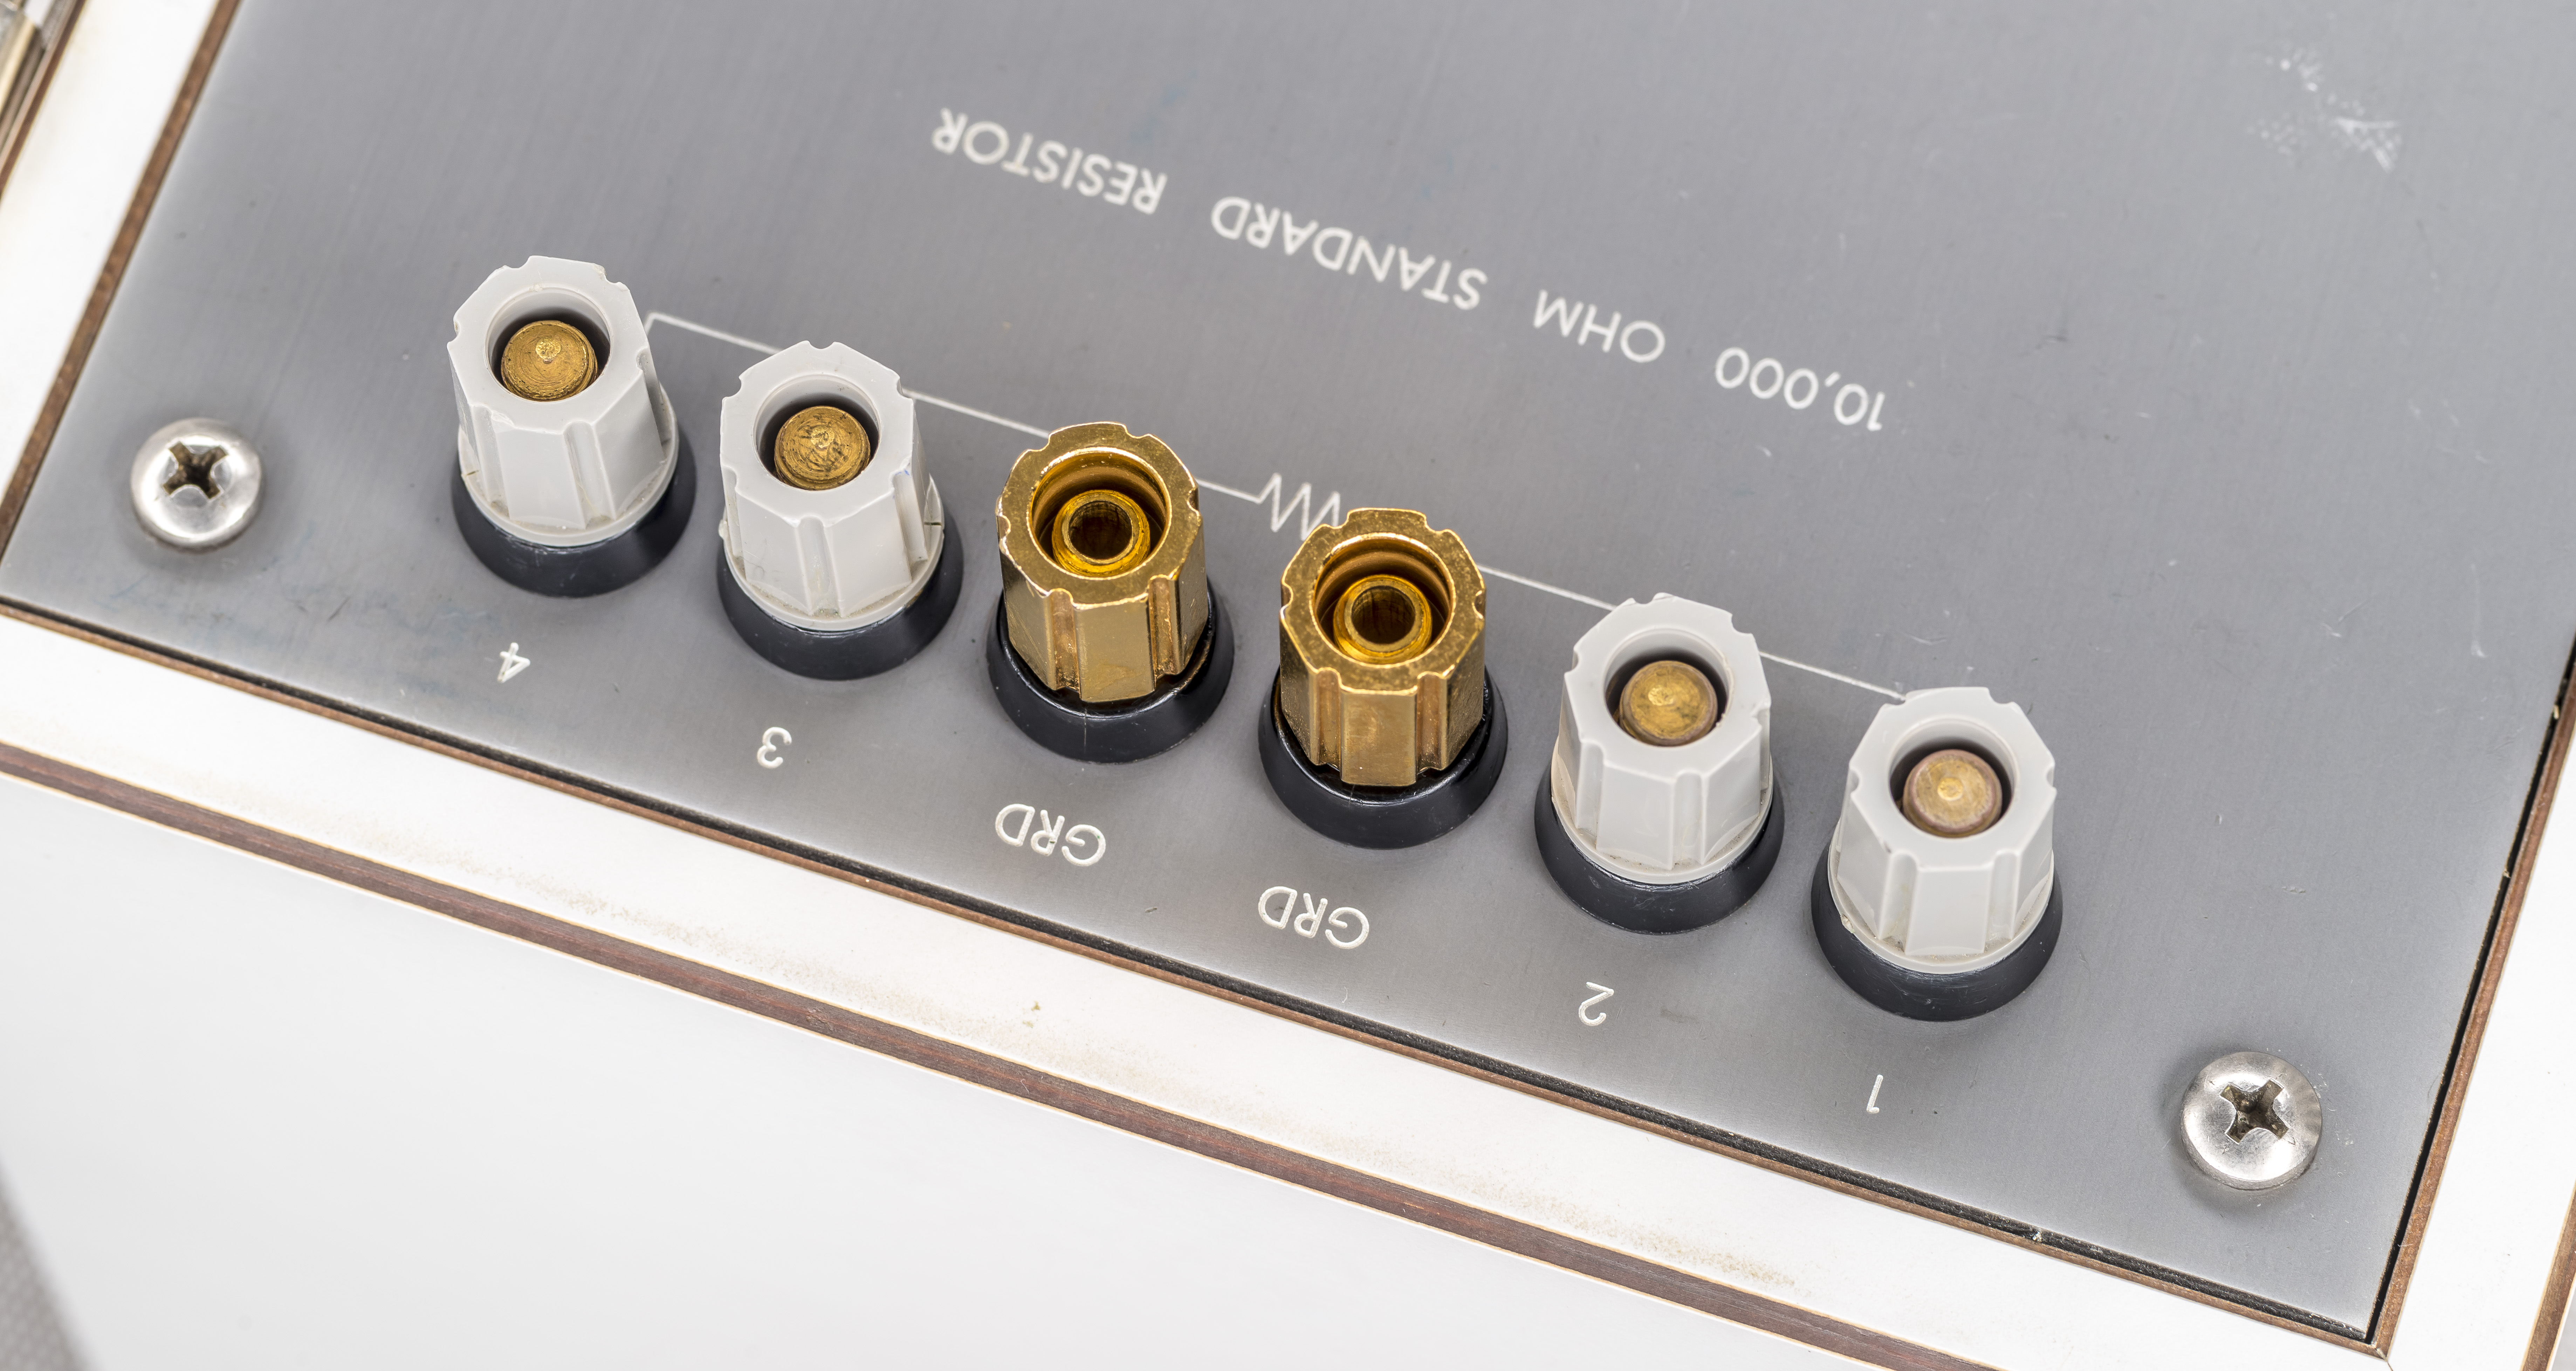
Image 58: Resistance output terminals
Both outputs use solid turrets with a side hole for the wire connection. Some of the ESI SR104’s have 5-way posts, others are only 2 way posts :) I like the solid version better, since they encourage users to utilize proper interfaces instead of banana cables or adapters that usually are of poor quality.
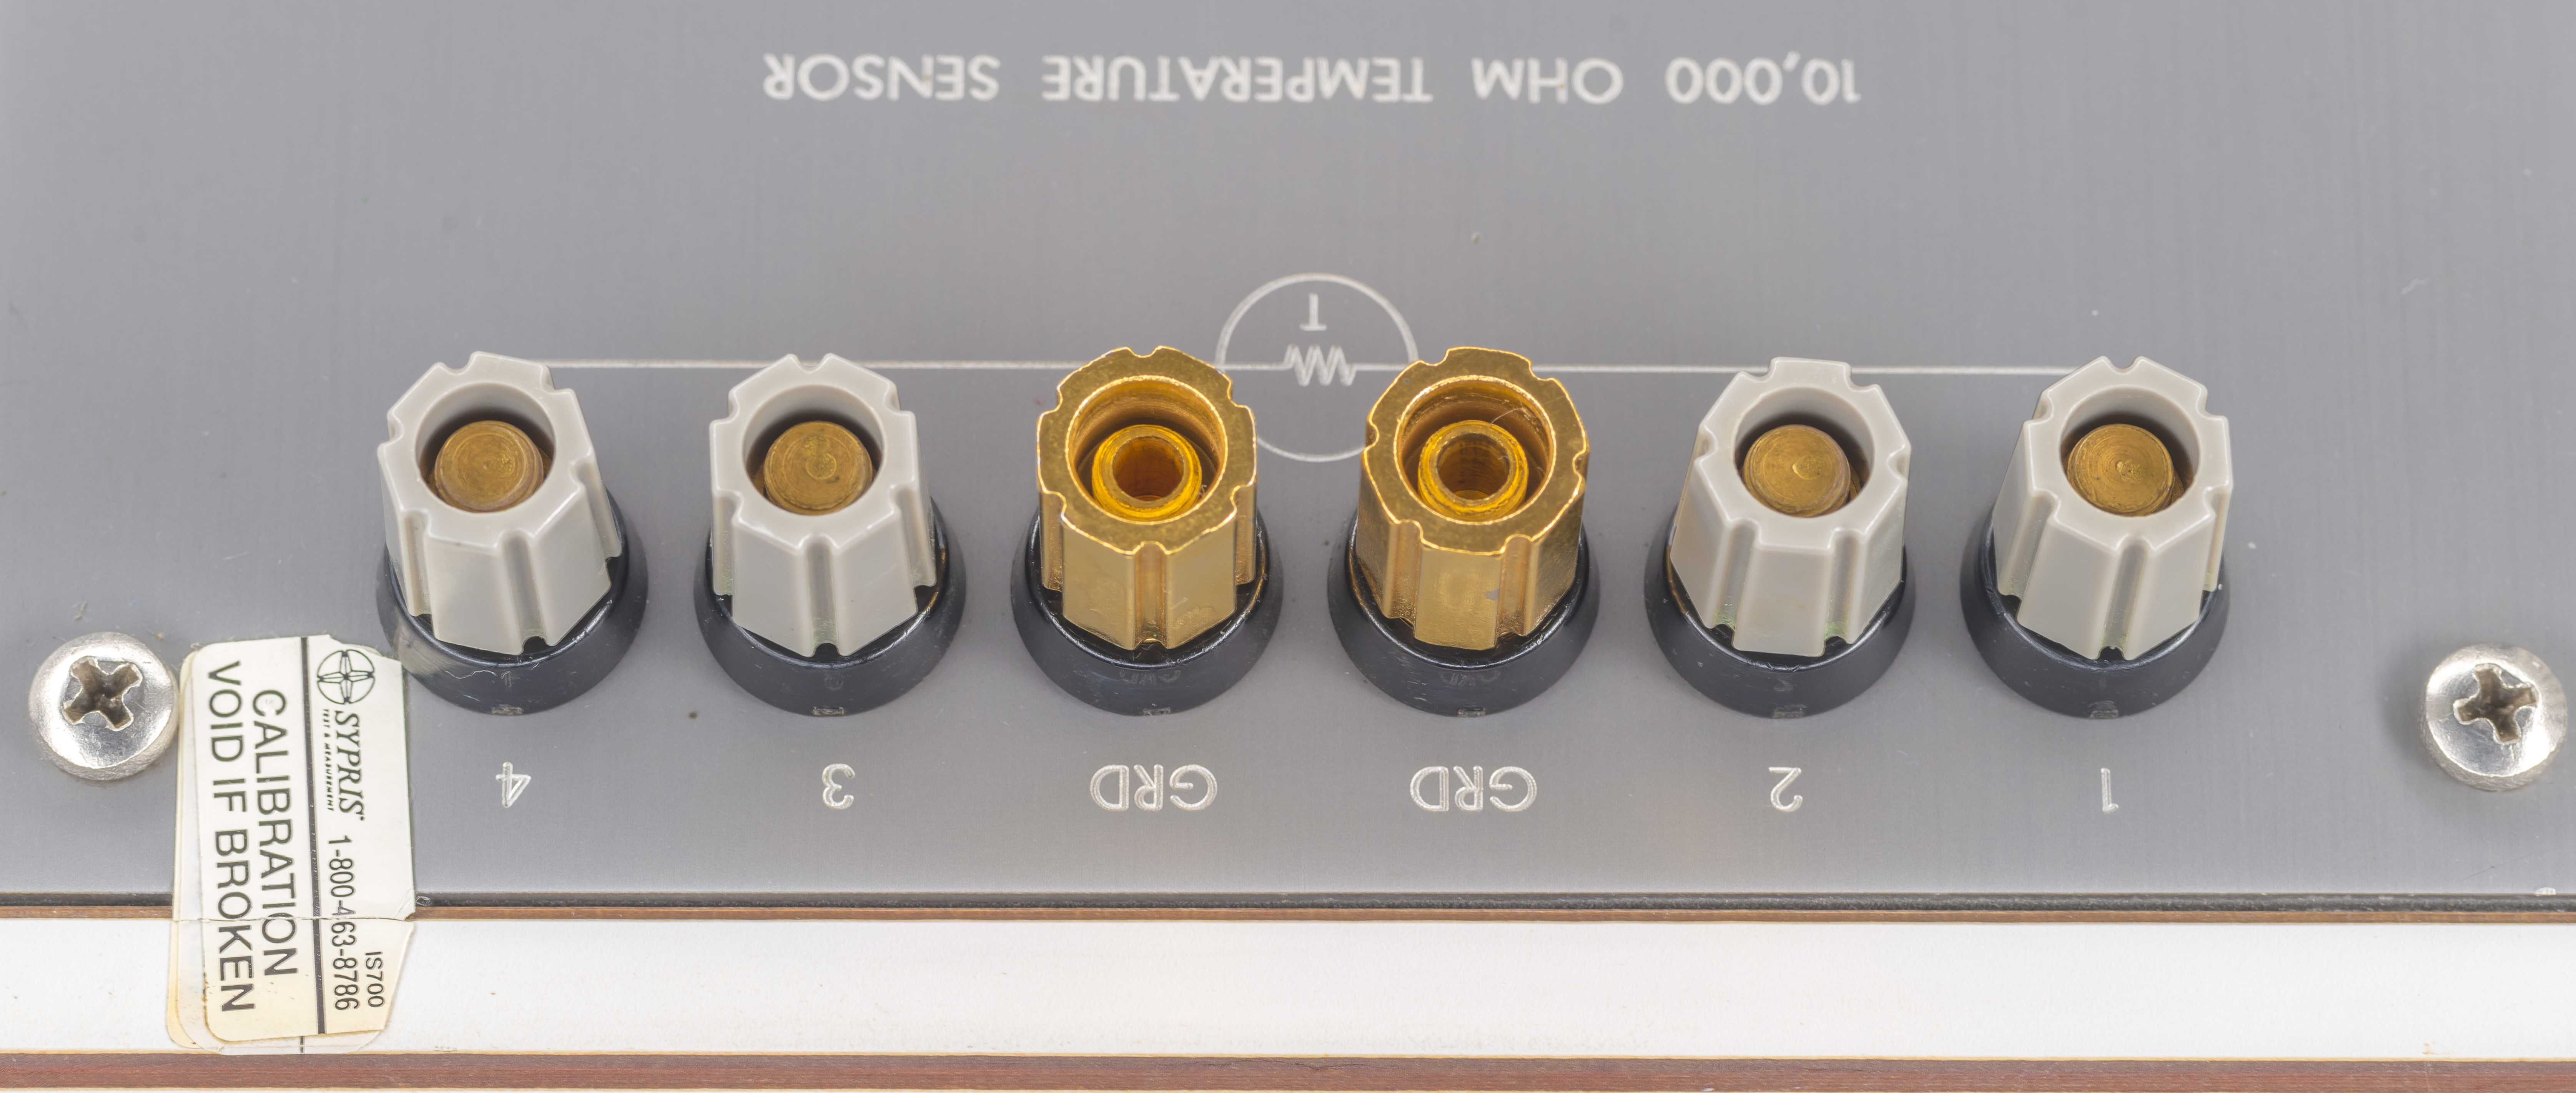
Image 59: Temperature sensor output terminals
To clean up terminals and knobs I’ve used 91% isopropyl alcohol with a soft 3M Scotch-Brite pad, moving around all metal surfaces for half a minute in circular directions. The remaining bits and particles were then removed with a paper towel and dried compressed air.
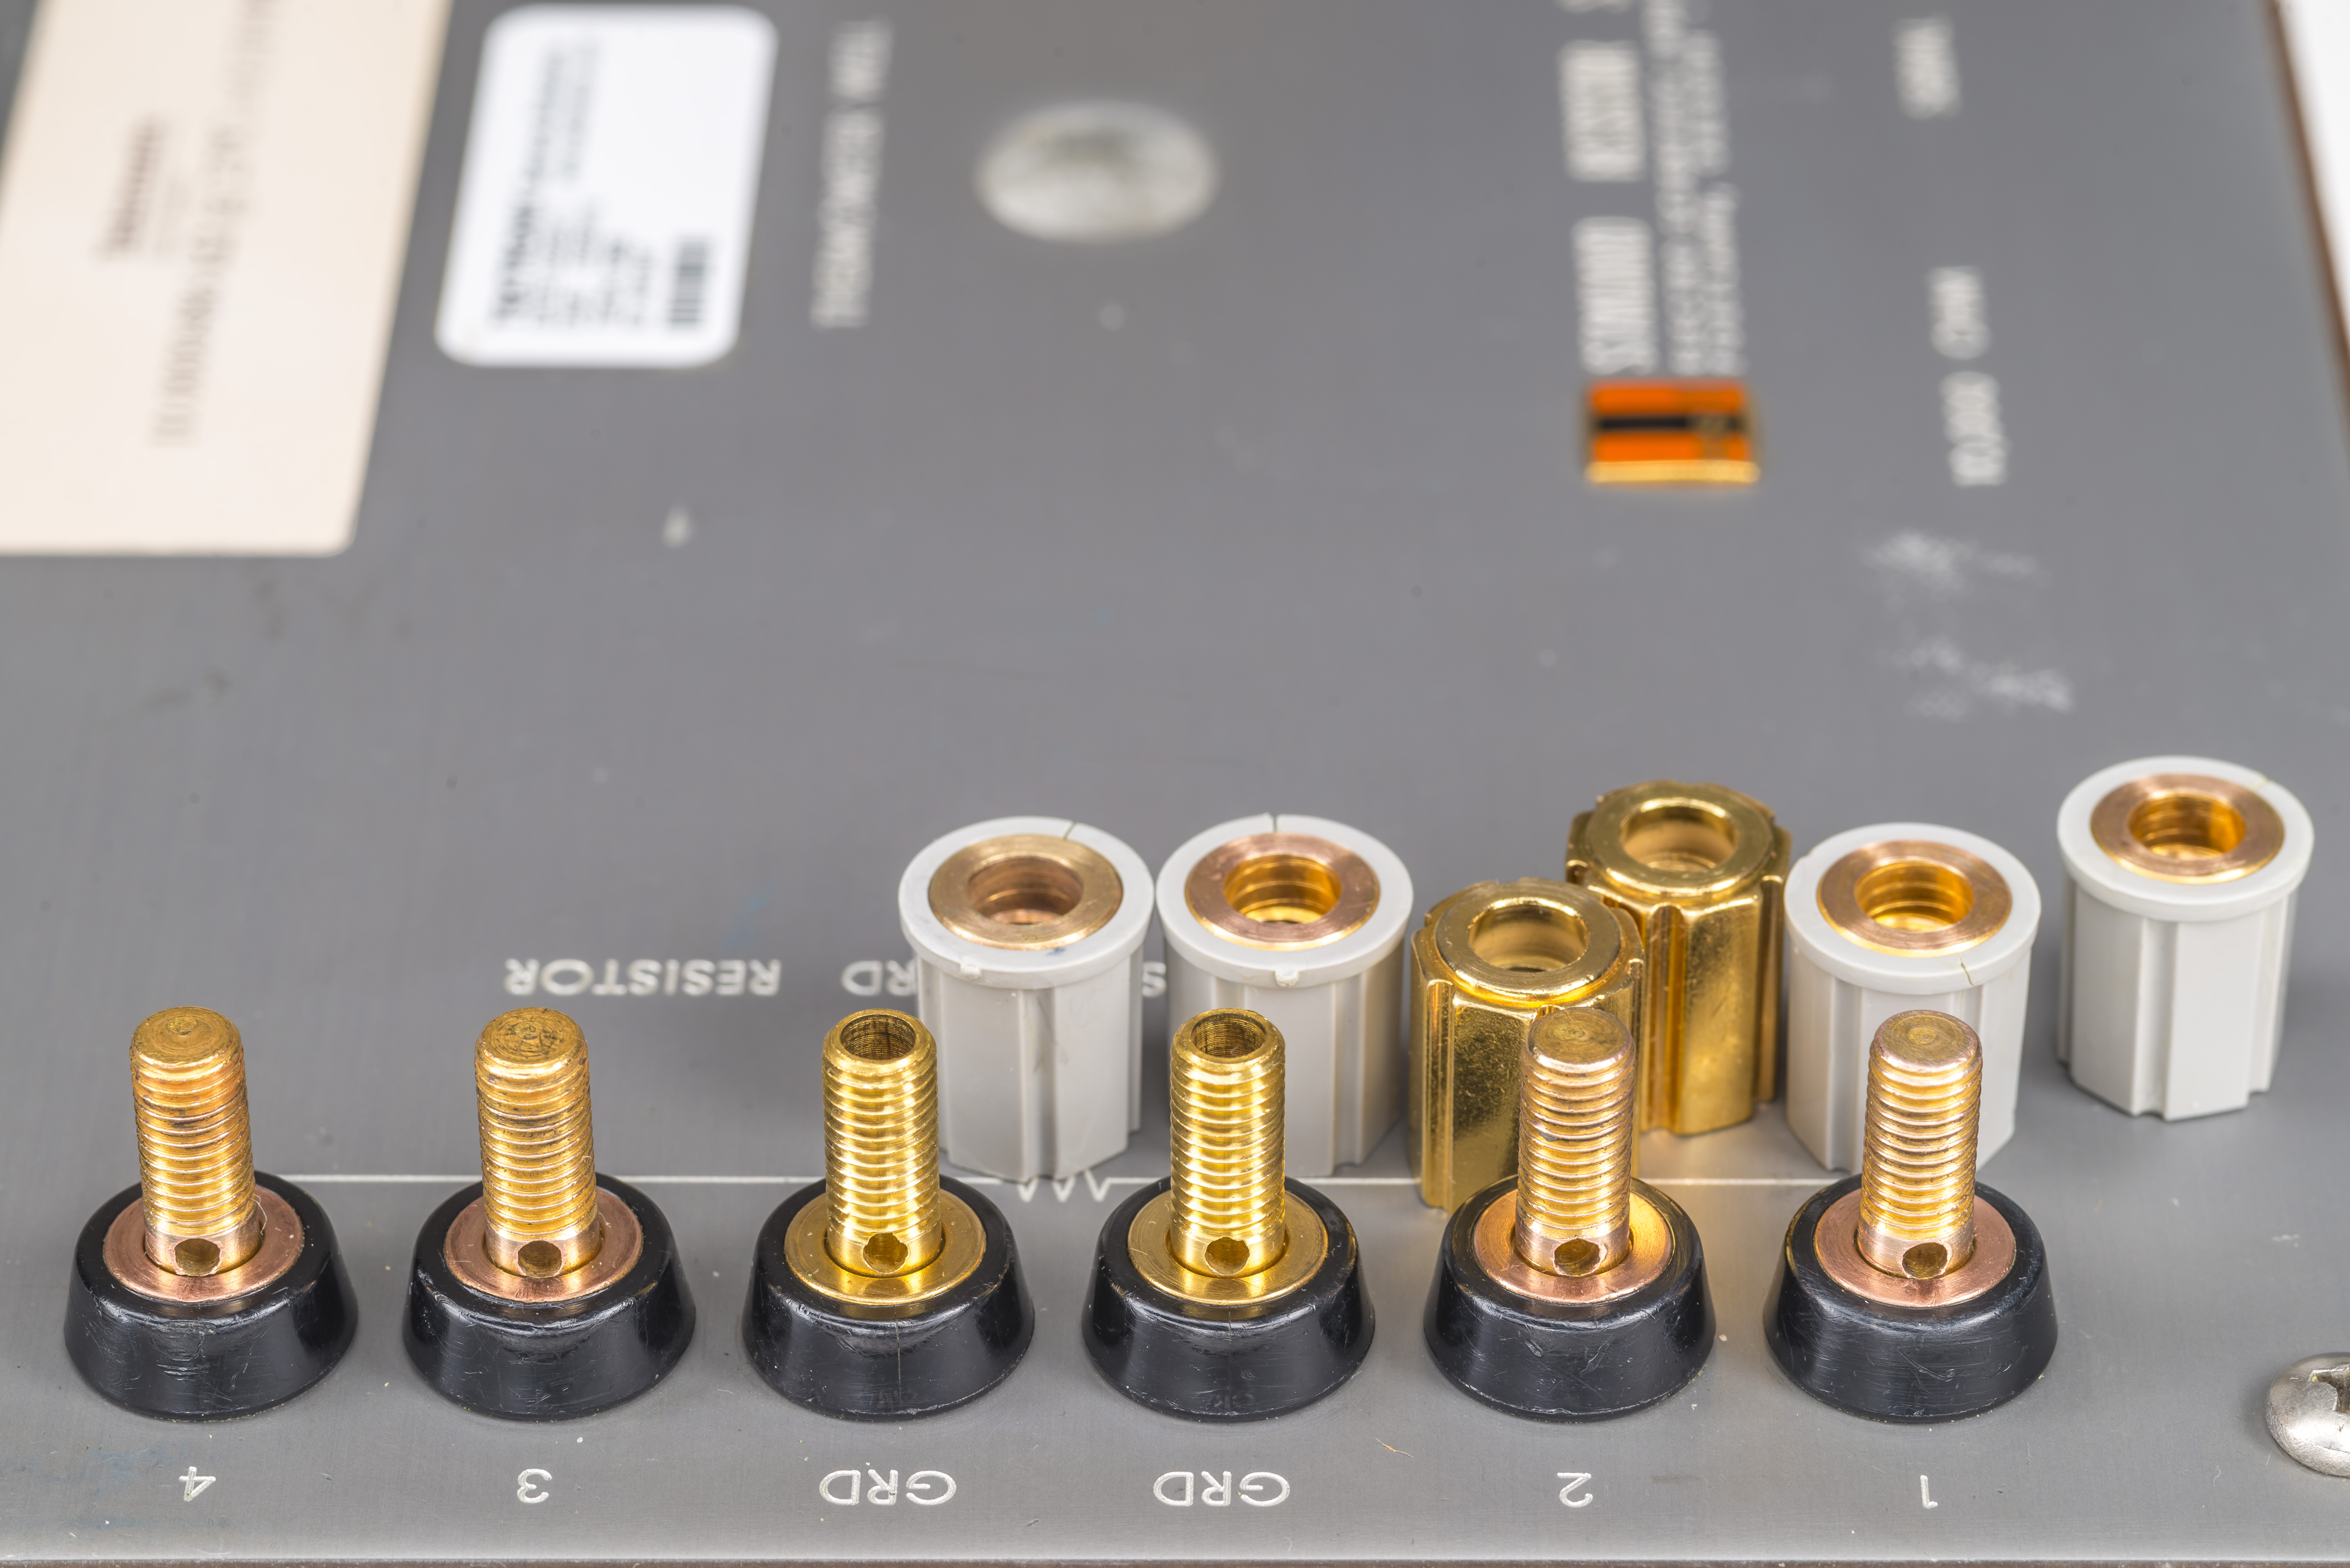
Image 60: Terminals after cleaning
Few plastic overmods on main resistance standard output knobs got millimeter wide cracks, but they didn’t yet go all the way and post is still easy to lock into secure tight connection. Perhaps owner of the standard will fix this with bit of glue later on.
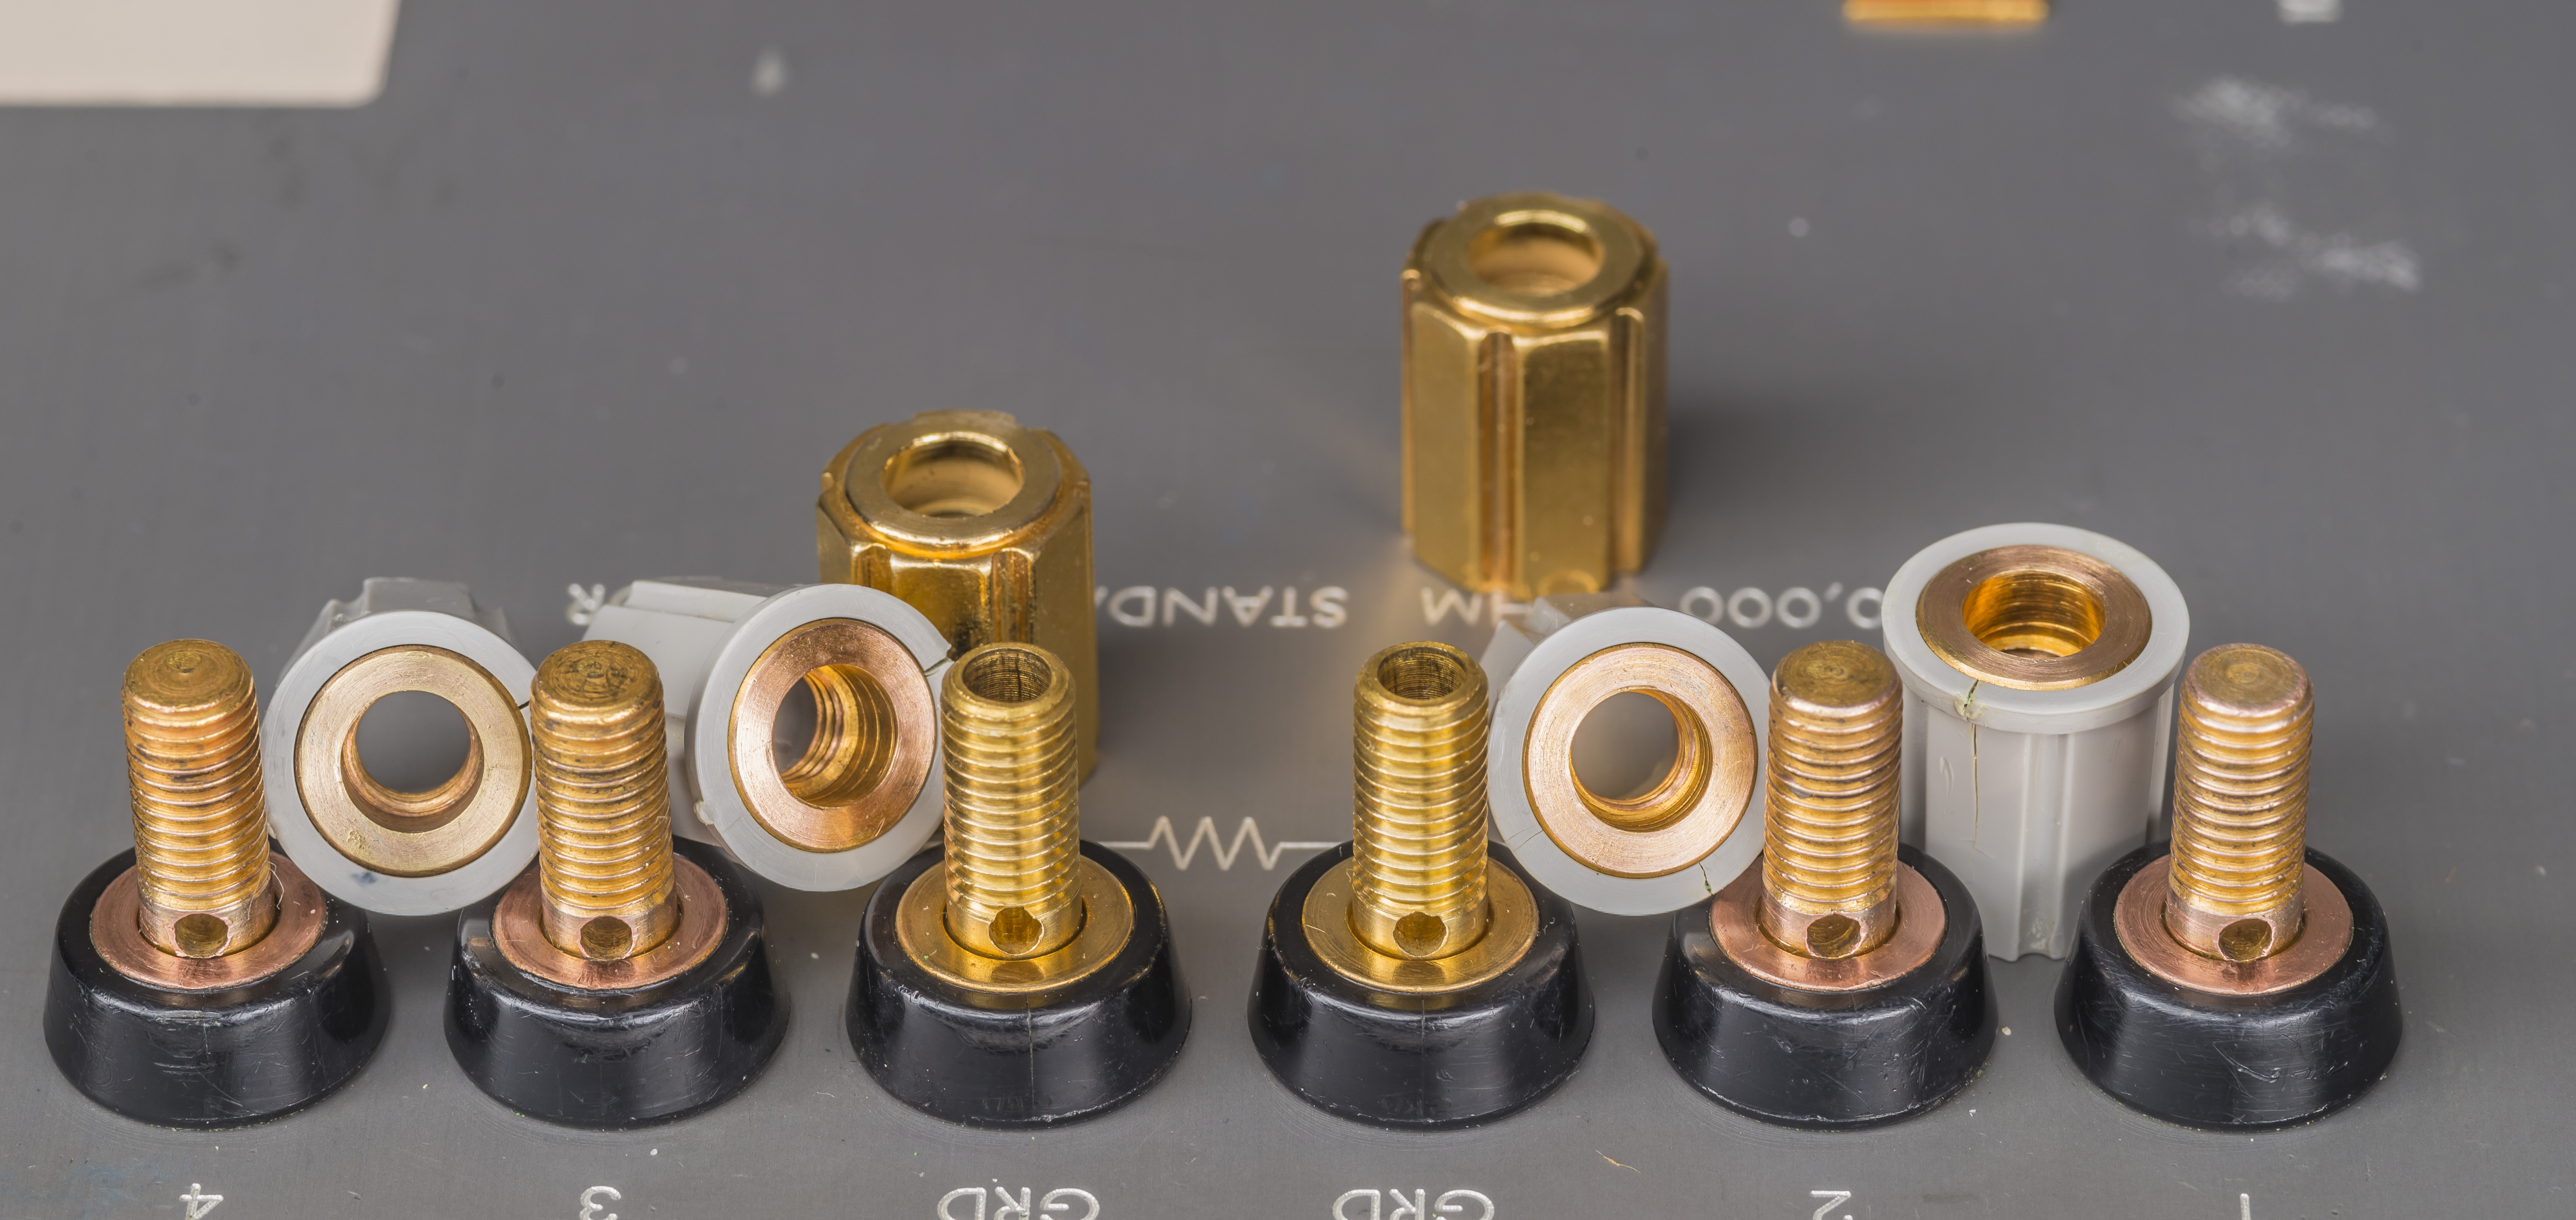
Image 61: Another look on the knobs
Posts cleaned up quite nicely, with metal shining happily once again after 37 years.
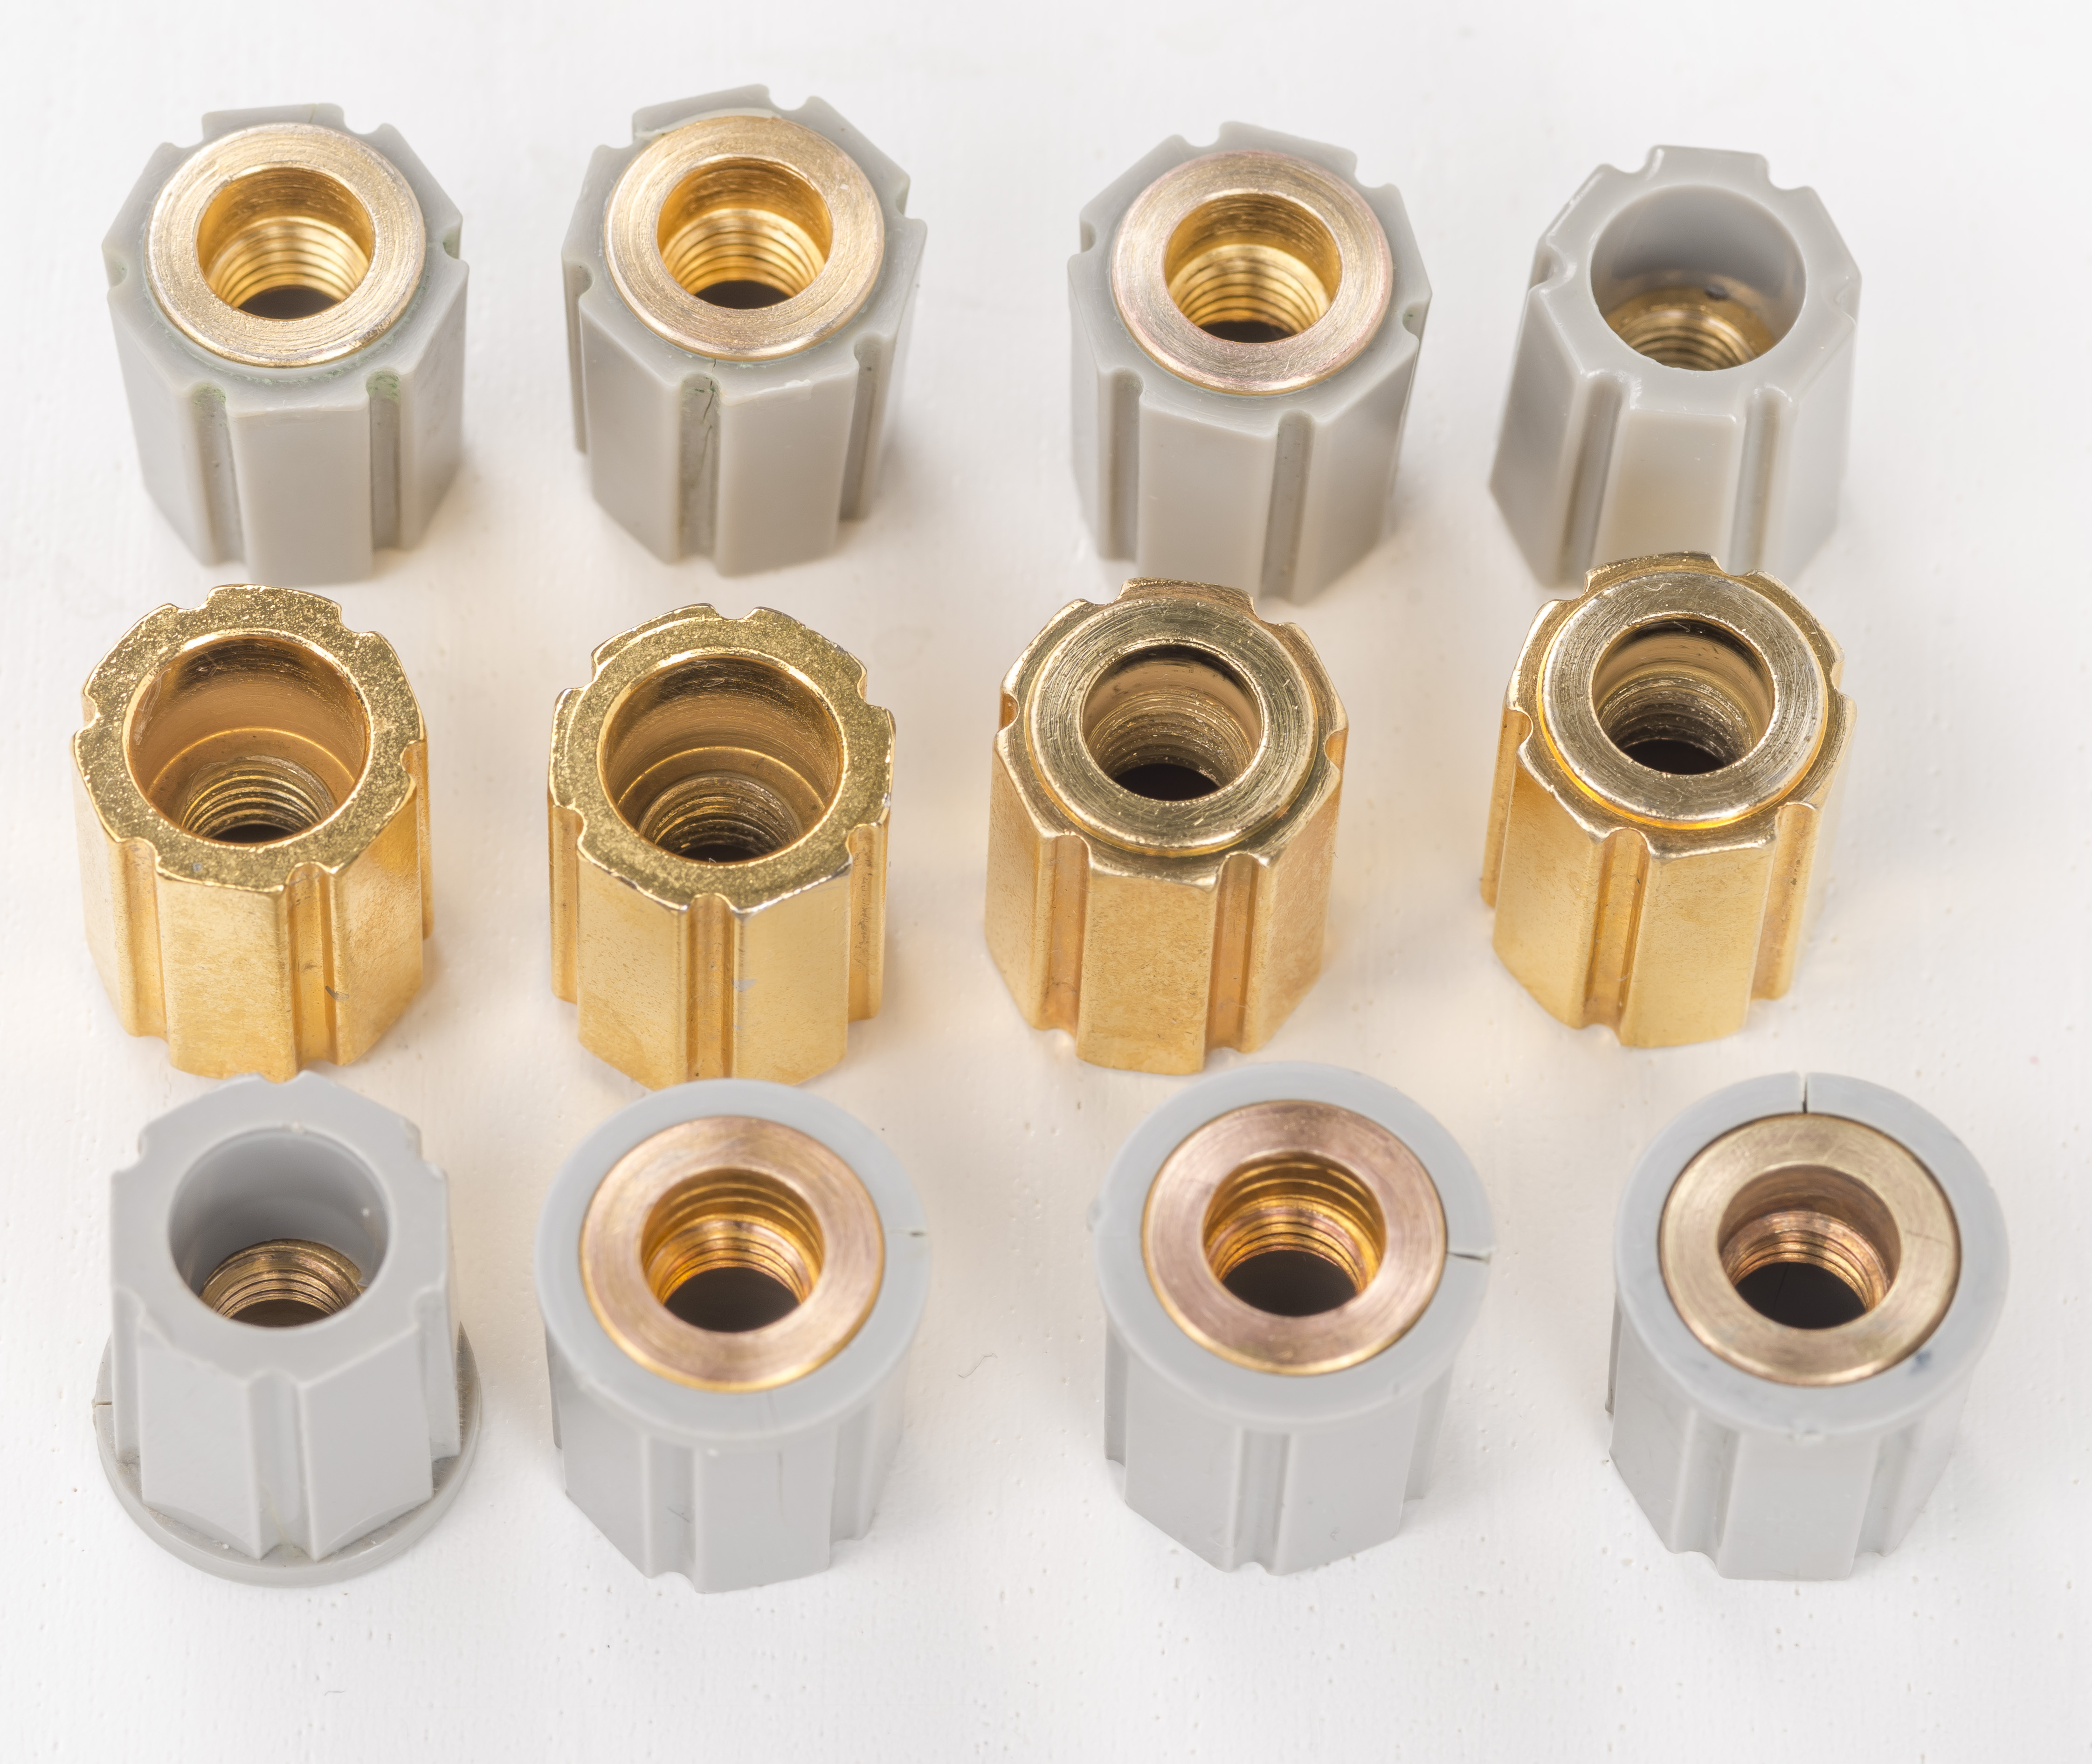
Image 62: Knobs after cleaning
We like unplated copper interconnects here, especially when you can fully remove knobs for cleaning from the turred terminal mount.
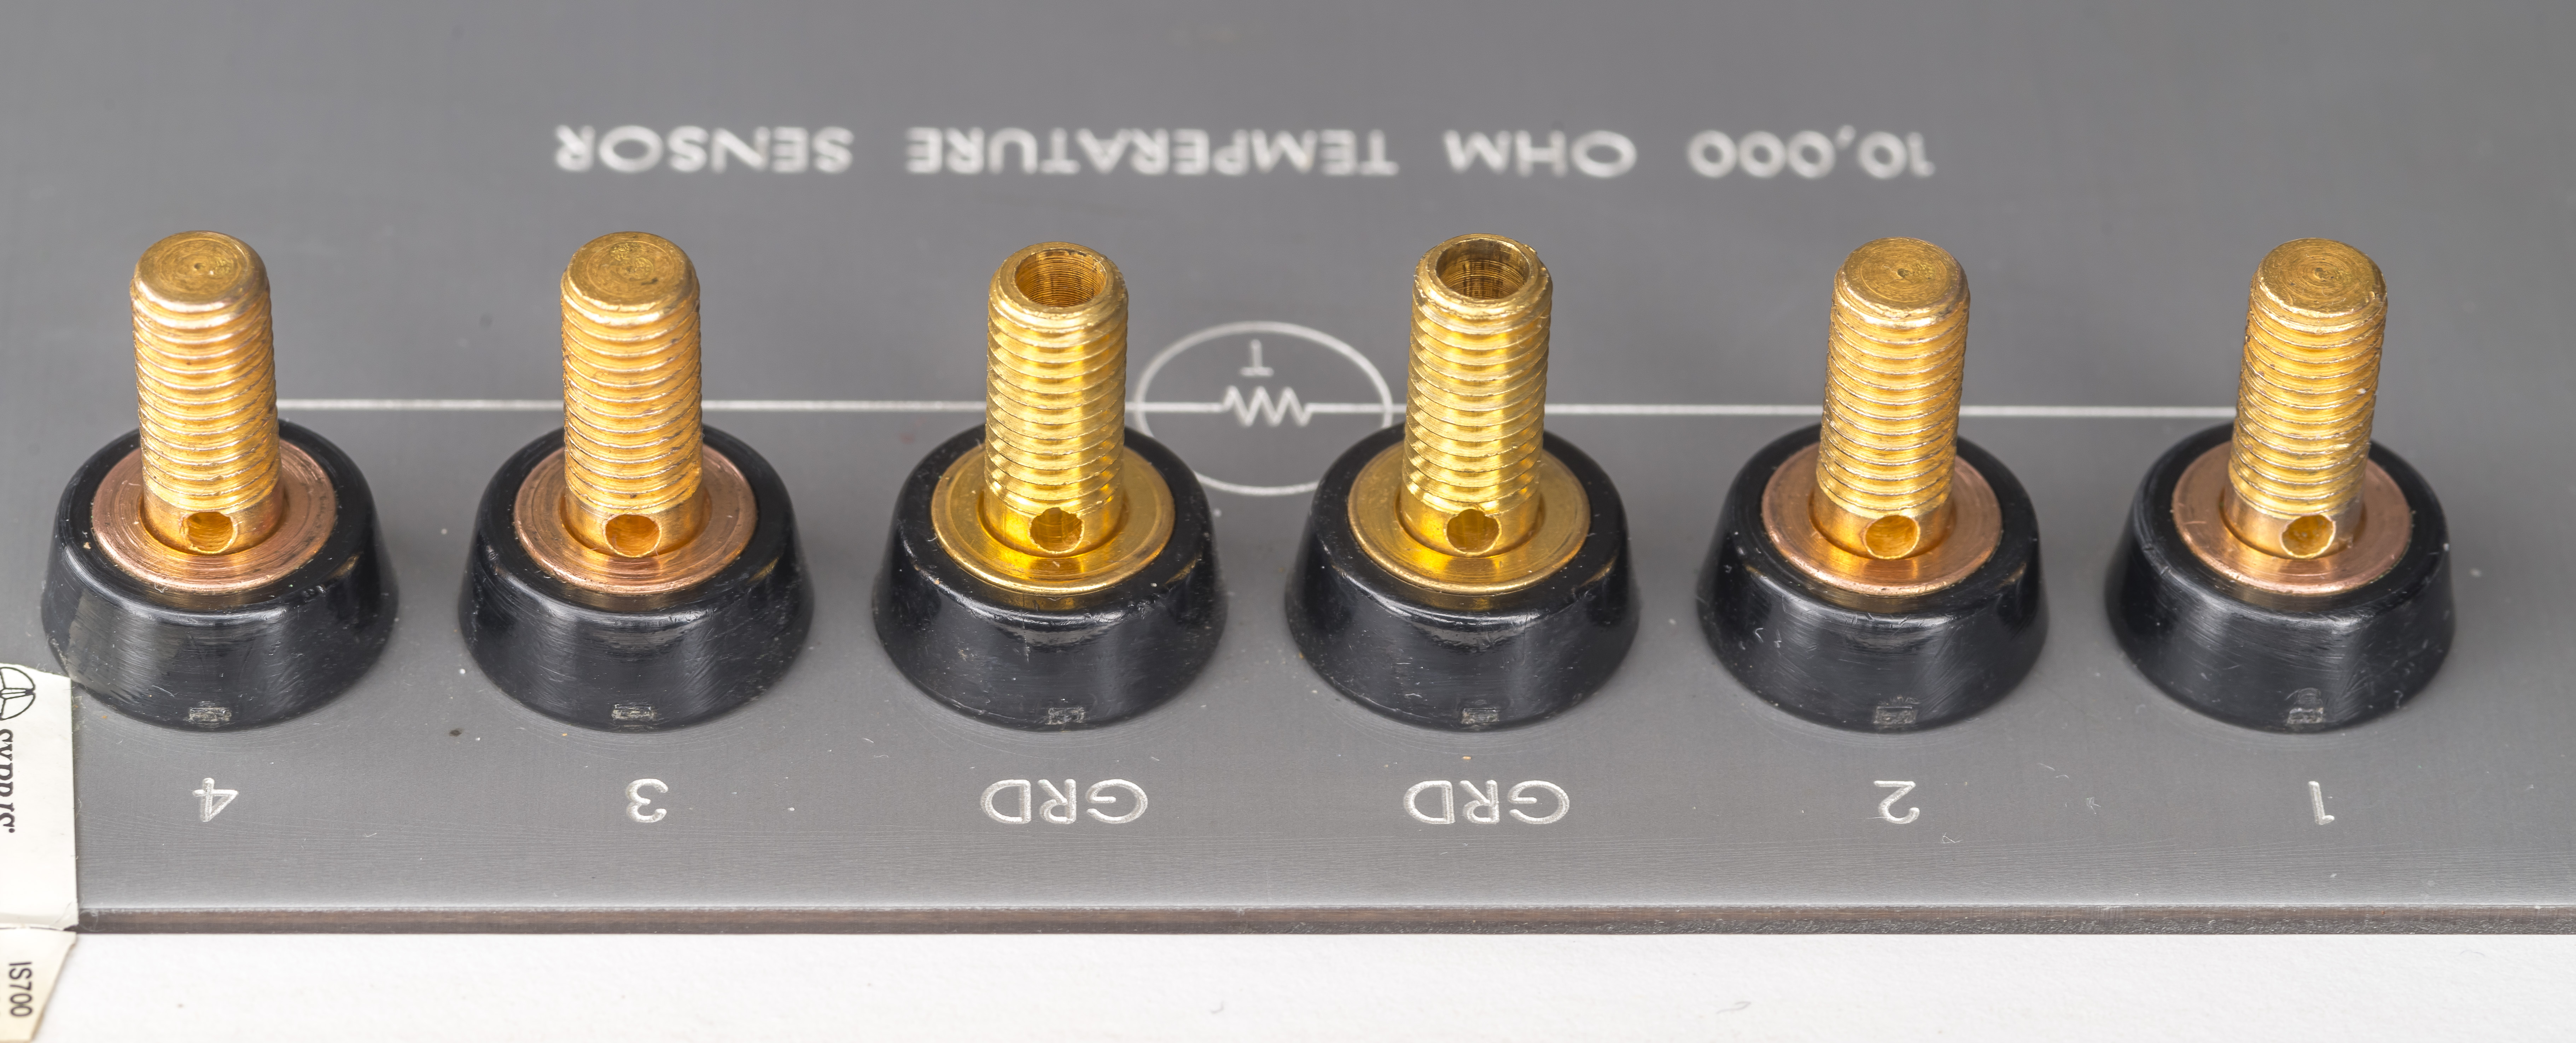
Image 63: Temperature output posts after cleaning
Temperature and main output knobs are different, perhaps they were swapped at some points by previous owners? Guard posts are made of solid metal, since they are not critical for getting faster settling time after connection.
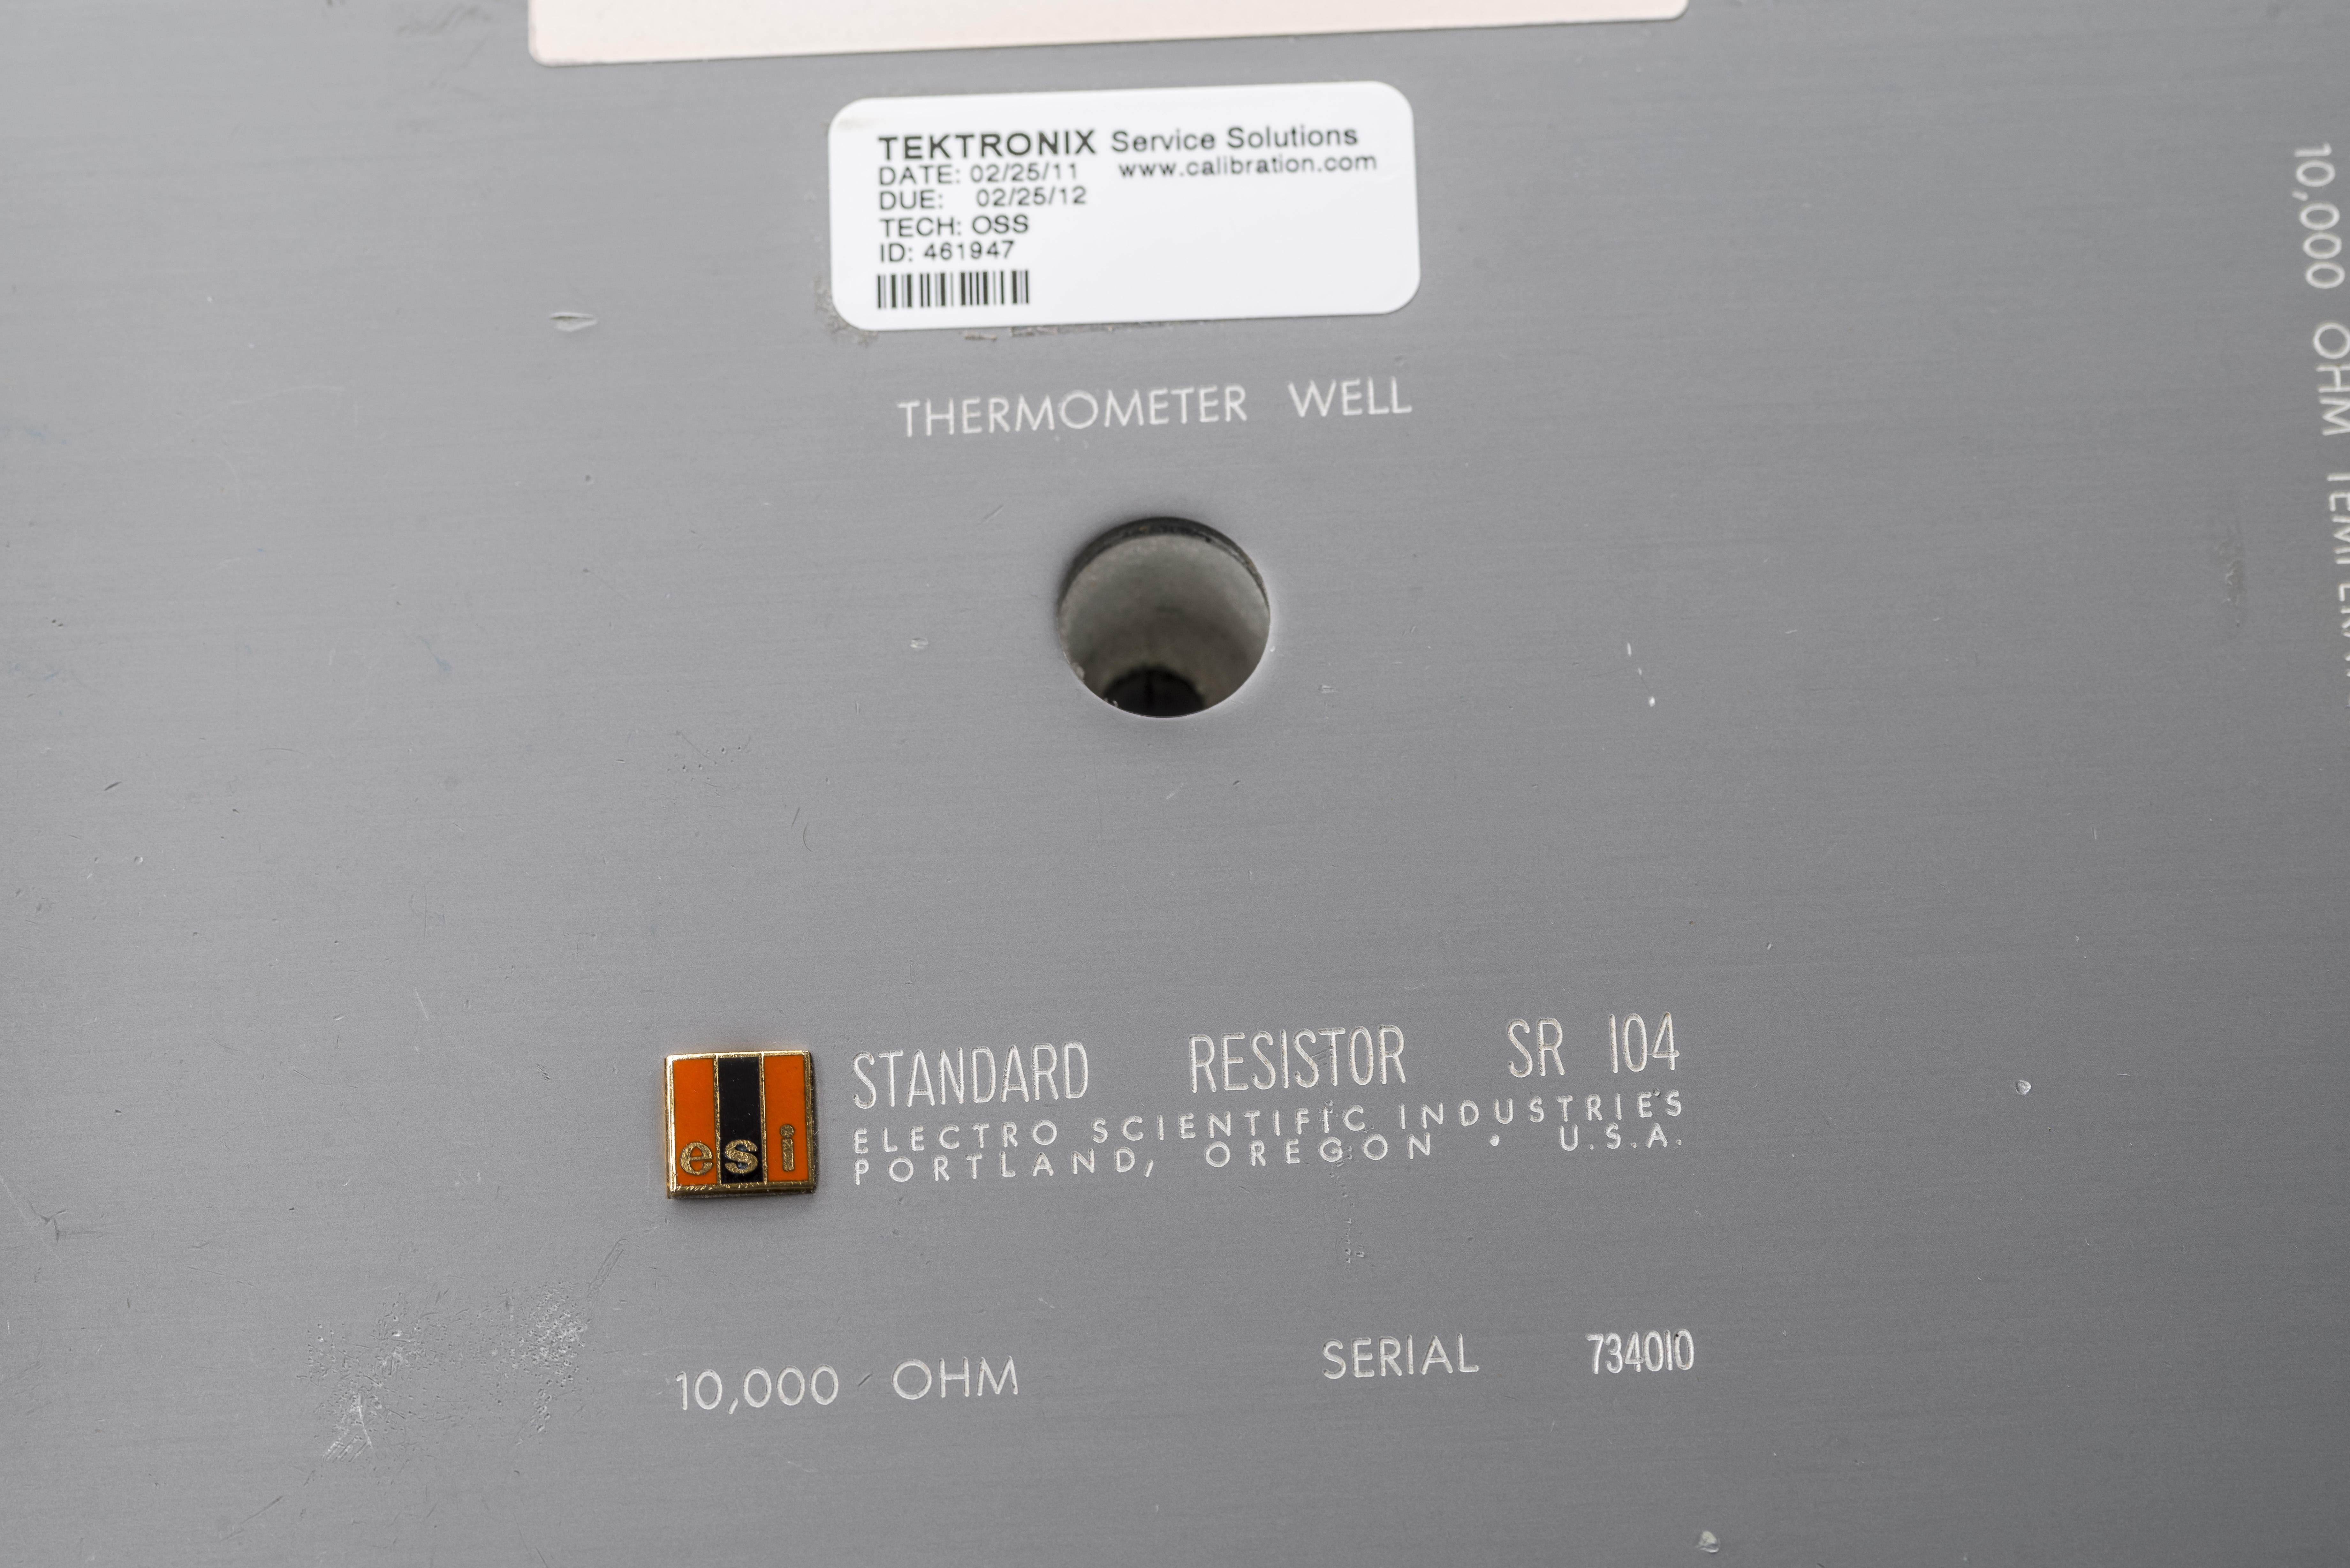
Image 64: Thermal well port for external temperature sensor use
The pretty ESI badge is often easy to fall off on SR104s, but it is safe on this standard.
Measurement results
For TCR measurements unit connected to Measurements International 6010 bridge with PTFE shielded 4-wire cable and low thermal bare copper spade lugs. Temperature sensing resistance output is connected to Keysight 3458A for monitoring internal oil tank temperature.
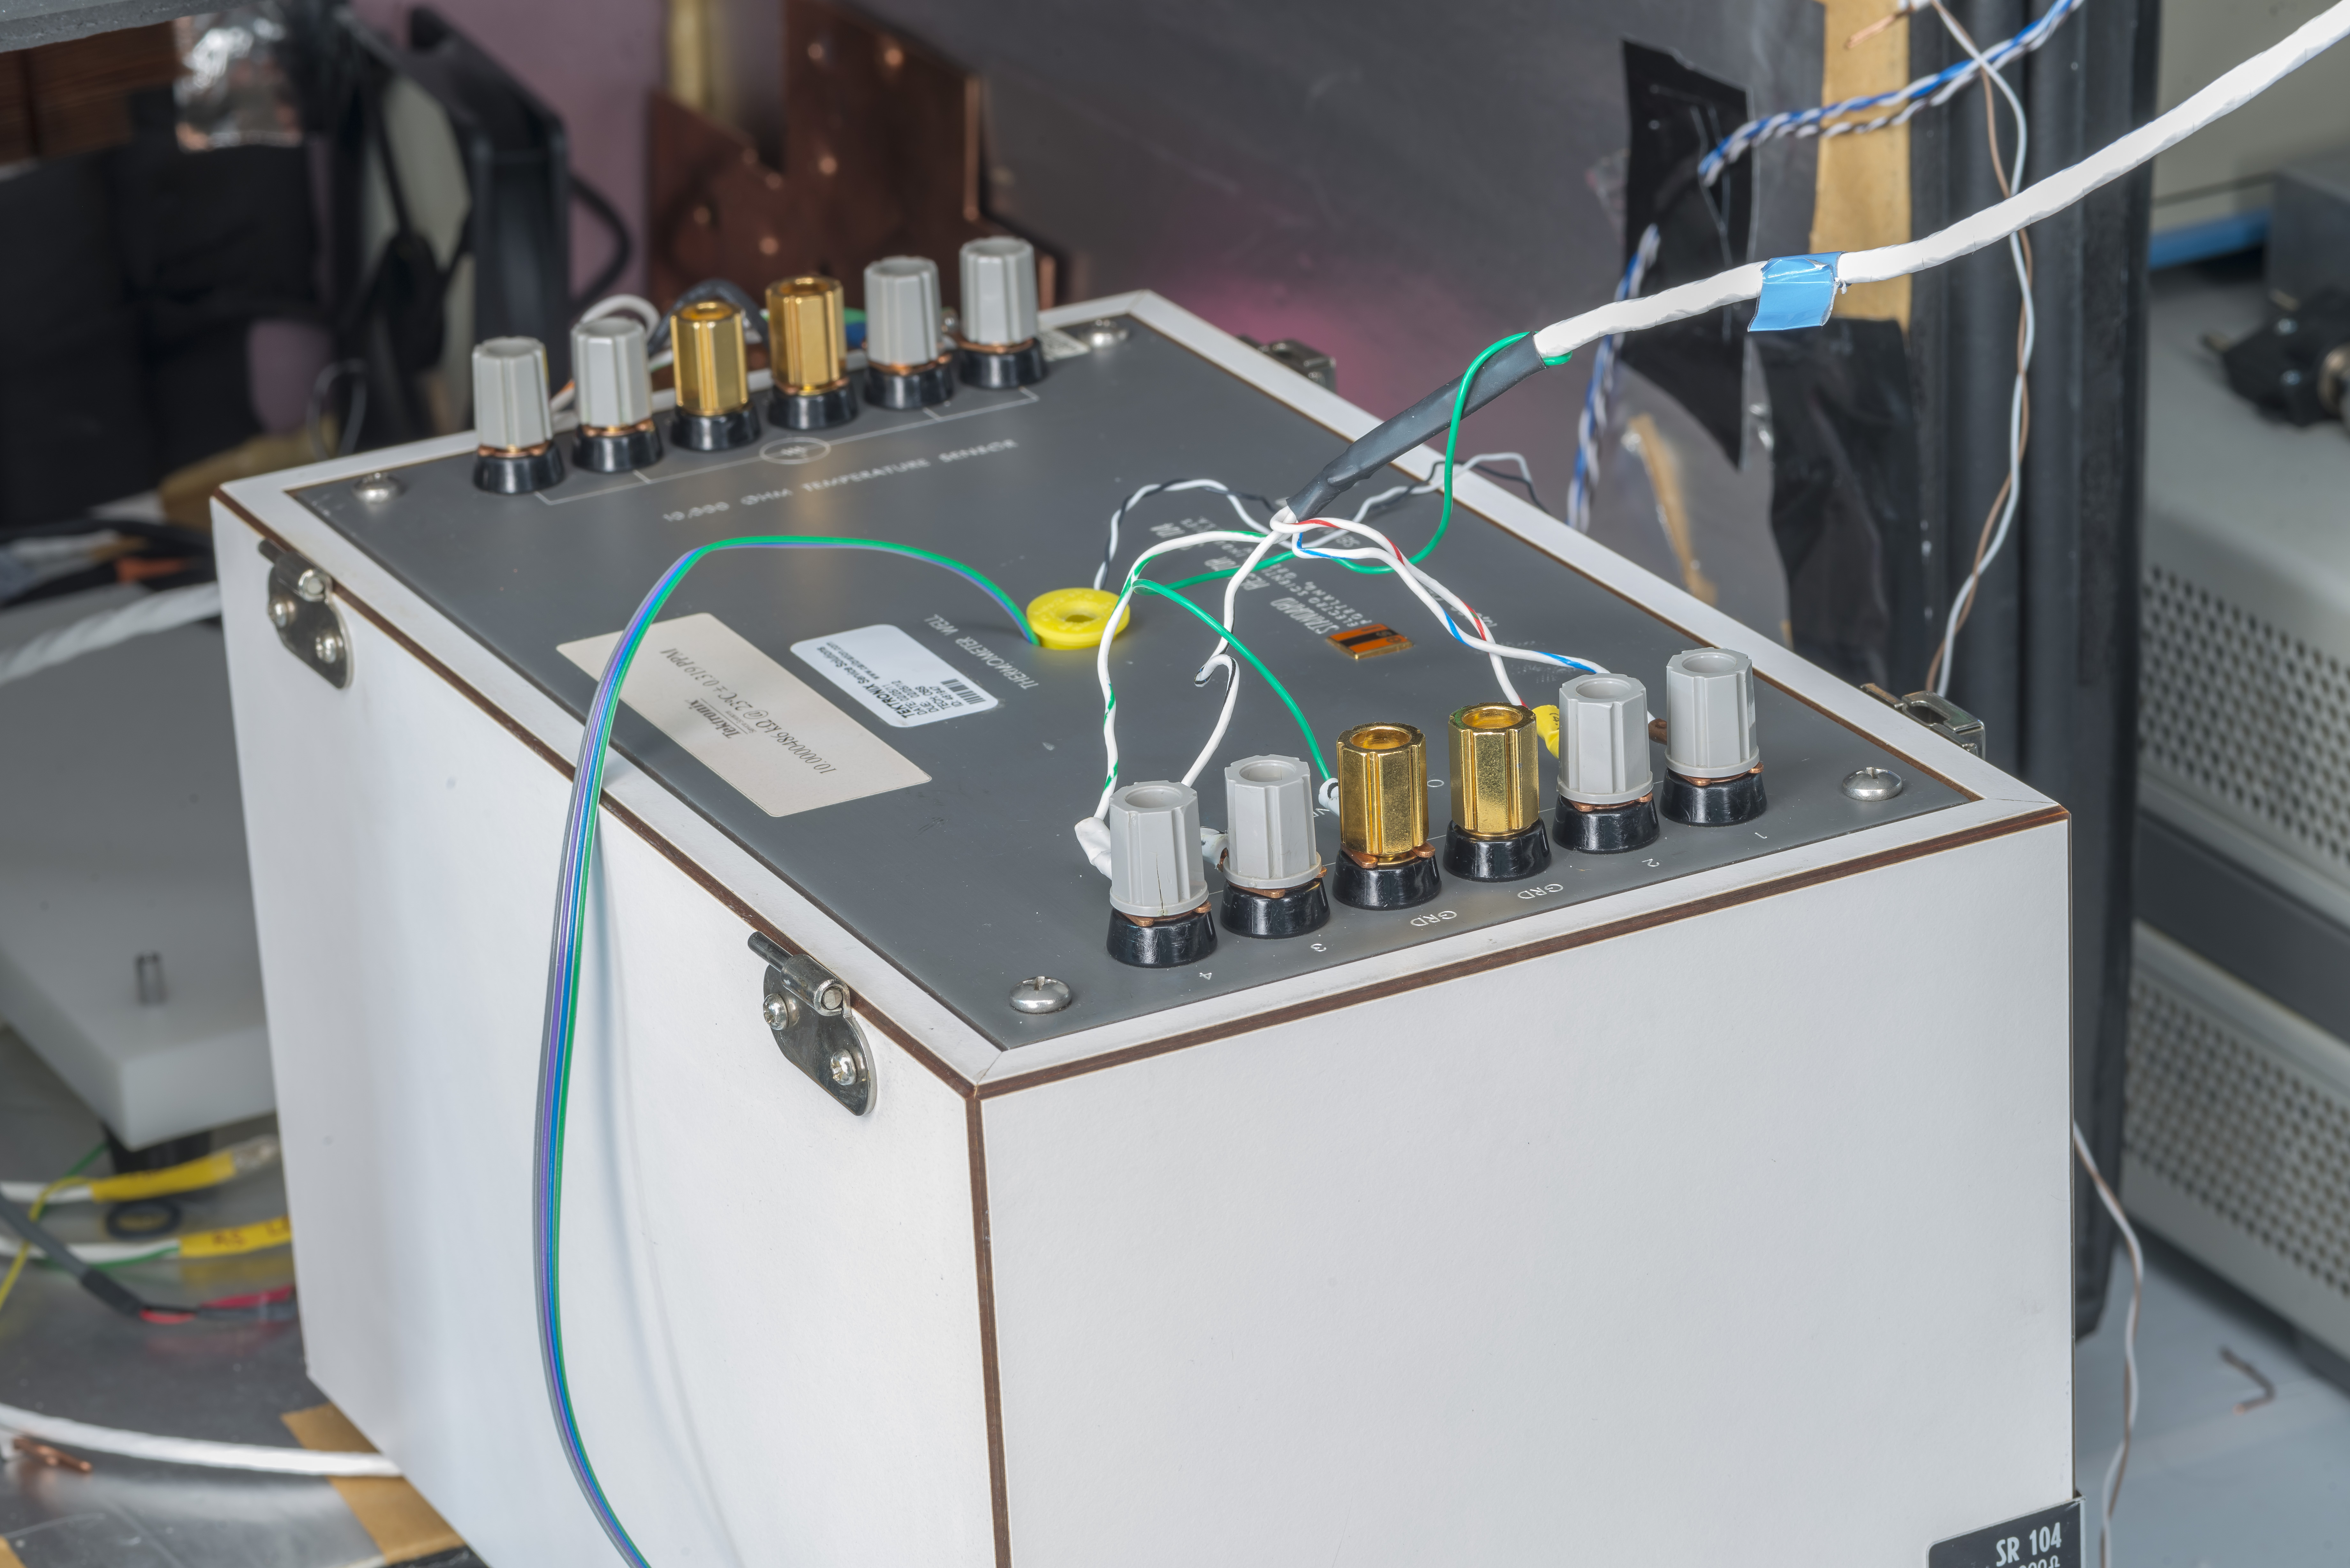
Image 65: Connections for measurement
Whole box was placed into DIY programmable air-bath for initial checks and TCR sweep. I’ve detached the lid to reduce a settling time constant of the SR104 a little bit.
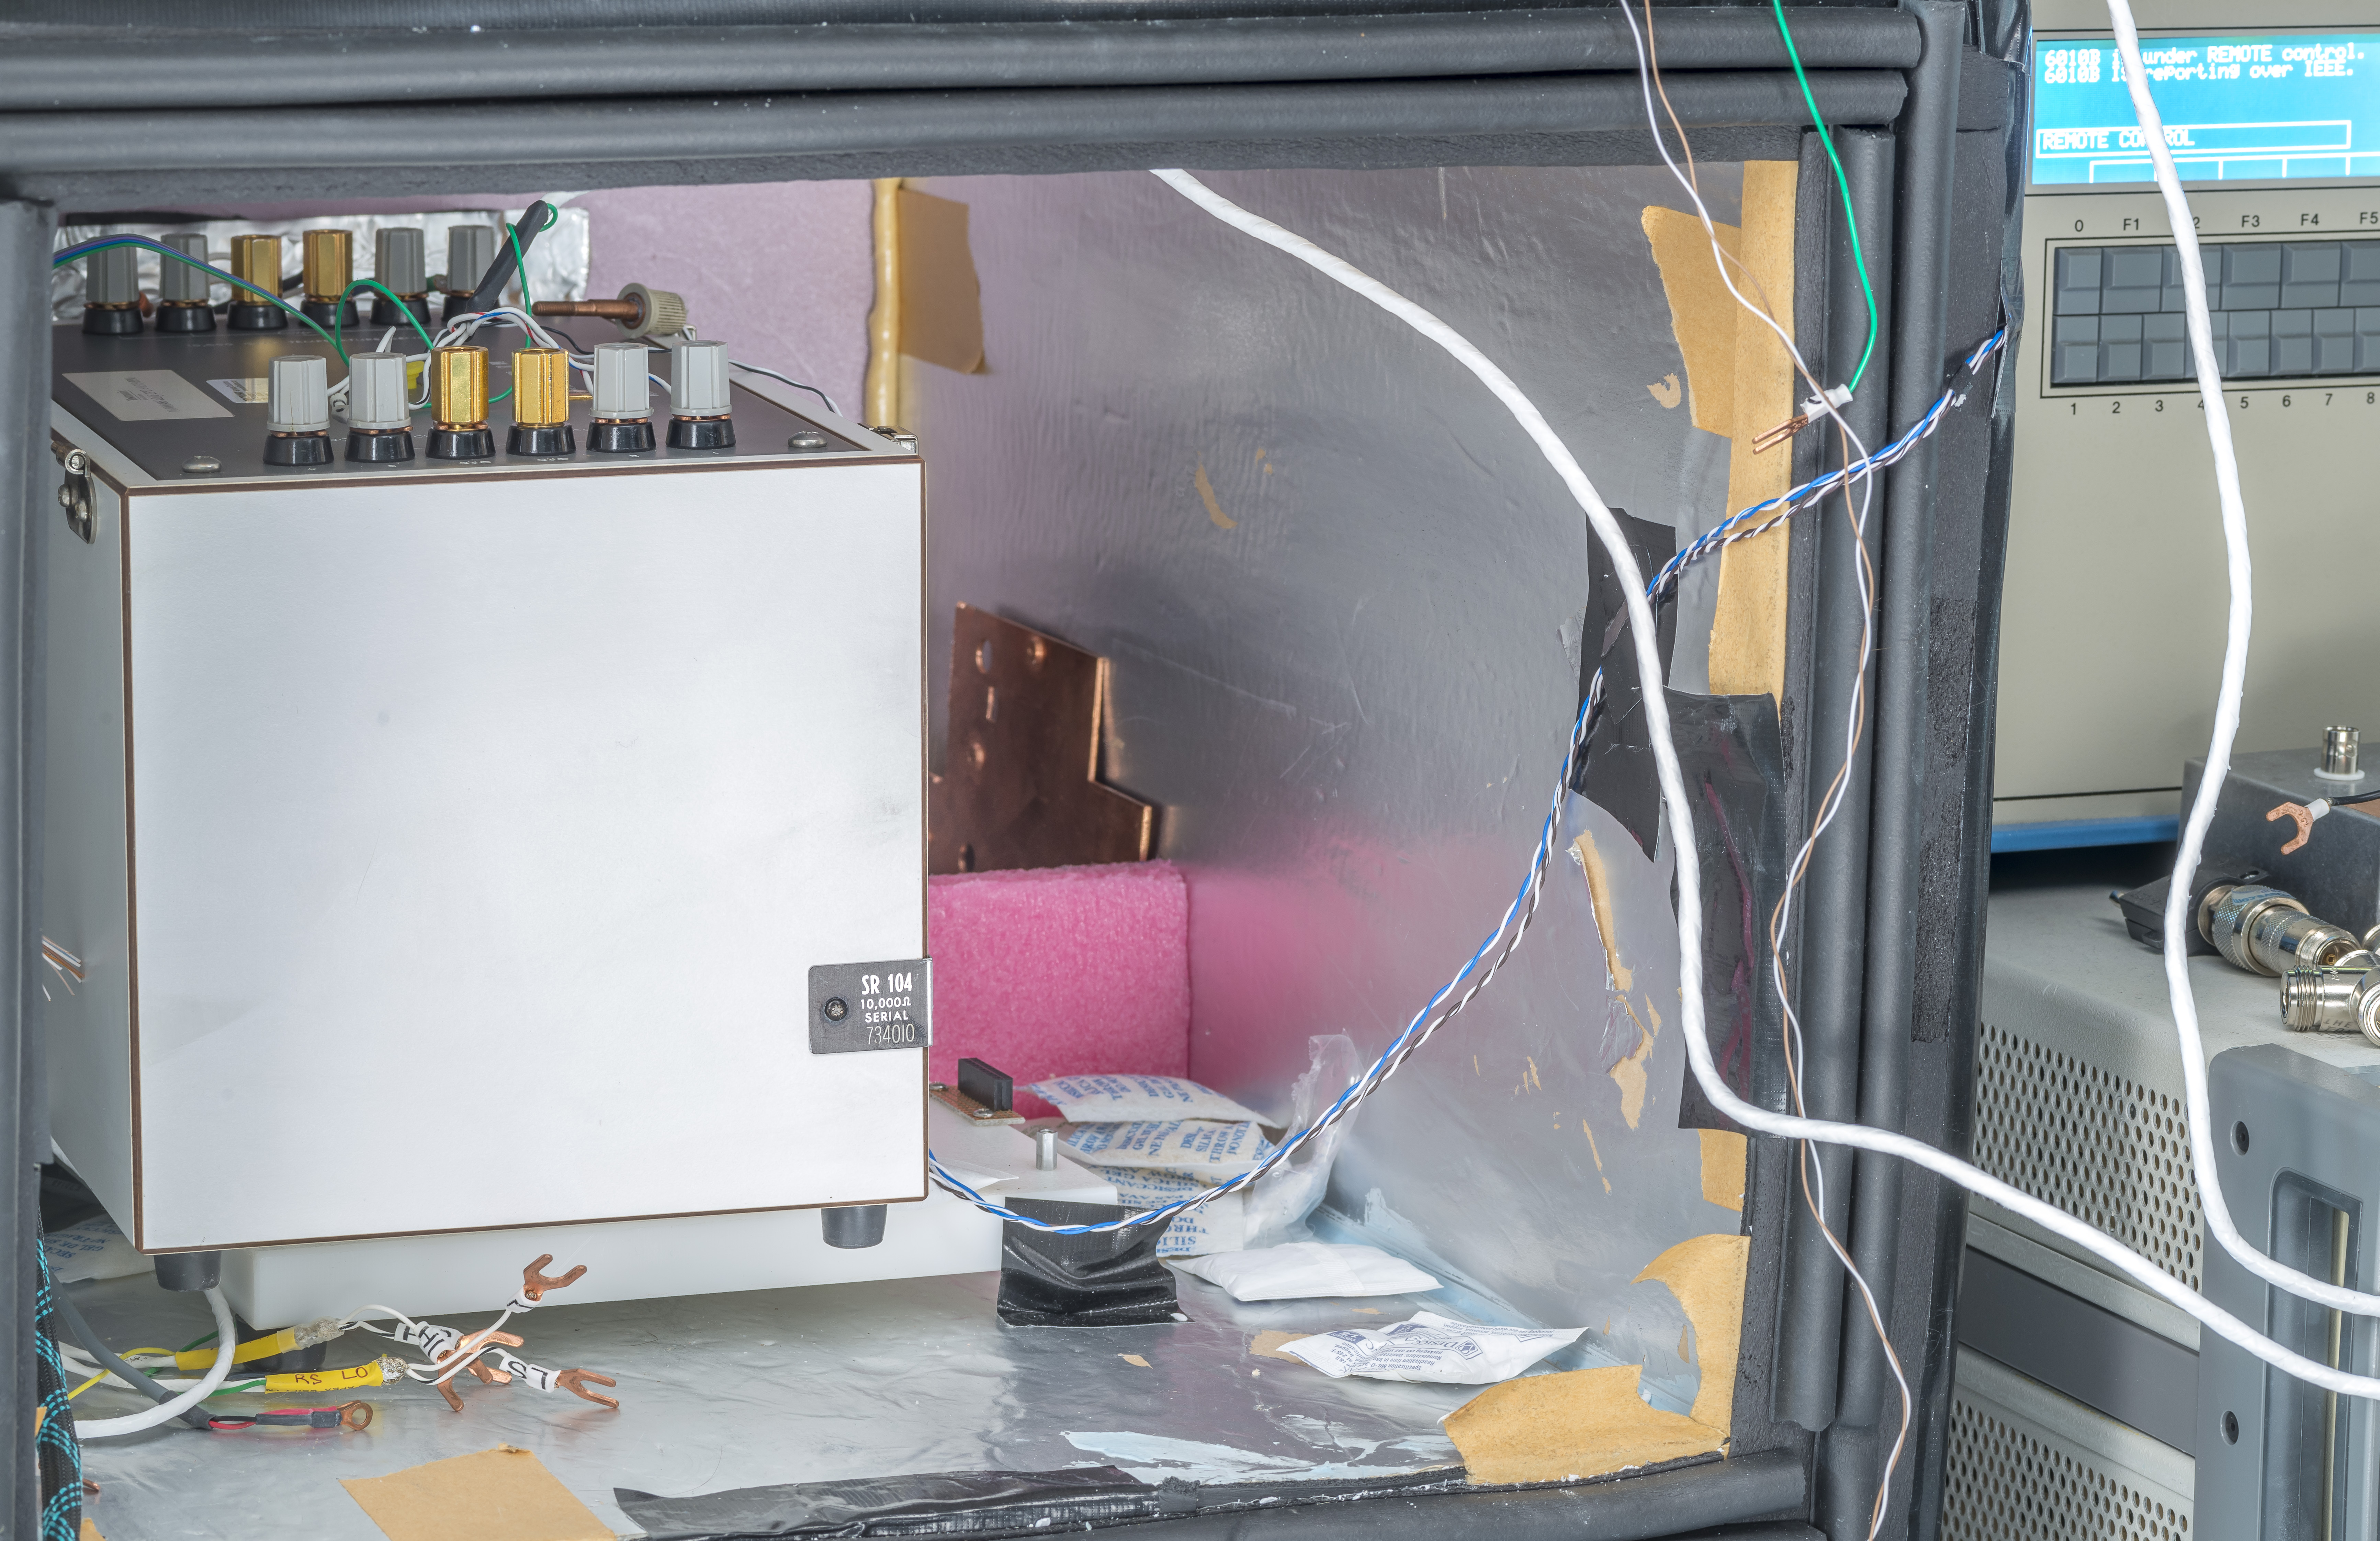
Image 66: SR104 located in the xDevs.com’s mini-TEC chamber
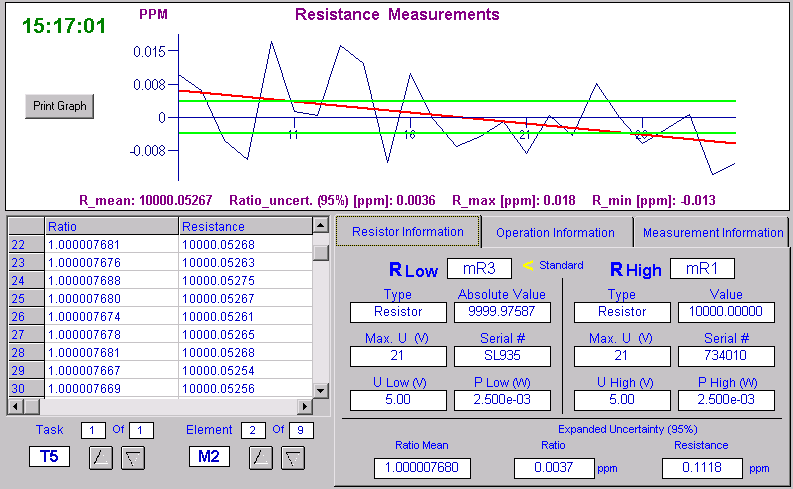
This resistor was calibrated first against in-house reference standard ESI SR104 on 8.MAR.2024, with preliminary value 10000.05276 Ω with expanded uncertainty ±0.2 µΩ/Ω.
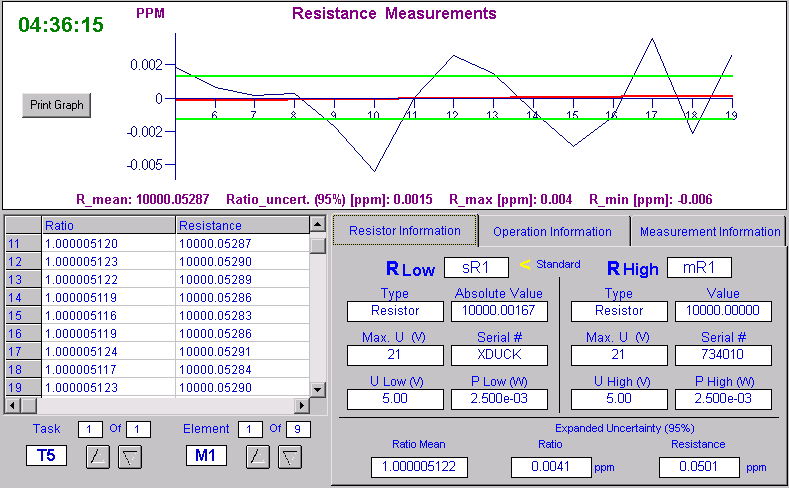
Image 67: Initial measurements between two SR104 done with MI 6000A BVD system
Measurement was performed at 500 µA current using MIL 6000A resistance bridge with 25 seconds settling time per 25 readings and with Fluke 5720A/H1 as 10 V DC source. Detector in this measurement was 8½-digit Keysight 3458A voltmeter. As typical with BVD bridge system overall spread is less than ±5 nΩ/Ω.
All comparison measurements and a relationship between different standards presented on Image 69. Measured ratio is shown in bubble boxes as A value next to related arrow line. Calibrated own xDevs.com SR104 was used as primary reference source with Fluke SL935 for additional checks as secondary standard.
![]()
Image 69: Transfer measurements and traceability tree diagram
Final calibrated value is determined as average of all readings from calibrated SR104 transfer using BVD bridge setup in a period from March 5, 2024 till May 12, 2024. Final value determined to be 10000.05205 Ω with expanded uncertainty ±0.2 µΩ/Ω at temperature +23.0 °C ±0.2 °C. These values are validated for test currents 0.316 and 0.5 mA.
Temperature coefficient of this standard was also measured with very slow temperature profiling over 287 hours test. The temperature change speed must be very slow to account for the 6-8 hour settling delay for the massive oil tank mass and insulation properties of the standard unit inside SR104 enclosure. Temperature ramp set points were calculated and programmed from software algorithm implemented in xDevs.com TECKit Python app. Temperature range for the measurement was set between +18 °C and +28 °C and ramp slope was ±0.0016 K/minute. There was power outage in the lab due to strong winds and utilities damage on March 11 which resulted in measurement aborted and restart after an unplanned 7-hour delay.
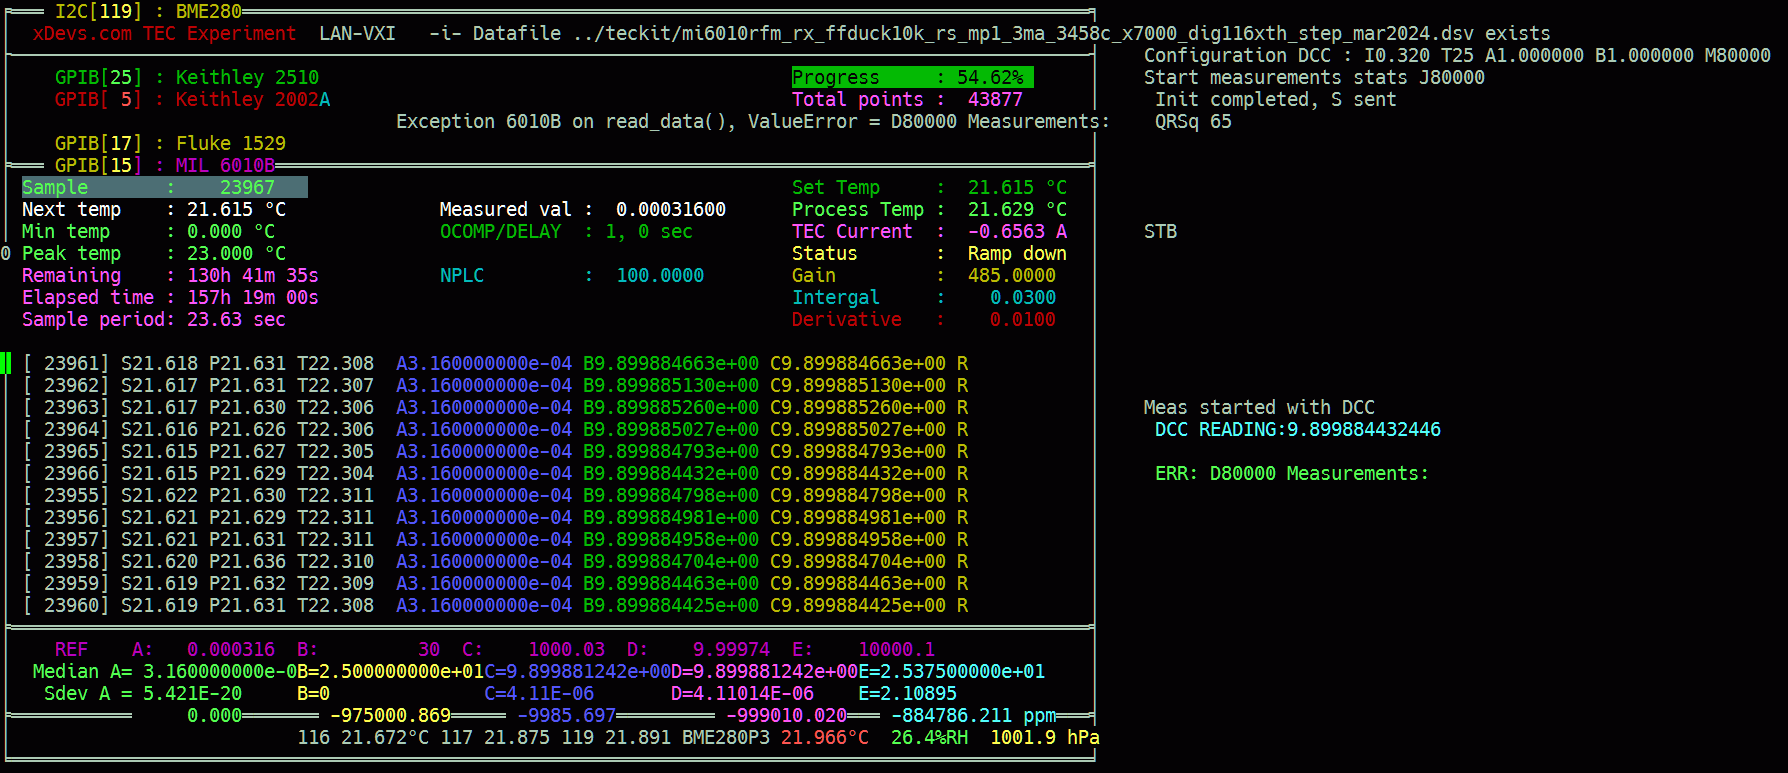
Image 70: xDevs.com TECKit software UI run during TCR sweep
DUT SR104 S/N 734010 internal temperature was measured with calibrated Fluke 1529 Chub-E4 thermometer readout and Honeywell HEL-705 1000 Ω PRT. PRT sensor was inserted in DUT SR104 thermometer well. Additionally, digital temperature sensor flex PCB was inserted in the well as well to check agreement and evaluate new Texas Instruments TMP119 sensor performance for the future xDevs experiments as well.
From this run we can now determine new coefficients α = -0.052 µΩ/Ω/K and β = -0.026 µΩ/Ω/K2 and zero TC temperature at +22.0 °C. These values are bit different to original factory certificate on the lid, perhaps due to some past history stress?. Based on these results ±0.2 µΩ/Ω uncertainty can be provided by this SR104 standard when temperature is inside +21.0 °C to +20.0 °C window, as clearly visible in Table 5.
| SR104 734010 well | Resistance output | Relative to 10 kΩ |
|---|---|---|
| 17.00 °C | 10000.04646 Ω | 4.646 µΩ/Ω |
| 17.50 °C | 10000.04769 Ω | 4.769 µΩ/Ω |
| 18.00 °C | 10000.04880 Ω | 4.880 µΩ/Ω |
| 18.50 °C | 10000.04977 Ω | 4.977 µΩ/Ω |
| 19.00 °C | 10000.05062 Ω | 5.062 µΩ/Ω |
| 19.50 °C | 10000.05134 Ω | 5.133 µΩ/Ω |
| 20.00 °C | 10000.05192 Ω | 5.192 µΩ/Ω |
| 20.50 °C | 10000.05237 Ω | 5.237 µΩ/Ω |
| 21.00 °C | 10000.05270 Ω | 5.270 µΩ/Ω |
| 21.50 °C | 10000.05290 Ω | 5.289 µΩ/Ω |
| 22.00 °C | 10000.05296 Ω | 5.296 µΩ/Ω |
| 22.50 °C | 10000.05290 Ω | 5.289 µΩ/Ω |
| 23.00 °C | 10000.05270 Ω | 5.270 µΩ/Ω |
| 23.50 °C | 10000.05237 Ω | 5.237 µΩ/Ω |
| 24.00 °C | 10000.05192 Ω | 5.192 µΩ/Ω |
| 24.50 °C | 10000.05134 Ω | 5.133 µΩ/Ω |
| 25.00 °C | 10000.05062 Ω | 5.062 µΩ/Ω |
| 25.50 °C | 10000.04977 Ω | 4.977 µΩ/Ω |
| 26.00 °C | 10000.04880 Ω | 4.880 µΩ/Ω |
| 26.50 °C | 10000.04769 Ω | 4.769 µΩ/Ω |
| 27.00 °C | 10000.04646 Ω | 4.646 µΩ/Ω |
| 27.50 °C | 10000.04509 Ω | 4.509 µΩ/Ω |
| 28.00 °C | 10000.04360 Ω | 4.360 µΩ/Ω |
Table 4. SR104 S/N 734010 TCR values
SR104 Temperature output correlate to well temperature sensors with linear trend coefficient 995.4585 µΩ/Ω/K. One can even calculate 2nd-order coefficients for temperature output from polyfit values (4.08430887E-4×2 + 9.93562188x + 9771.34852) equal αTEMP = 995.43 µΩ/Ω/K and βTEMP = +0.041 µΩ/Ω/K2, resulting at 10000.0839 Ω reference point for +23.00 °C well temperature.
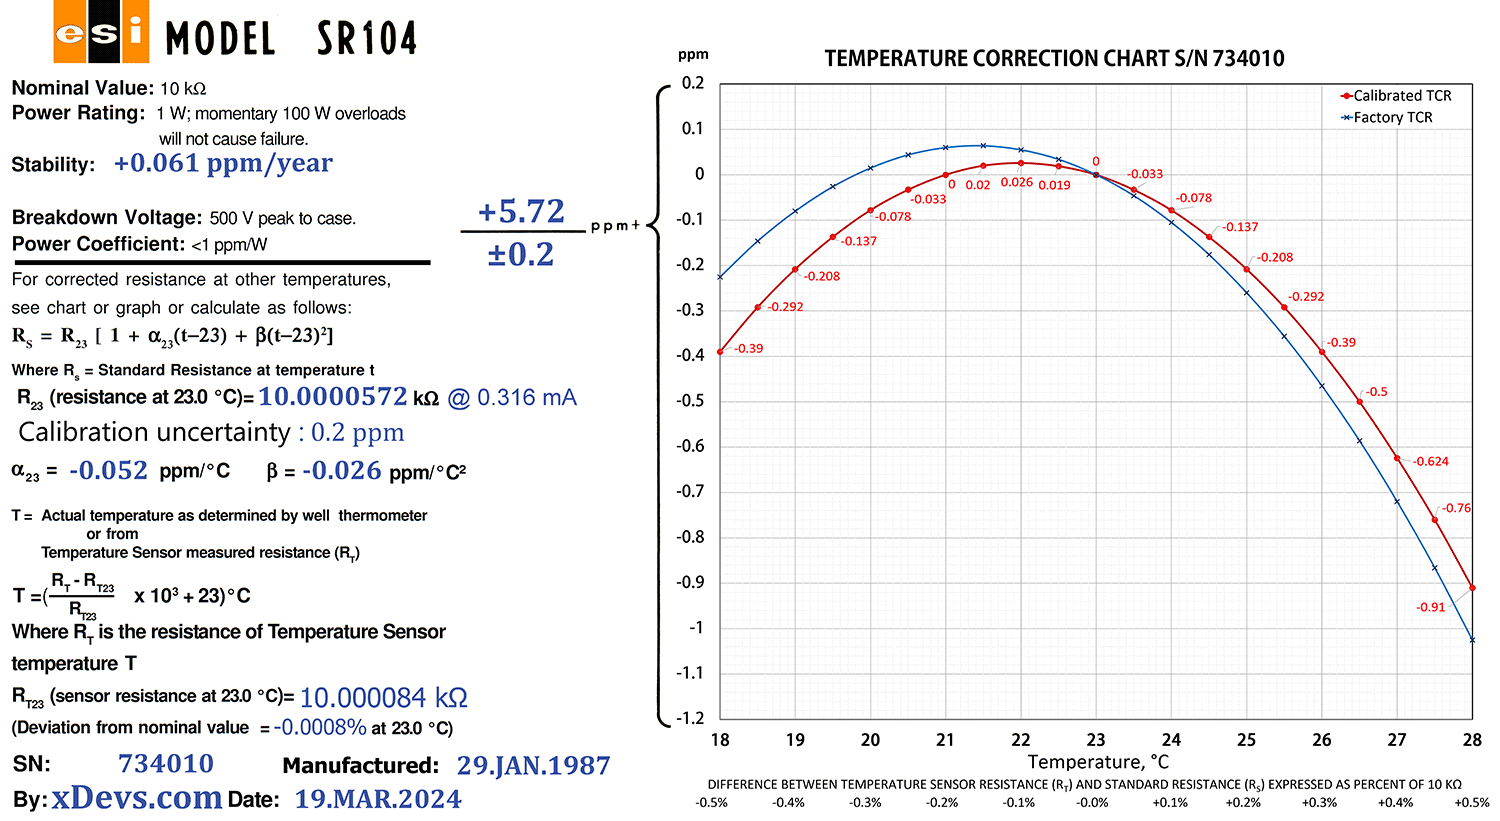
Image 71: New label with current calibration results
Based on these measurement experiments and calculated values we can print nice fresh label as well and include it with the original one. RAW-file with measured data points is available as well in CSV and Excel format for more detailed analysis. Additional SVG live chart used during measurement is also here.
| Model and serial | Calibration date | Assigned value | Uncertainty | Calculated drift | Notes | Age |
|---|---|---|---|---|---|---|
| SR104 734010 | 29.JAN.1987, factory | 10000.0301 Ω (corrected to SI1990) | ± 1.0 µΩ/Ω | Ref | Original factory label | Ref |
| SR104 734010 | 25.FEB.2011 by Tektronix | 10000.0486 Ω | ± 0.319 µΩ/Ω | +1.85 µΩ/Ω, +0.077 µΩ/Ω/a | Unknown | 8793 days |
| SR104 734010 | 5.MAR.2024 by xDevs | 10000.05277 Ω | ± 0.3 µΩ/Ω | +2.267 µΩ/Ω, +0.061 µΩ/Ω/a | 6010B DCC vs xDevs.com MP1, 0.316 mA | 13550 days |
| SR104 734010 | 6.MAR.2024 by xDevs | 10000.05287 Ω | ± 0.2 µΩ/Ω | +2.277 µΩ/Ω, +0.061 µΩ/Ω/a | 6000A BVD vs reference SR104, 0.5 mA | 13551 days |
| SR104 734010 | 7.MAR.2024 by xDevs | 10000.05267 Ω | ± 0.2 µΩ/Ω | +2.257 µΩ/Ω, +0.061 µΩ/Ω/a | 6000A BVD vs Fluke SL935, 0.5 mA | 13552 days |
| SR104 734010 | 8.MAR.2024 by xDevs | 10000.05275 Ω | ± 0.2 µΩ/Ω | +2.264 µΩ/Ω, +0.061 µΩ/Ω/a | 6000A BVD vs reference SR104, 0.5 mA | 13553 days |
| SR104 734010 | 9.MAR.2024 by xDevs | 10000.05270 Ω | ± 0.2 µΩ/Ω | +2.260 µΩ/Ω, +0.061 µΩ/Ω/a | 6000A BVD vs reference SR104, 0.5 mA | 13554 days |
| SR104 734010 | 25.MAR.2024 by xDevs | 10000.05205 Ω | ± 0.2 µΩ/Ω | +2.195 µΩ/Ω, +0.059 µΩ/Ω/a | 6000A BVD vs SR104, 0.5 mA, 9999.652 ΩTEMP | 13570 days |
| SR104 734010 | 26.MAR.2024 by xDevs | 10000.05204 Ω | ± 0.2 µΩ/Ω | +2.194 µΩ/Ω, +0.059 µΩ/Ω/a | 6000A BVD vs DNF742-10k , 0.5 mA, 9999.887 ΩTEMP | 13571 days |
| SR104 734010 | 27.MAR.2024 by xDevs | 10000.05198 Ω | ± 0.2 µΩ/Ω | +2.188 µΩ/Ω, +0.059 µΩ/Ω/a | 6000A BVD vs reference SR104, 0.5 mA | 13572 days |
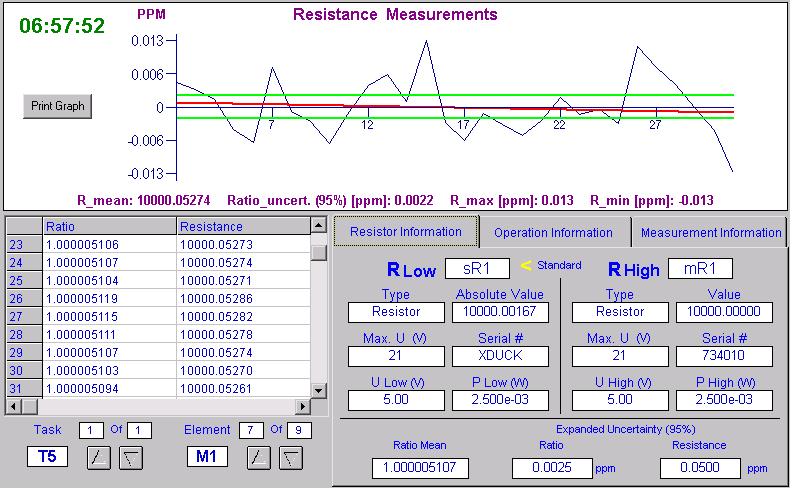
| SR104 734010 | 7.MAY.2024 by xDevs | 10000.05169 Ω | ± 0.2 µΩ/Ω | +2.159 µΩ/Ω, +0.058 µΩ/Ω/a | 6000A BVD vs reference SR104, 0.316 mA | 13613 days |
| SR104 734010 | 9.MAY.2024 by xDevs | 10000.05179 Ω | ± 0.2 µΩ/Ω | +2.179 µΩ/Ω, +0.058 µΩ/Ω/a | 6000A BVD vs reference SR104, 0.316 mA | 13615 days |
| SR104 734010 | 10.MAY.2024 by xDevs | 10000.05170 Ω | ± 0.2 µΩ/Ω | +2.170 µΩ/Ω, +0.058 µΩ/Ω/a | 6000A BVD vs reference SR104, 0.316 mA | 13616 days |
| SR104 734010 | 11.MAY.2024 by xDevs | 10000.05168 Ω | ± 0.2 µΩ/Ω | +2.158 µΩ/Ω, +0.058 µΩ/Ω/a | 6000A BVD vs reference SR104, 0.316 mA | 13617 days |
| SR104 734010 | 14.MAY.2024 by xDevs | 10000.05205 Ω | ± 0.2 µΩ/Ω | +2.195 µΩ/Ω, +0.058 µΩ/Ω/a | 6000A BVD vs reference SR104, 0.316 mA | 13620 days |
Table 5. SR104 S/N 734010 history
And same data in long term drift chart to illustrate the stability of SR104 S/N 734010.
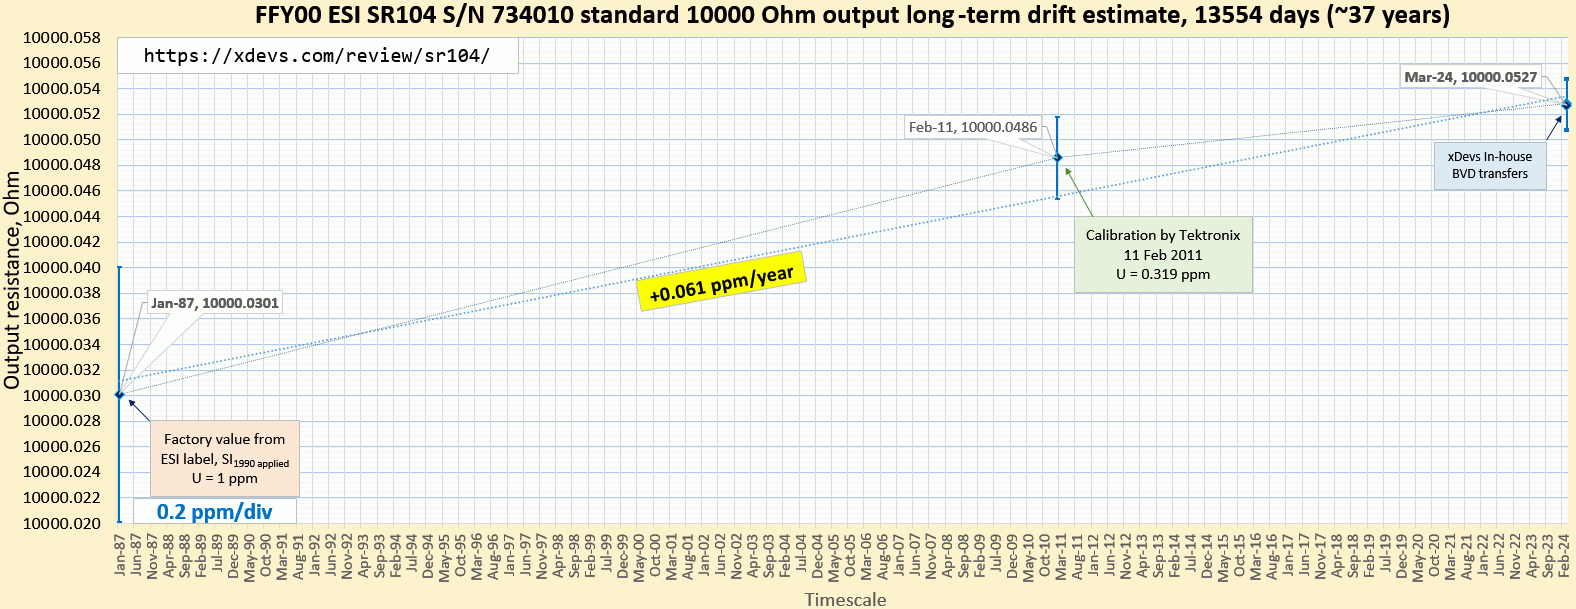
Image 68: Calculated long-term drift estimate and calibration points
Please keep in mind that these calibration results are not accredited and cannot be used for any legal or traceability purposes. They are done to the best available capability, but only provided on AS IS conditions and purely for educational purposes.
ESI SR104 S/N 948019 performance benchmarks
This ESI era SR104 was acquired from a secondary market by our friend and spent 145 hours in transit by domestic postal service shipping from Wisconsin to New Jersey, starting from March 15, 2024. The standard was sent in a single layer cardboard box and packed in a trash bag. It still survived frosty shipping without adding mechanical damages.
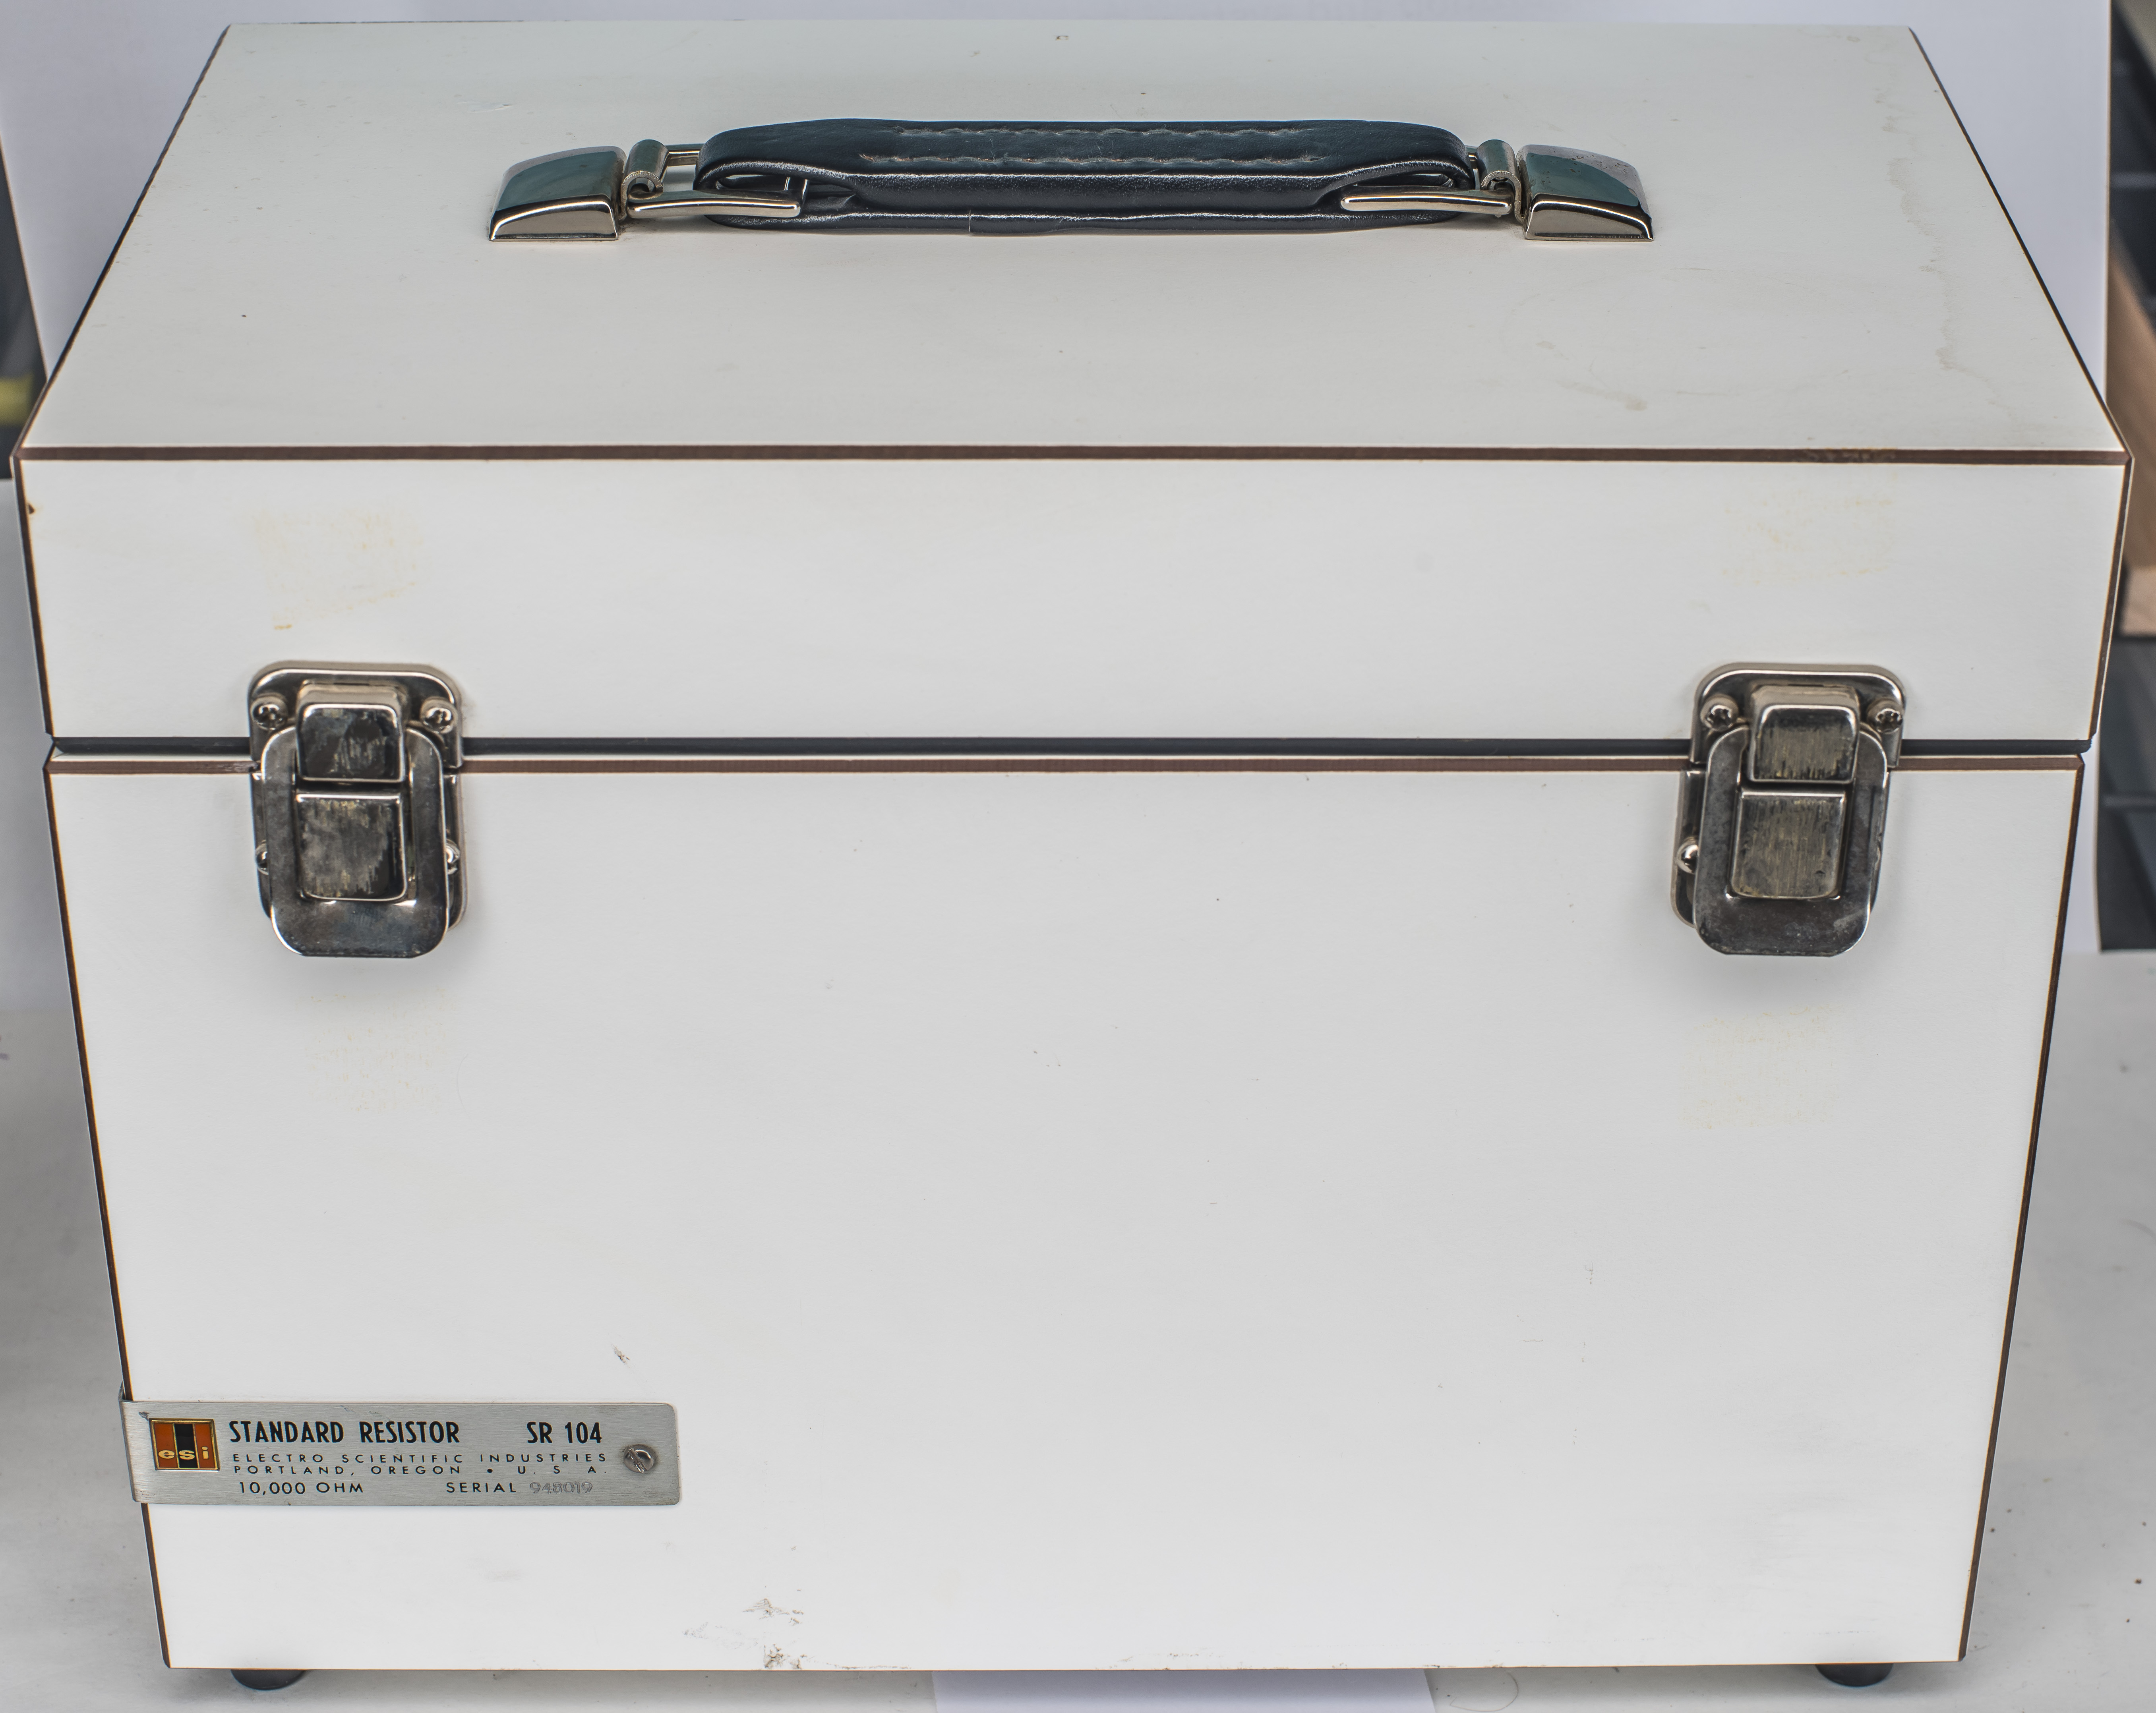
Image 72: ESI SR104 for Sergiy, as received
There are few black scuffs and dirt marks on the outer surfaces. Nothing too bad and easily possible to clean off. Top cover lid still have good and complete handle, despite older age to SR104 we looked just in a chapter above.
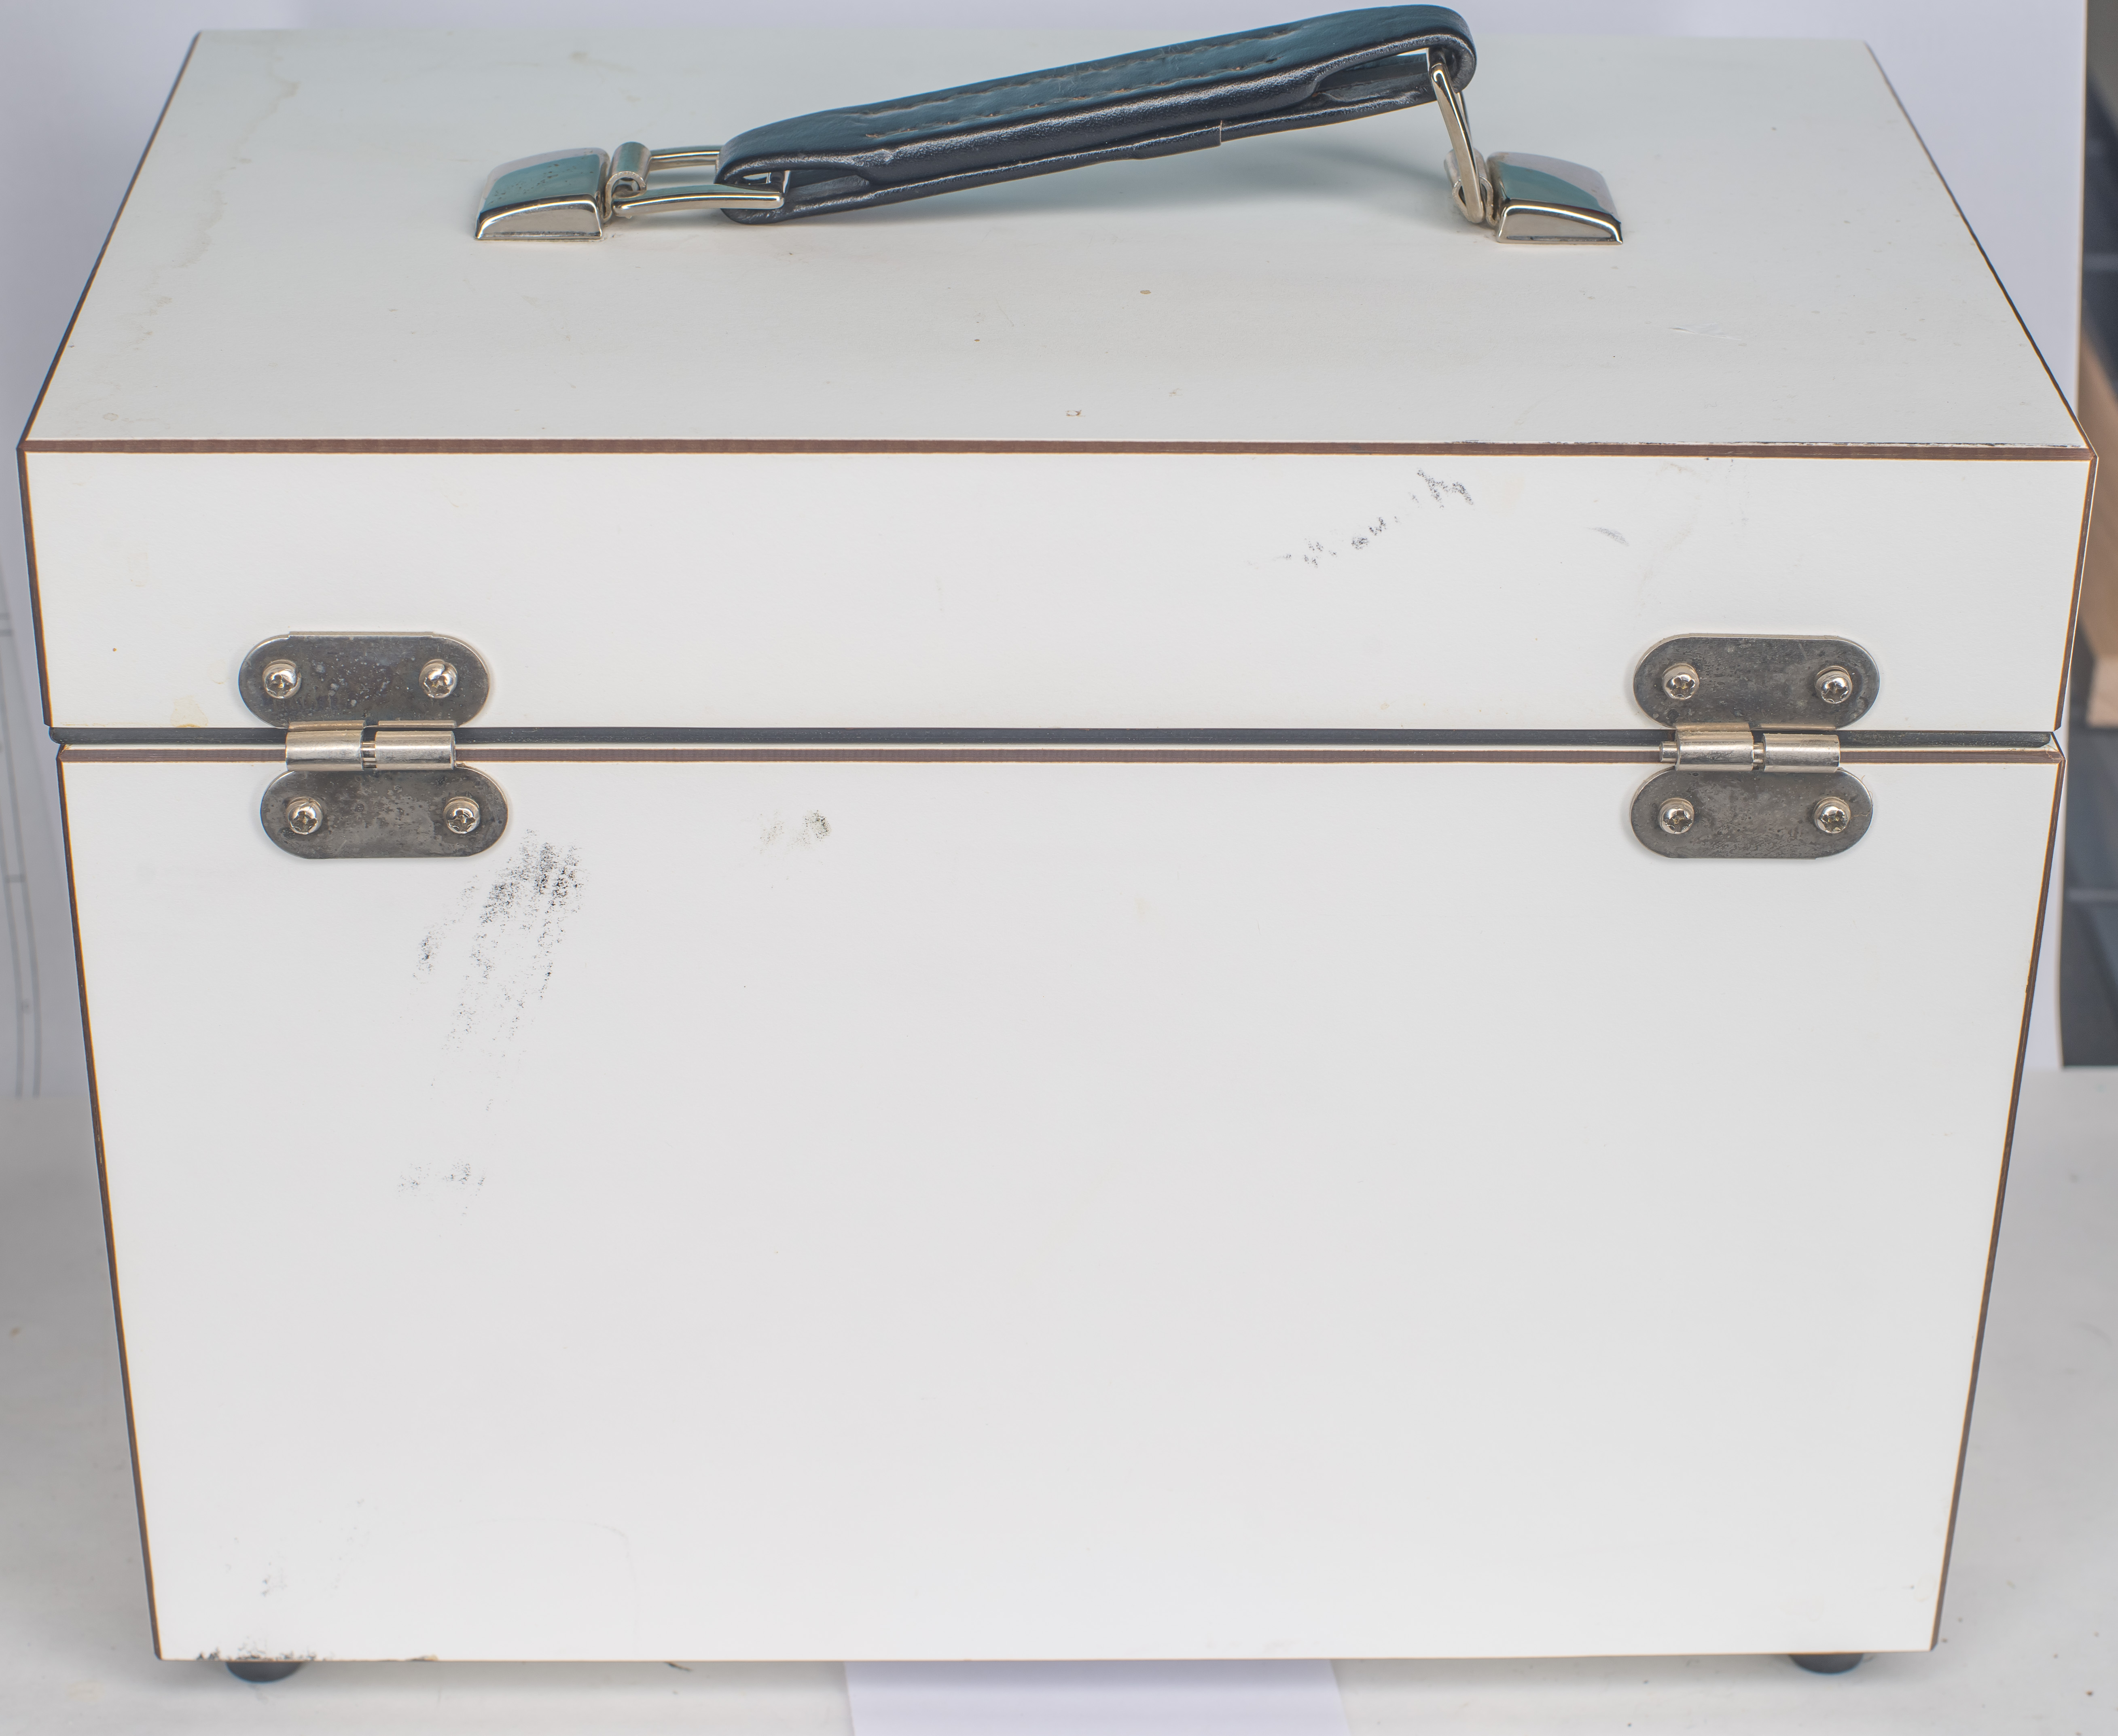
Image 73: ESI SR104 for Sergiy, as received
![]()
Image 74: Badge with model number and proud factory labels on this standard
All beautiful orange-black ESI original badges are in place.
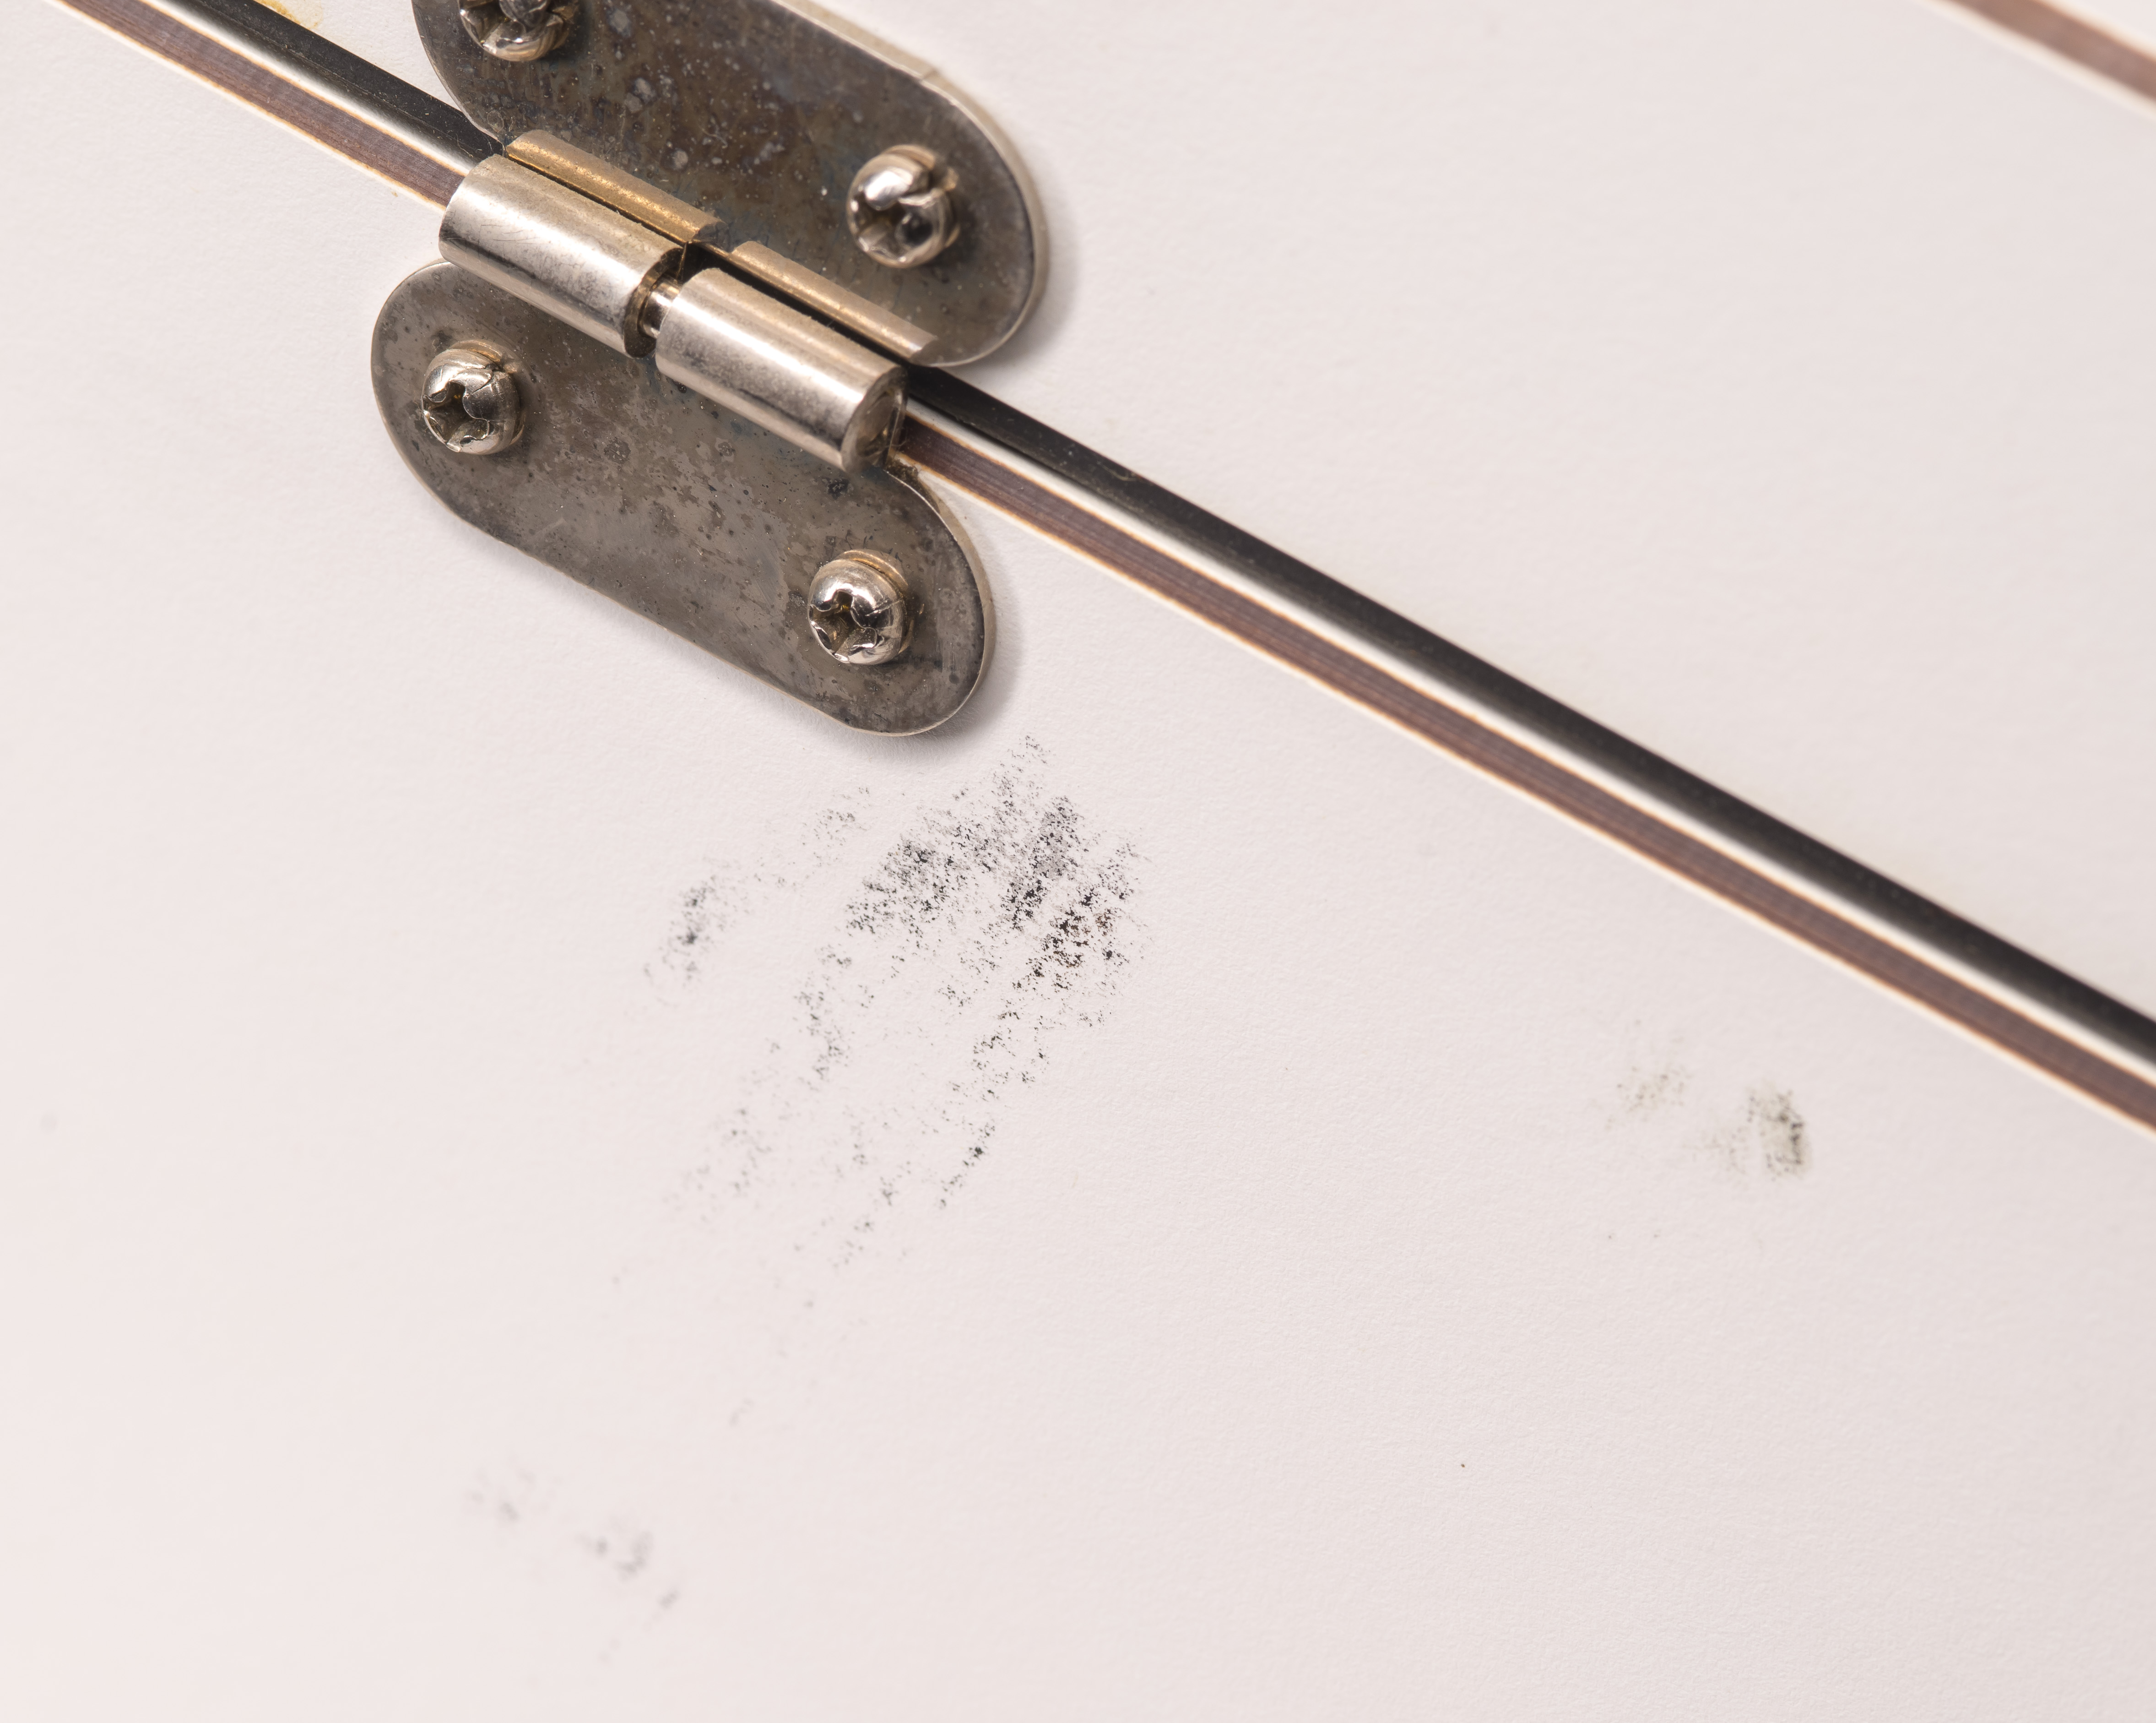
Image 75: Little dirty but nothing too bad
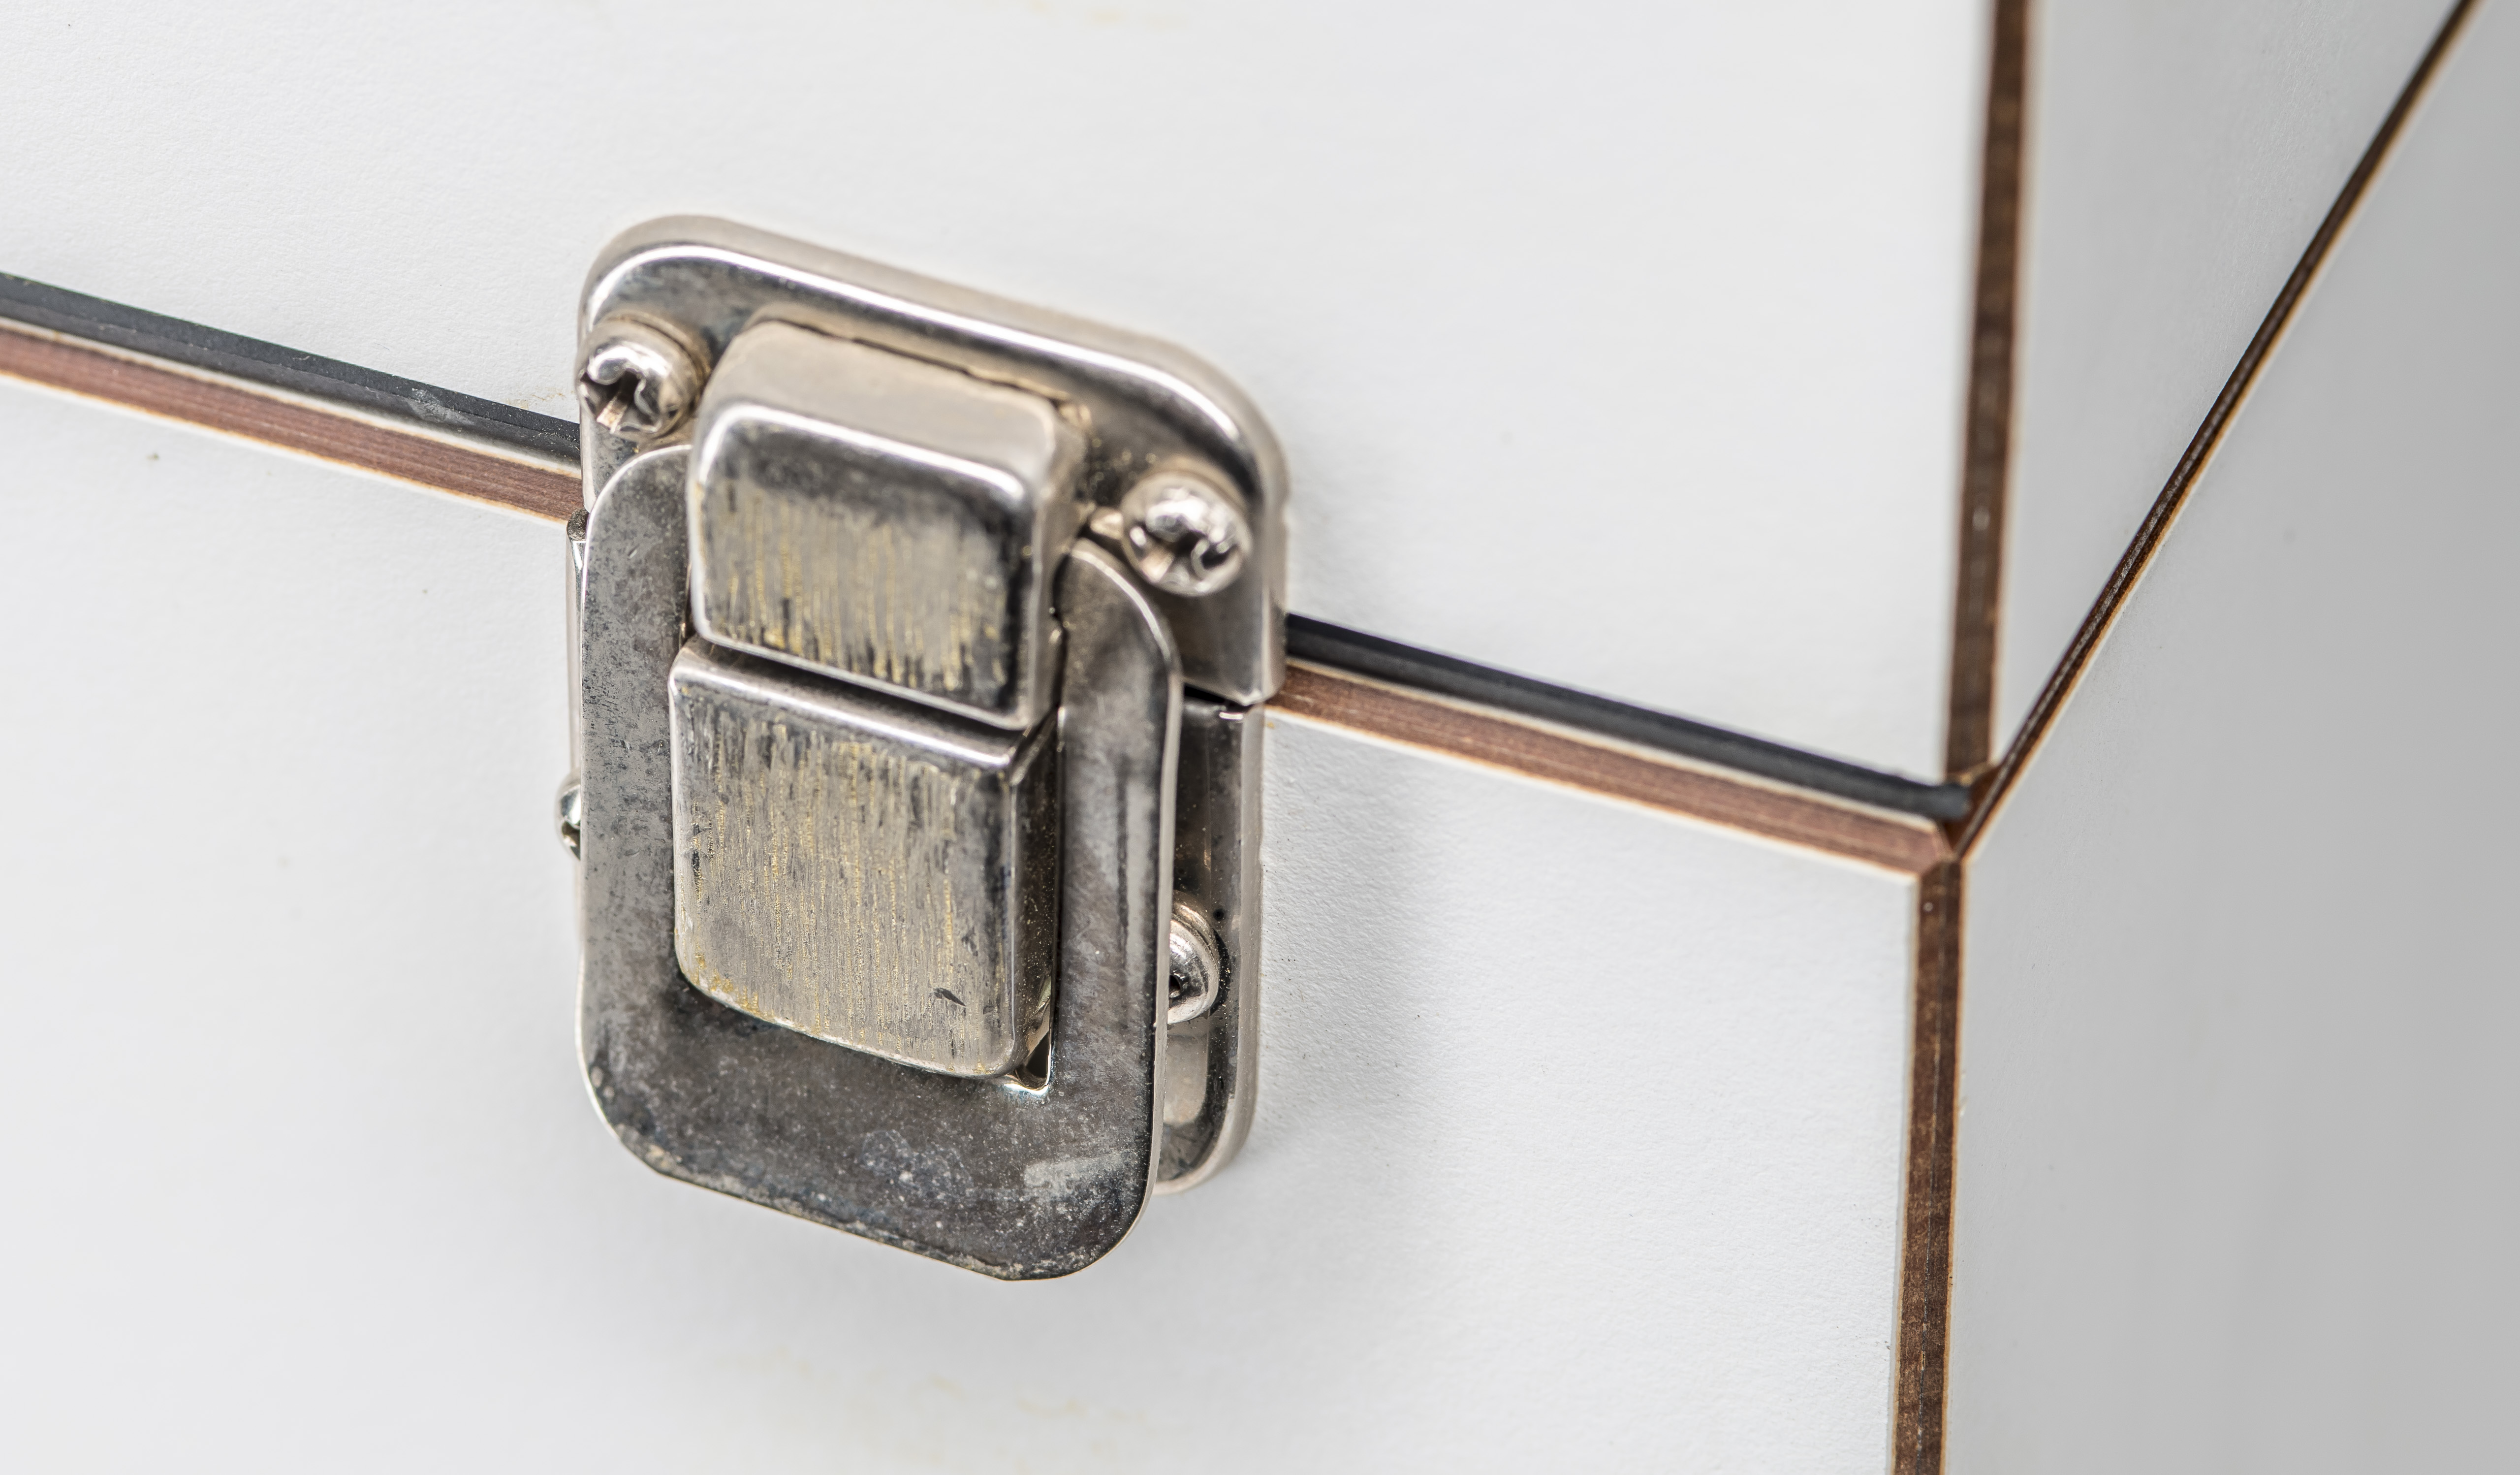
Image 76: Locks to keep lid in place for transport
Metal latch locks still had residual adhesive from the original reinforced tape used by ESI factory in those days. Cleaned off later on nicely too.
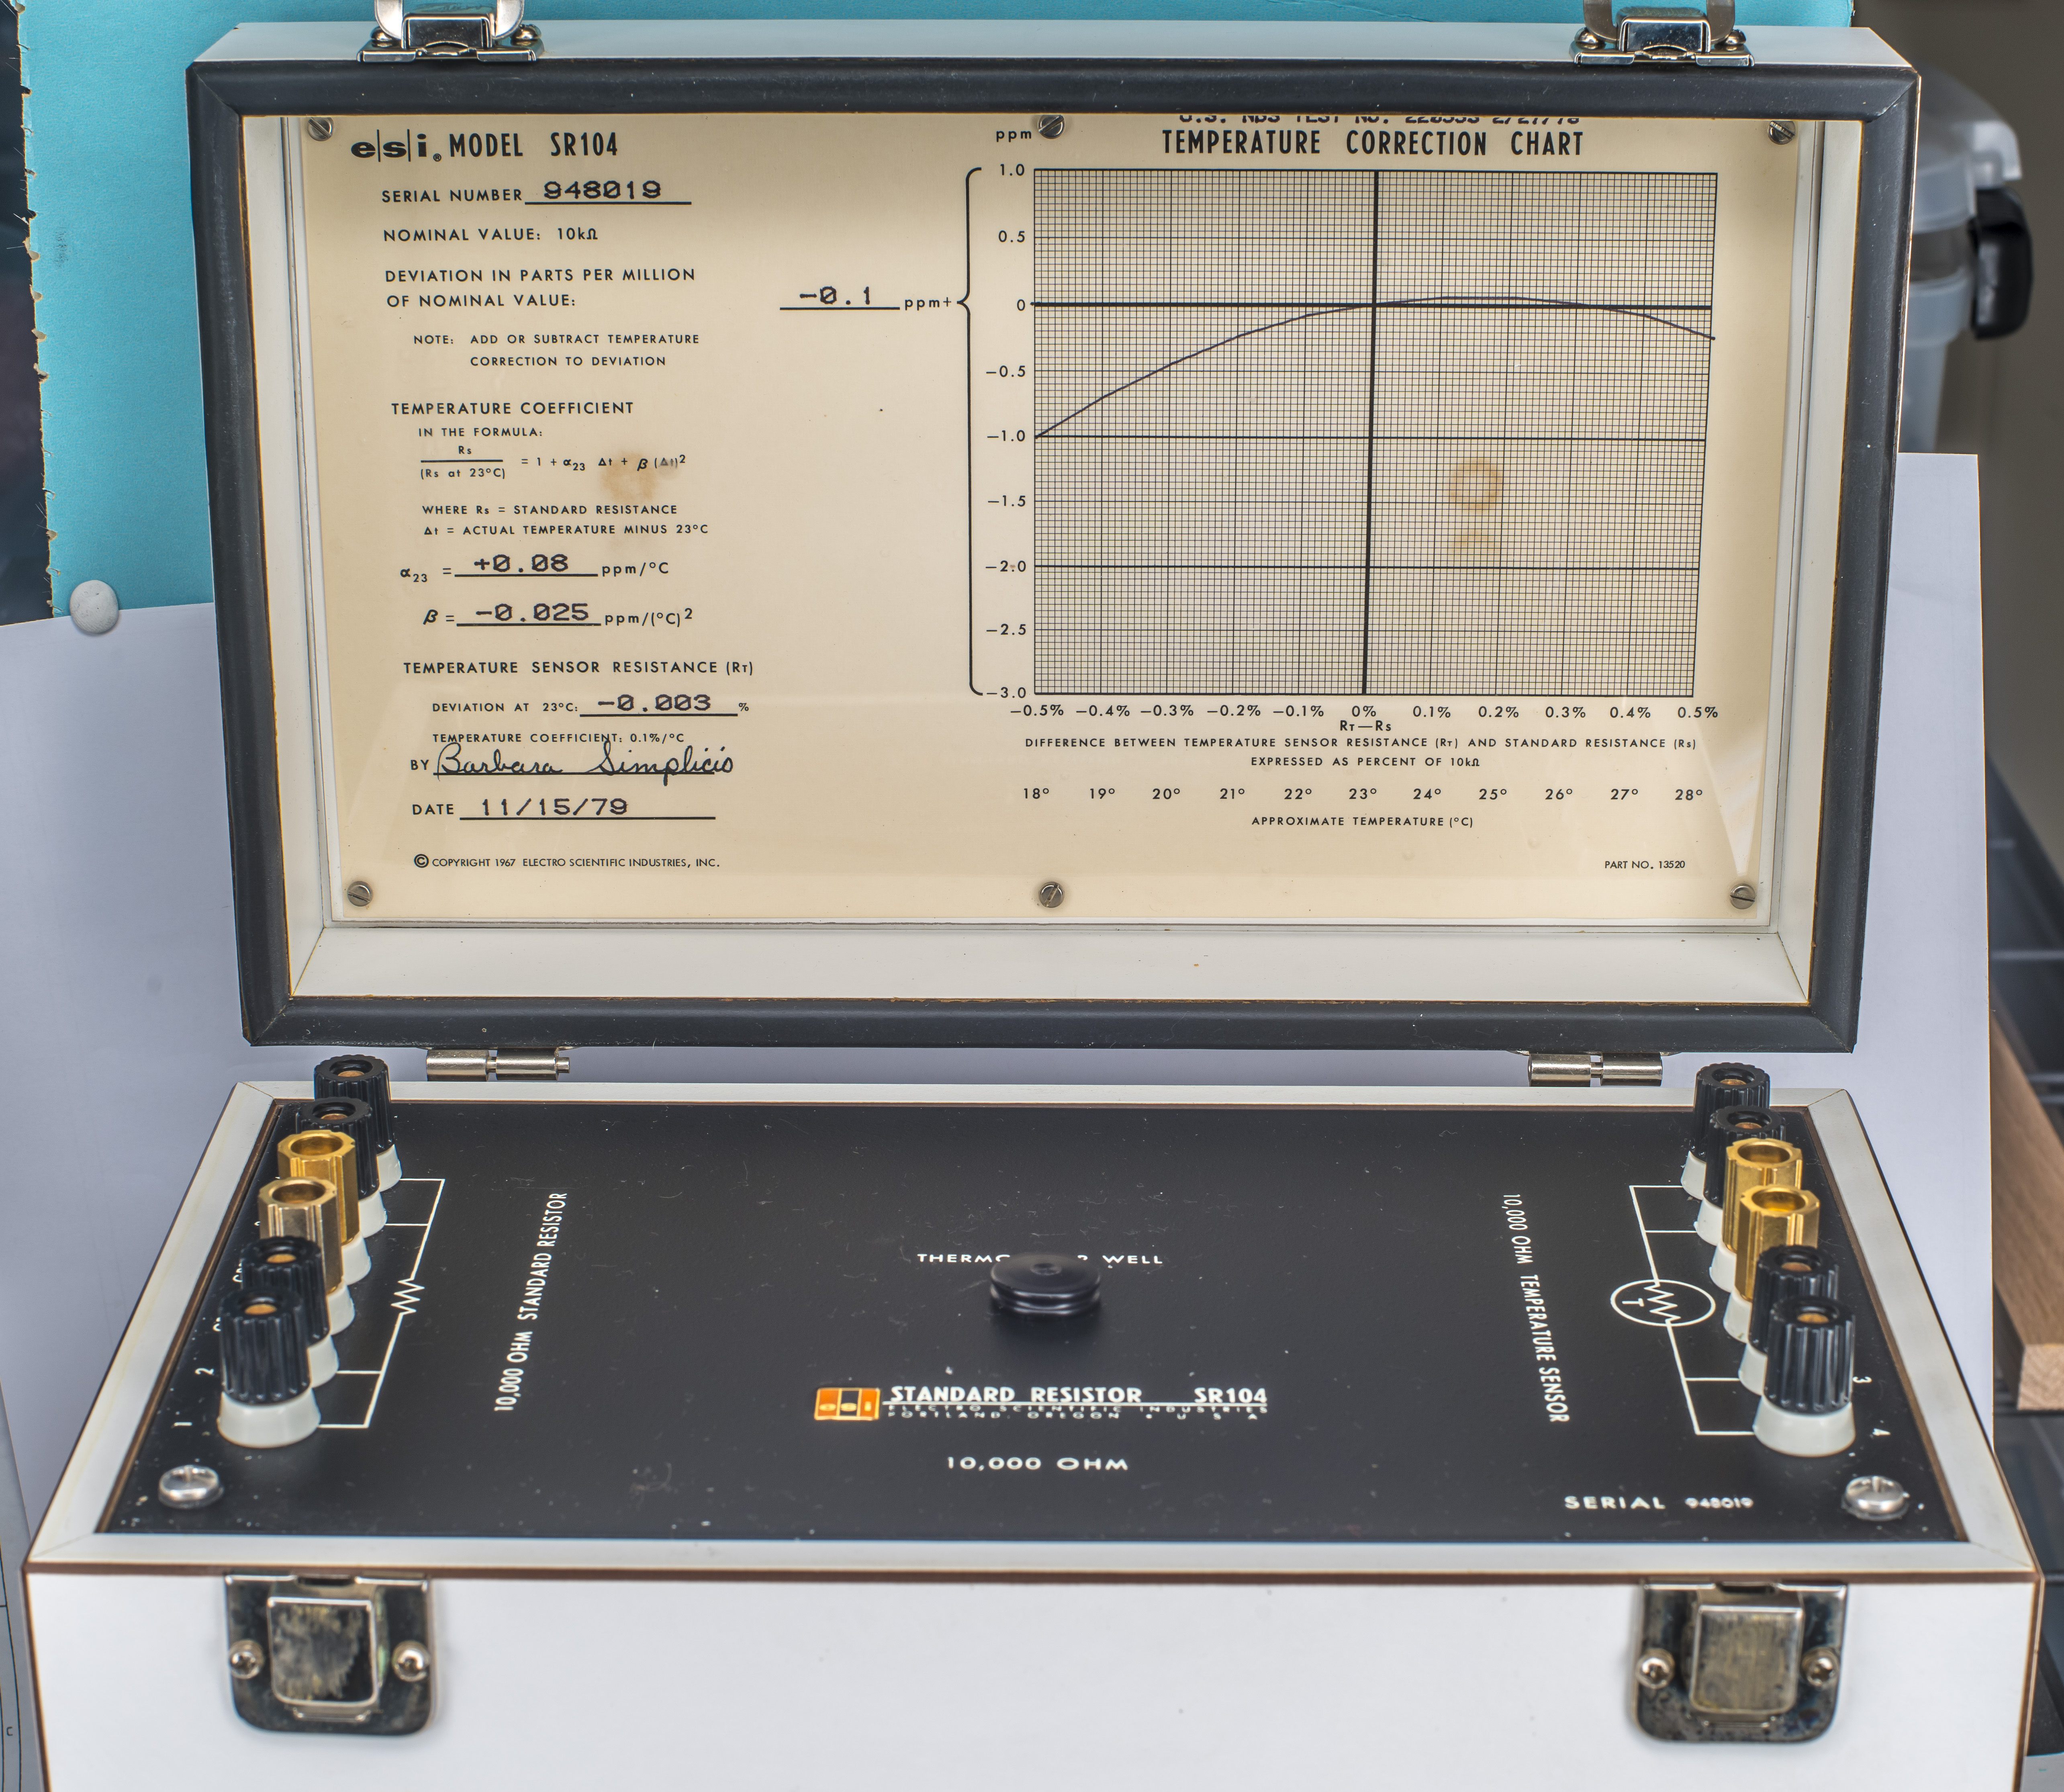
Image 77: Opened lid
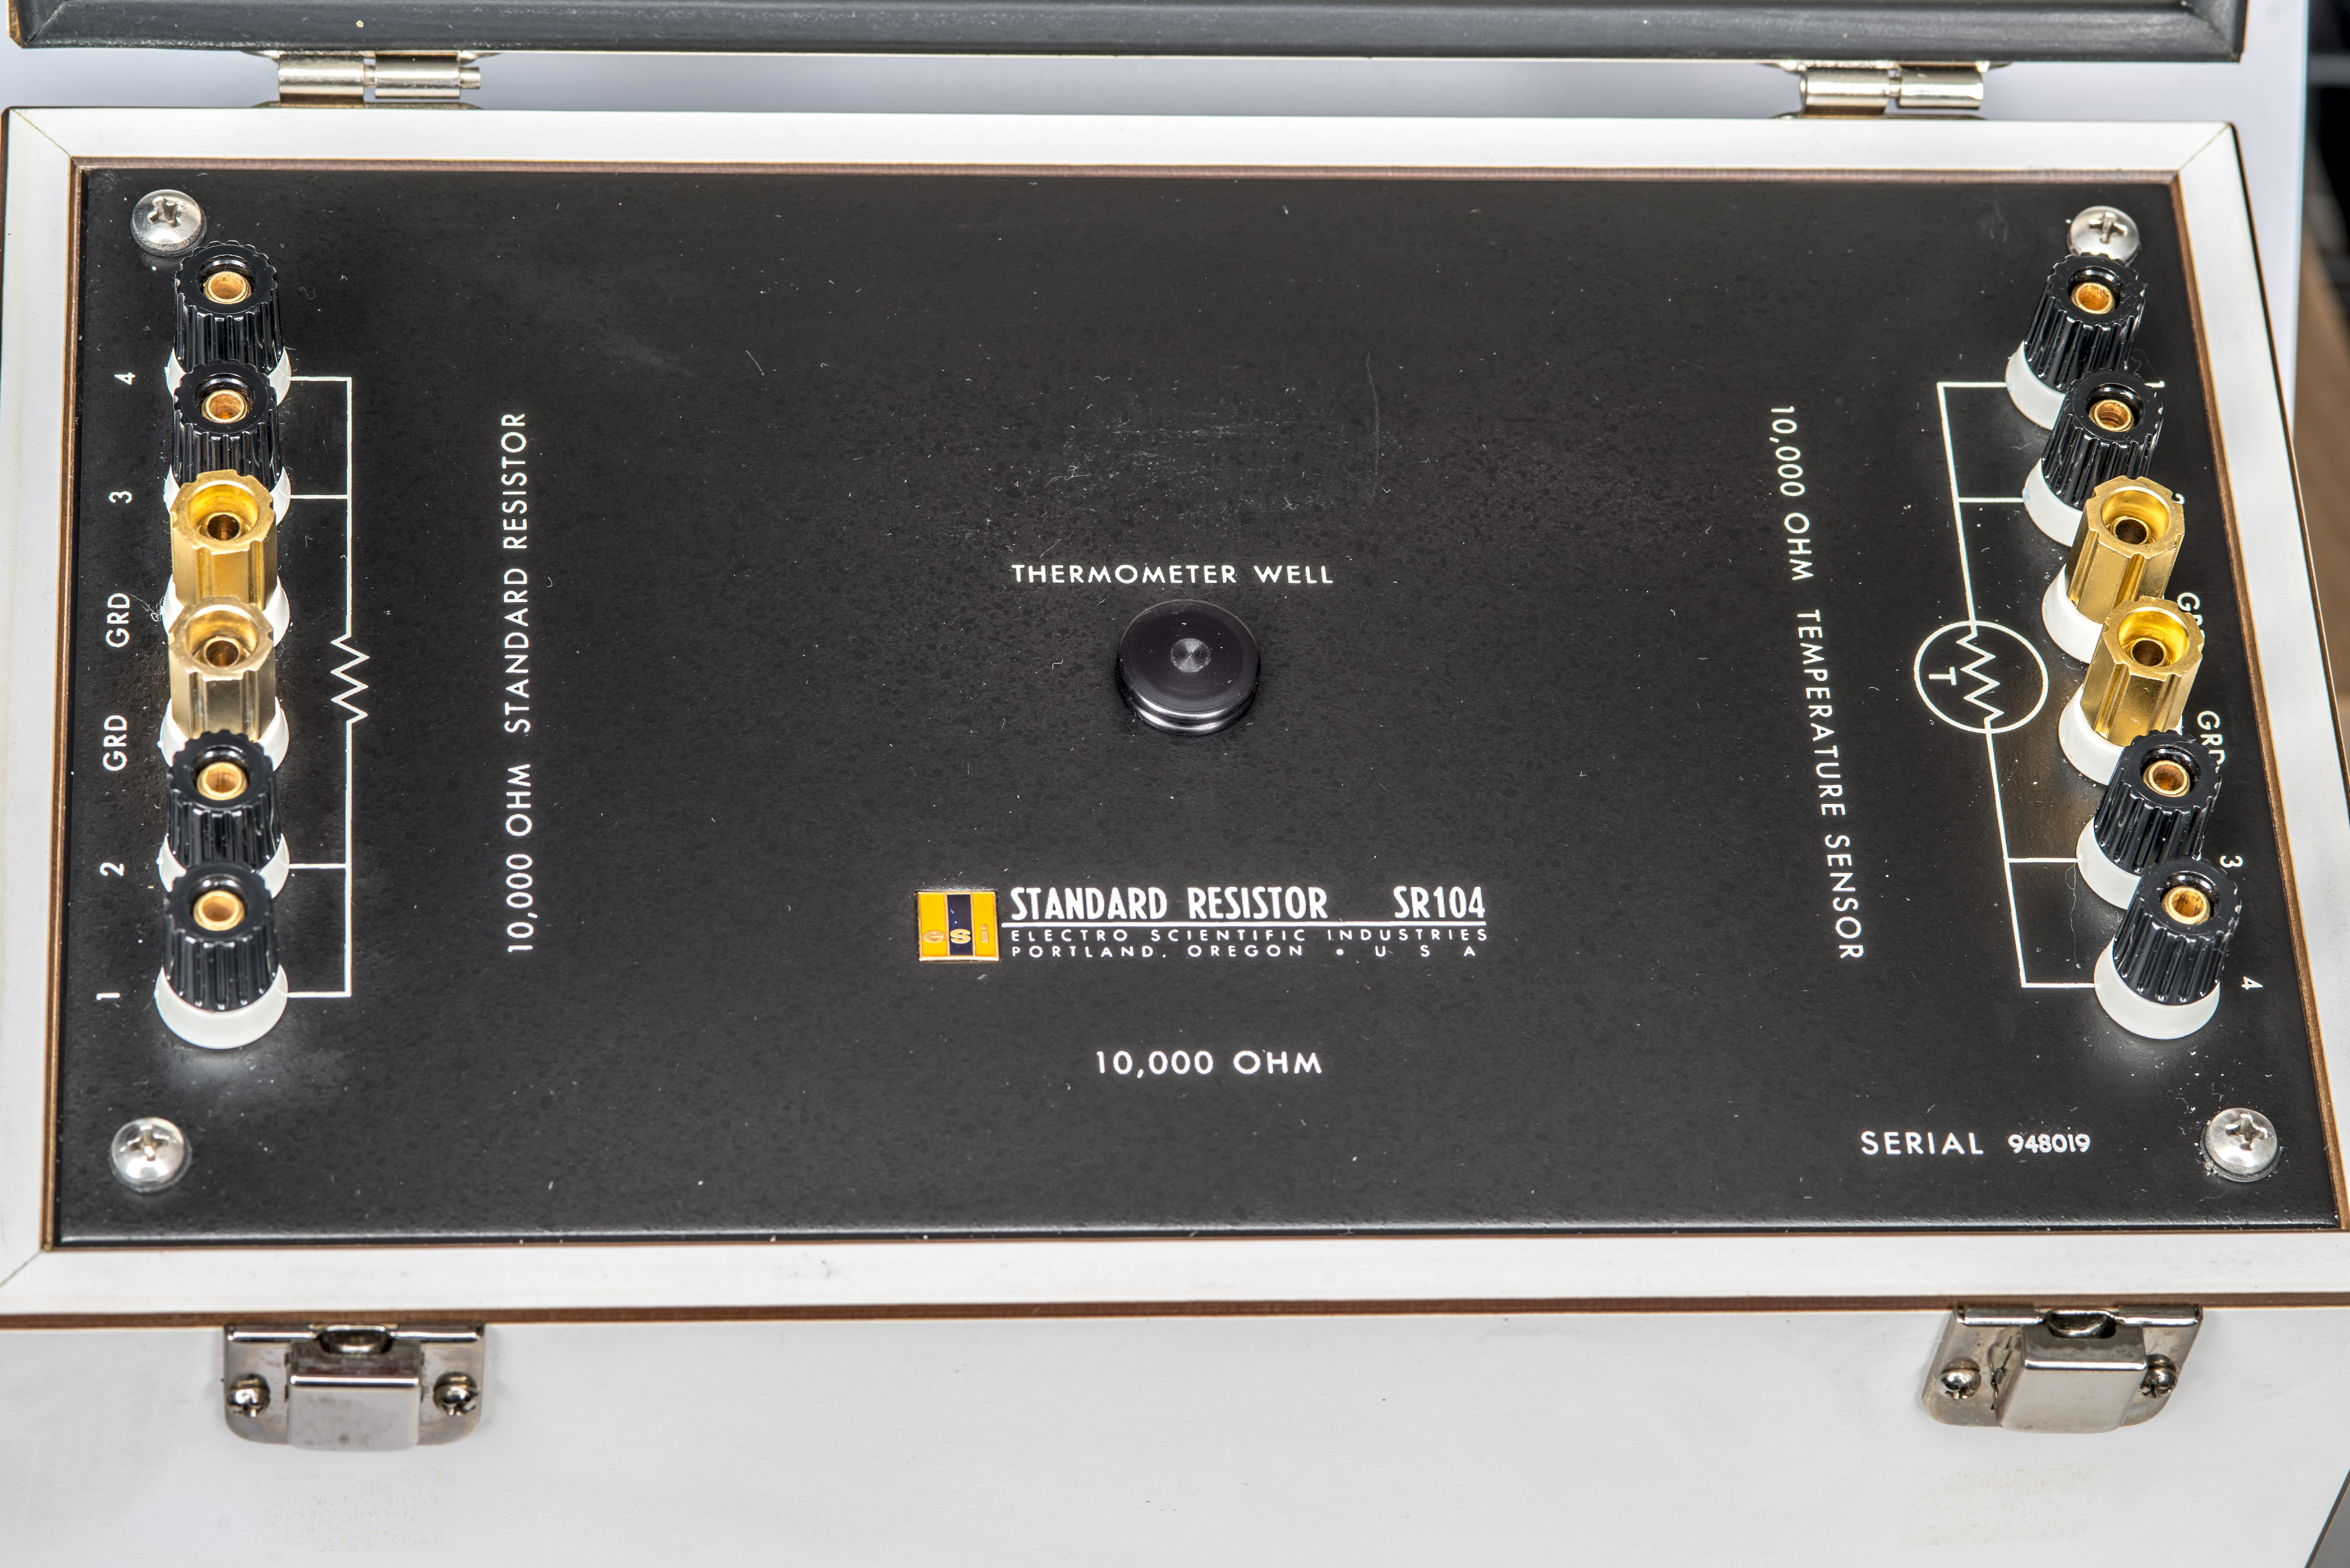
Image 78: Everything looks like new old stock
Unit even still had original plastic plug for the thermal well opening in the center.
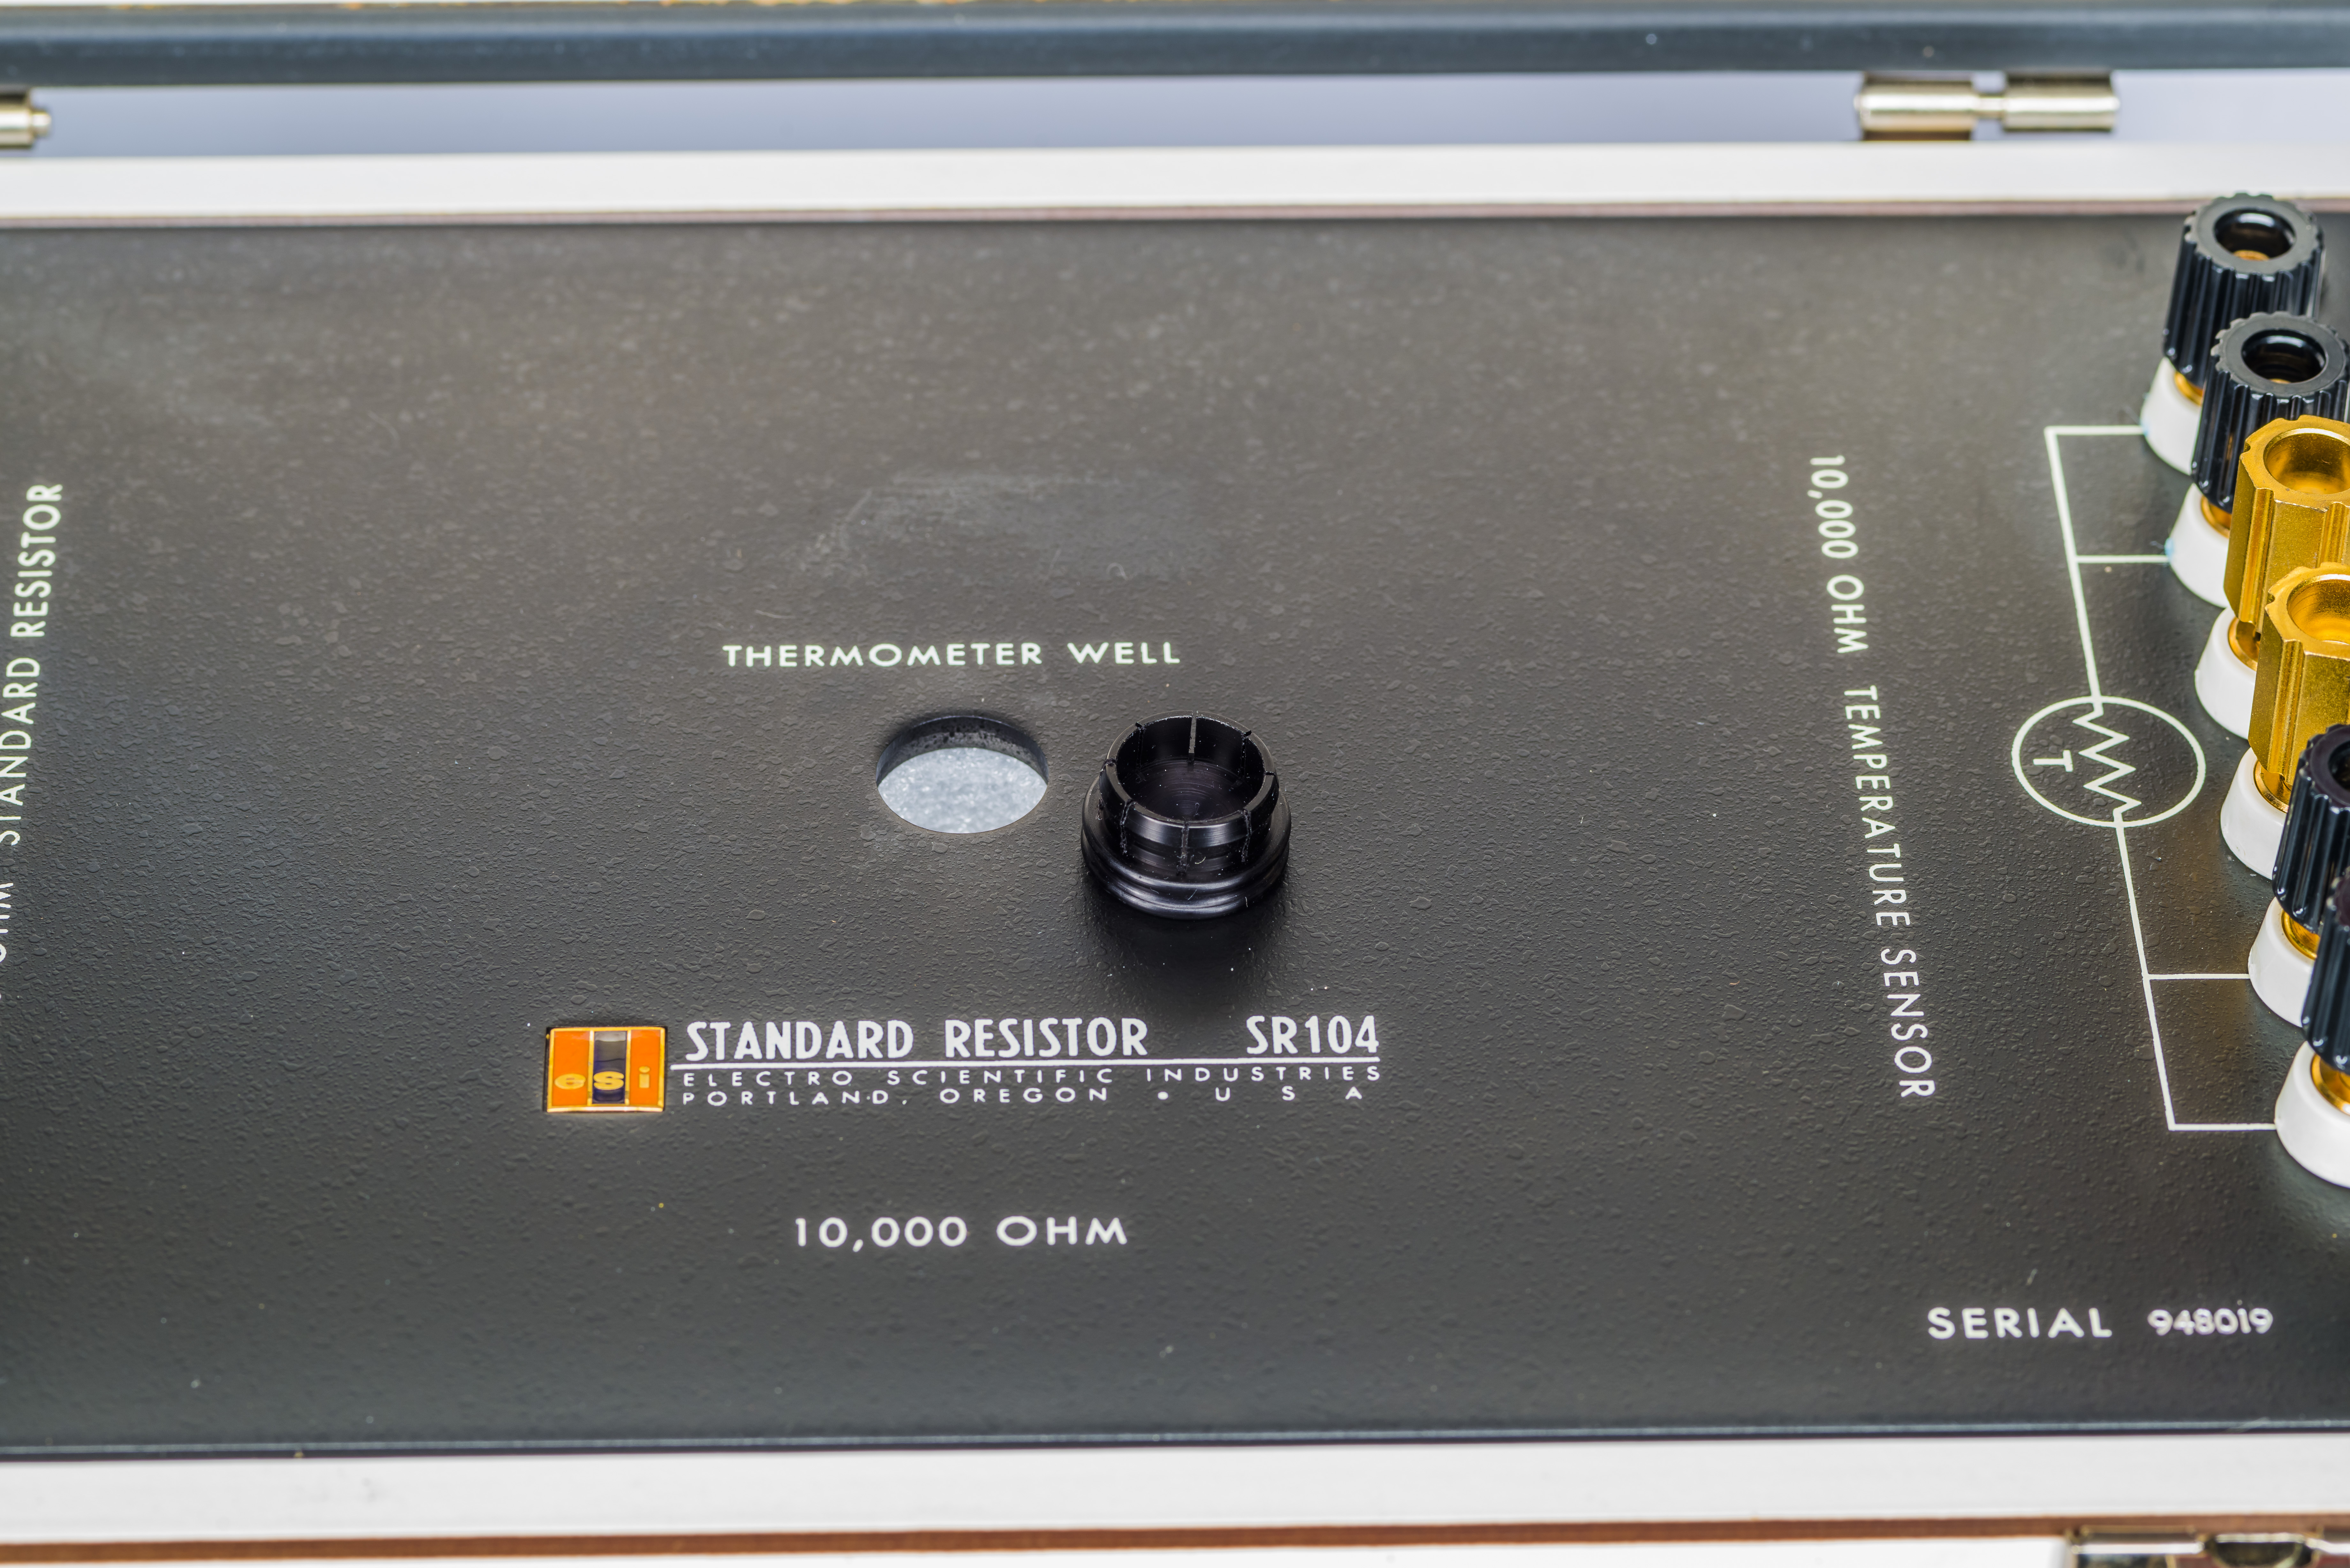
Image 79: Thermal well for external temperature sensor
This leaves us with only factory calibration from long gone year of 1979 and current present times. Hopefully it will still meet exceptionally good traditional performance of other ESI SR104 standards we evaluated here on xDevs.com.
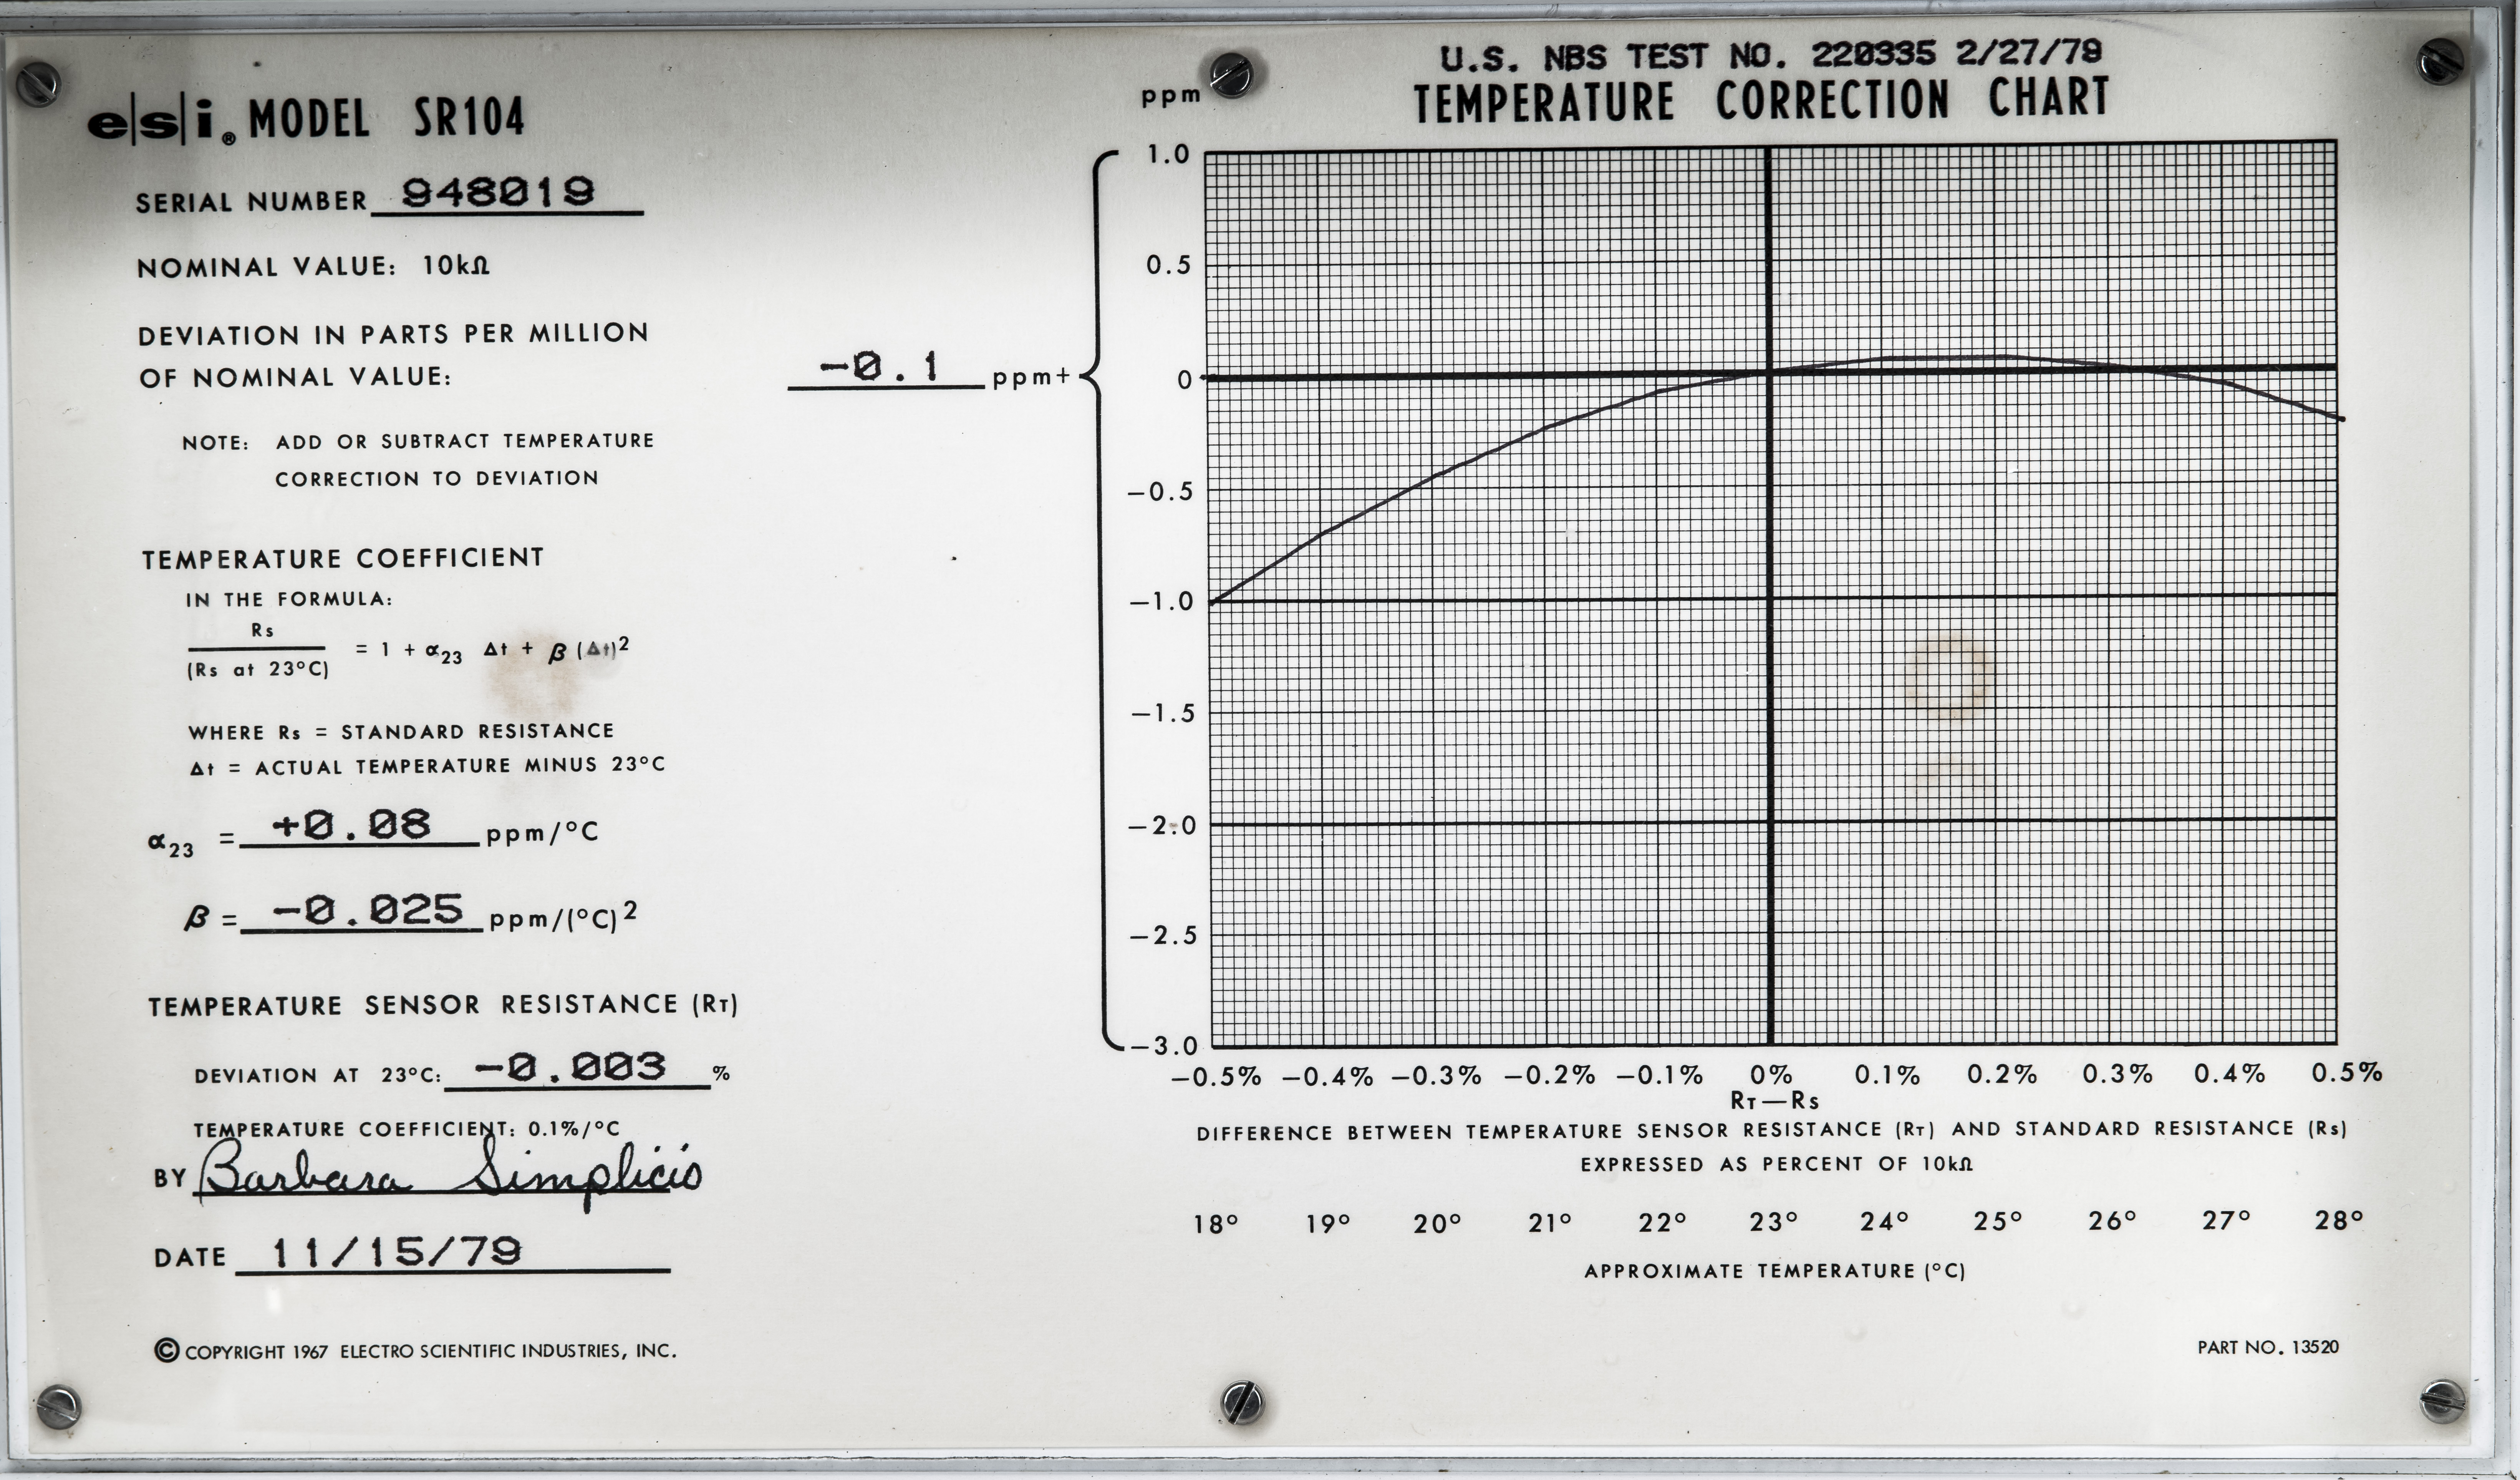
Image 80: Factory calibration label
Both main output and temperature sensor output terminals are in very good shape with almost no scratches or wear marks on the metal surfaces. It looks like this SR104 was a proper shelf queen and probably didn’t see much of different calibration labs. This idea also supported by lack of any calibration history or any calibration labels attached to it.
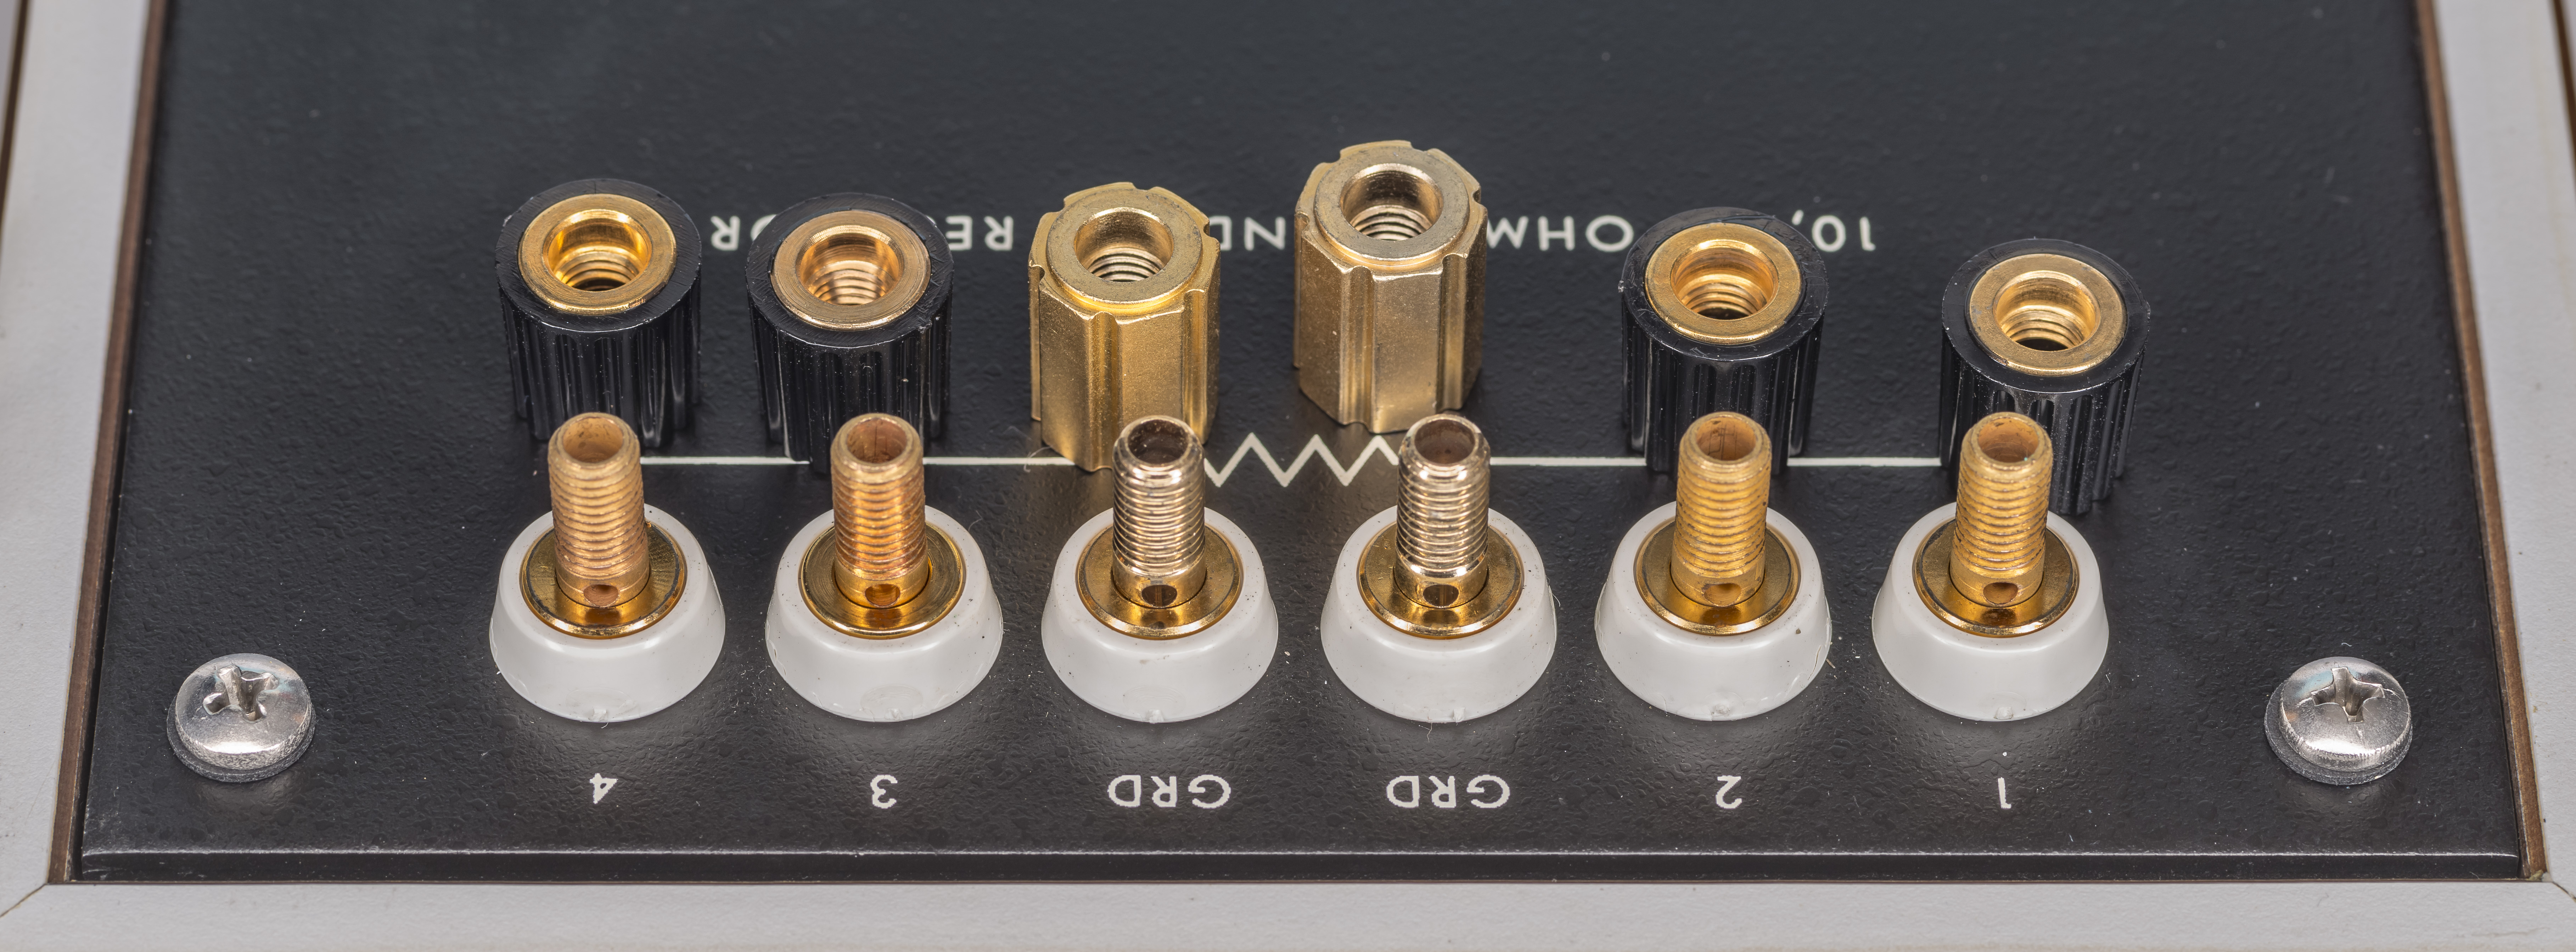
Image 81: Standard output connectors condition
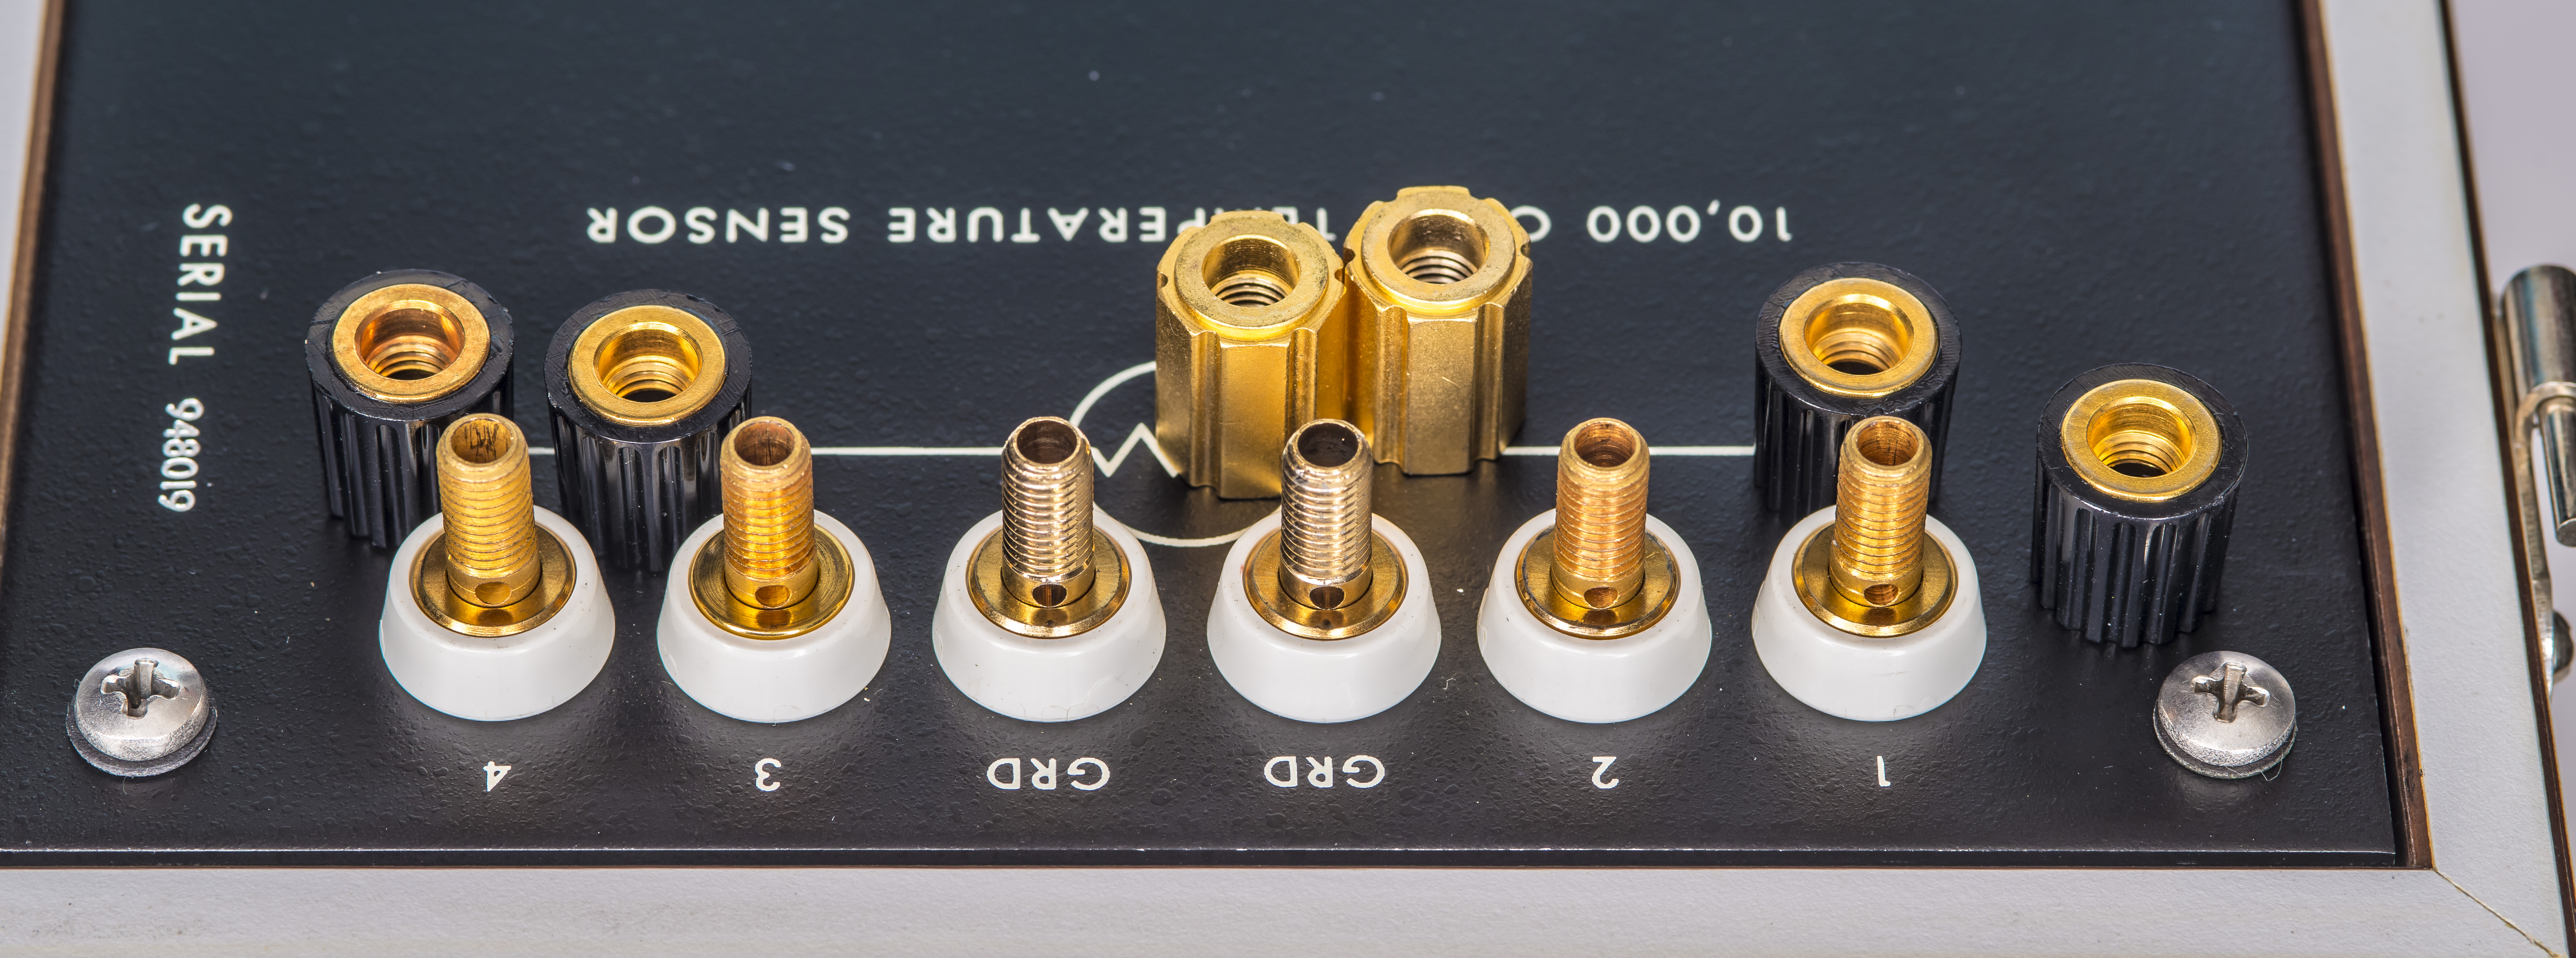
Image 82: Temperature output connectors condition
Standard was measured for temperature coefficient calibration during span of 230 hours. Final tempco values were calculated on April 1, 2024.
Measurement and calibration results
For TCR measurements unit connected to Measurements International 6010 bridge with PTFE shielded 4-wire cable and low thermal bare copper spade lugs. Temperature sensing resistance output is connected to Keysight 3458A for monitoring internal oil tank temperature. This SR104 was also placed into DIY programmable air-bath for initial checks and TCR sweep. I’ve detached the lid to reduce a settling time constant of the SR104 a little bit.
Measurement was performed at ±316 µA current using MIL 6000A resistance bridge with 25 seconds settling time per 25 readings and with Fluke 5720A/H1 as 6.34 V DC source. Detector in this measurement was 8½-digit Keysight 3458A voltmeter. As typical with BVD bridge system overall spread is less than ±20 nΩ/Ω.
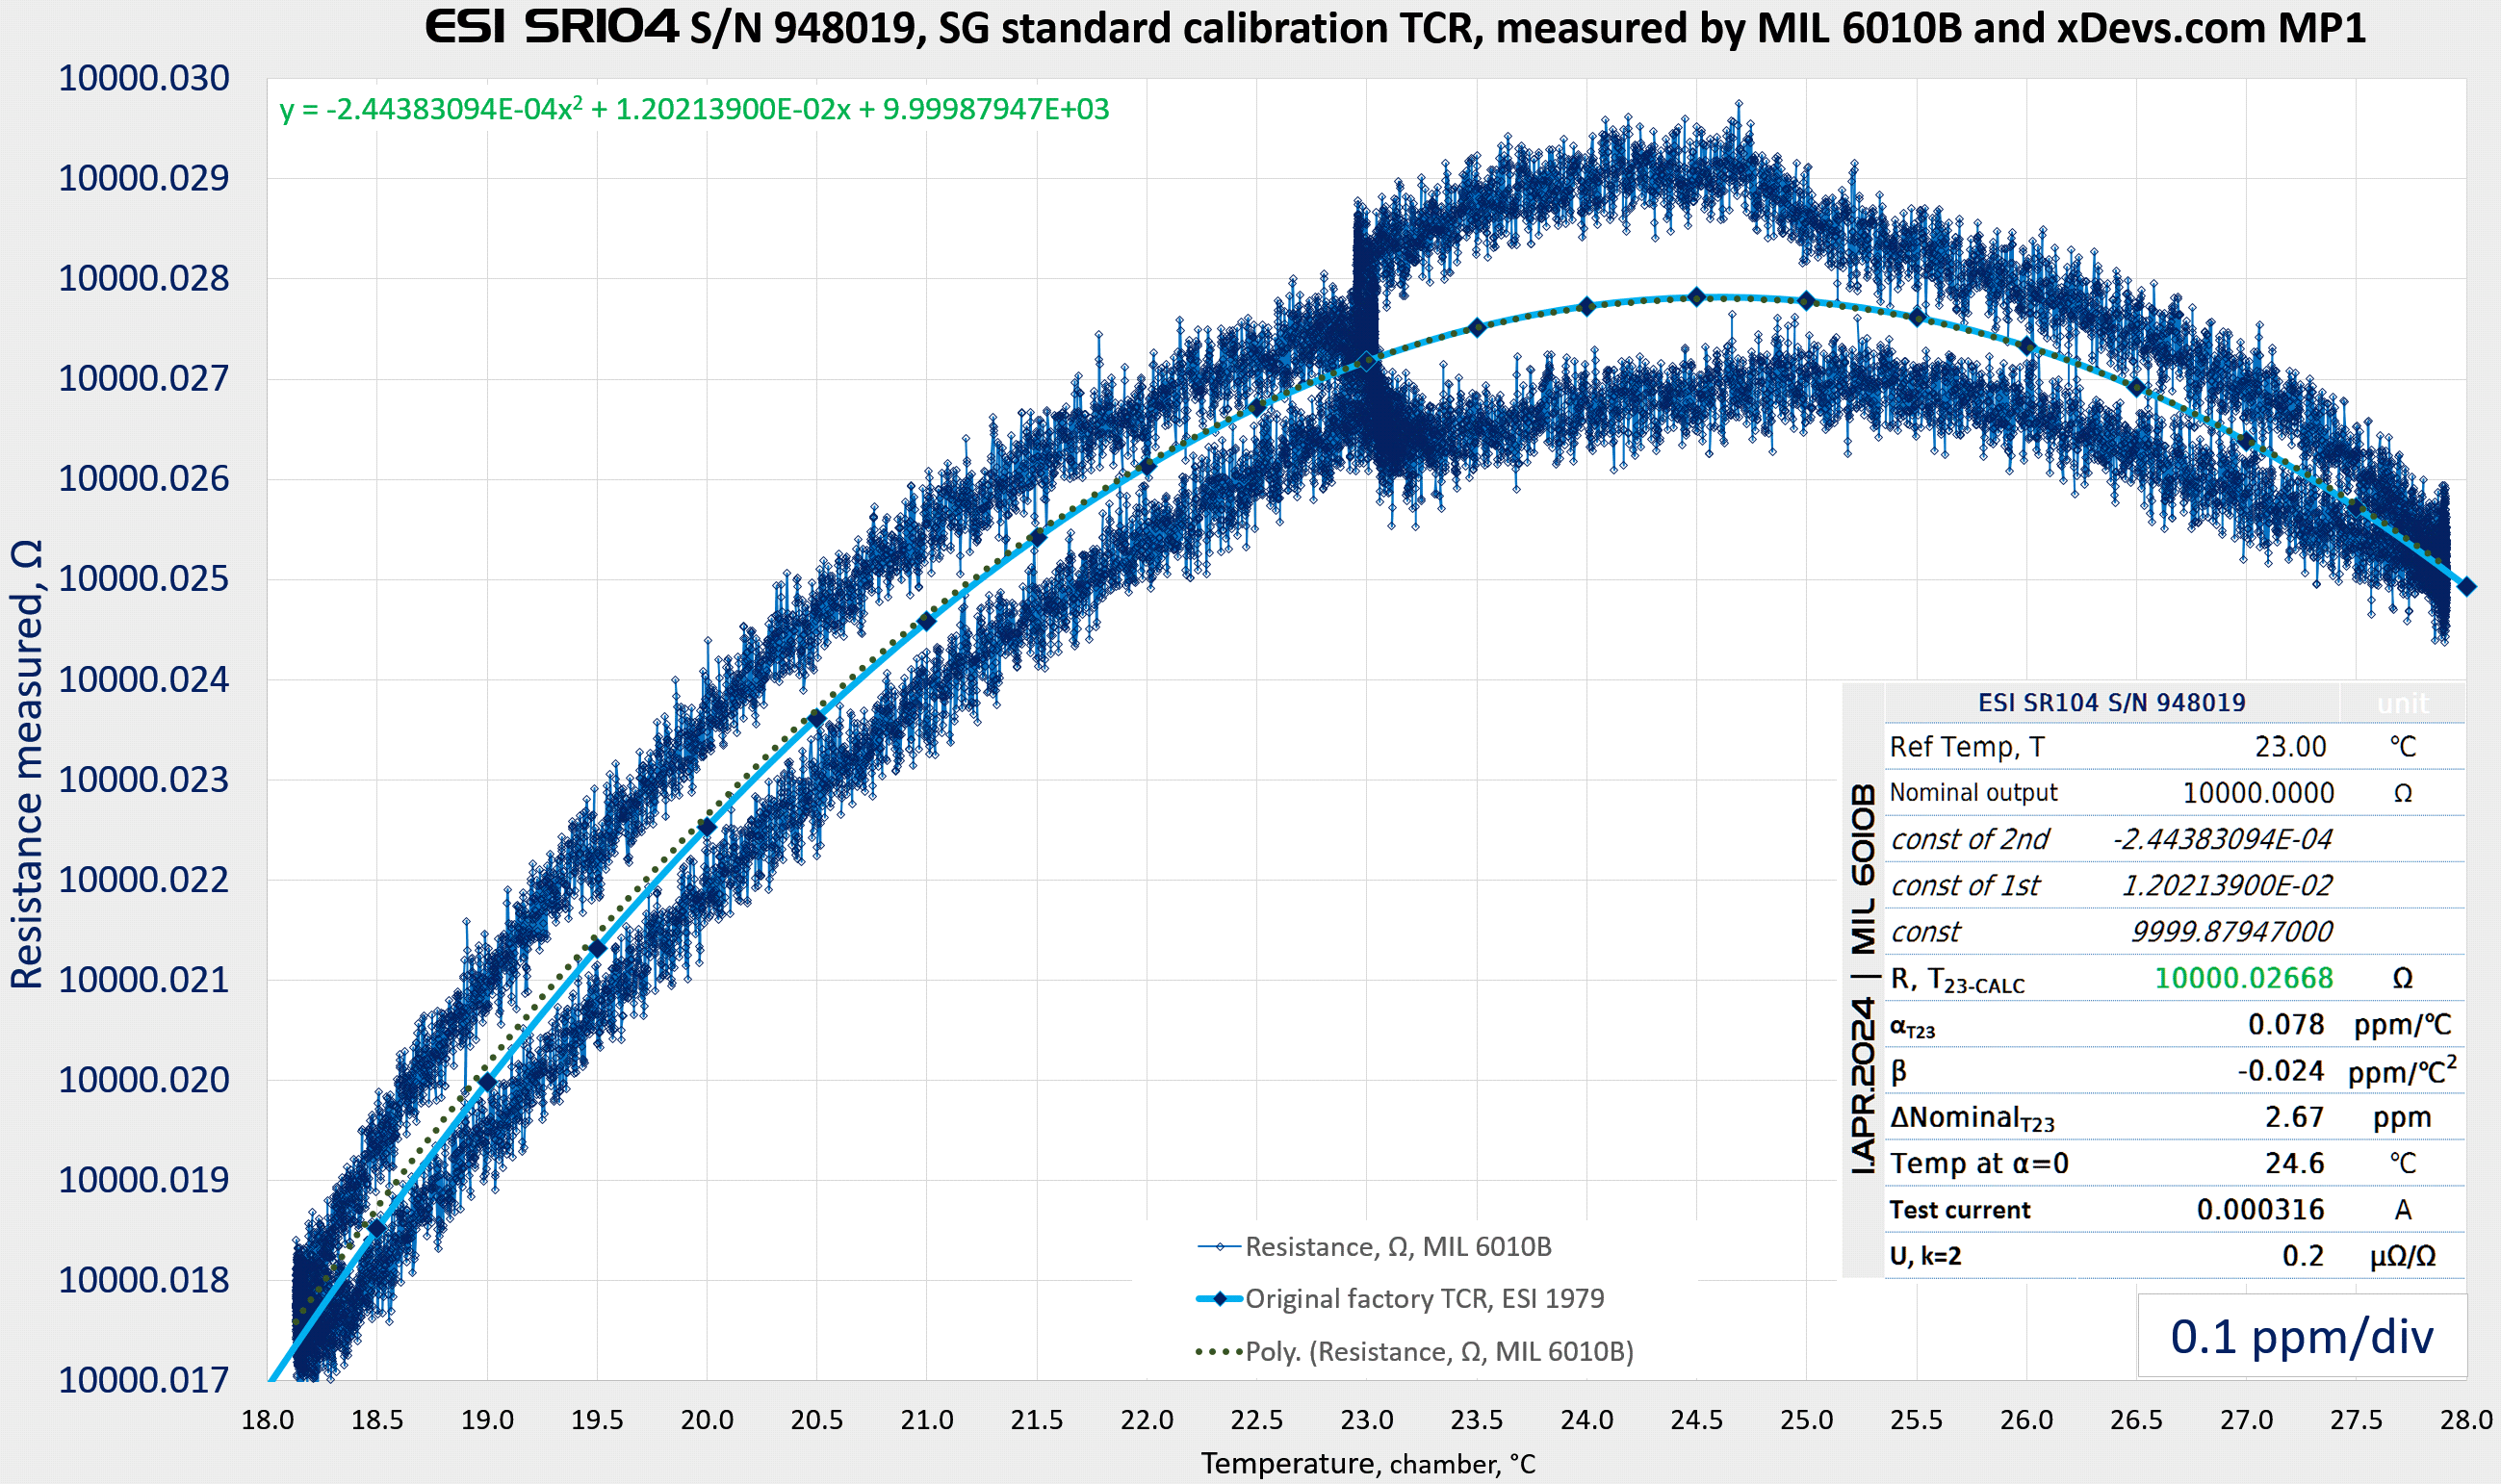
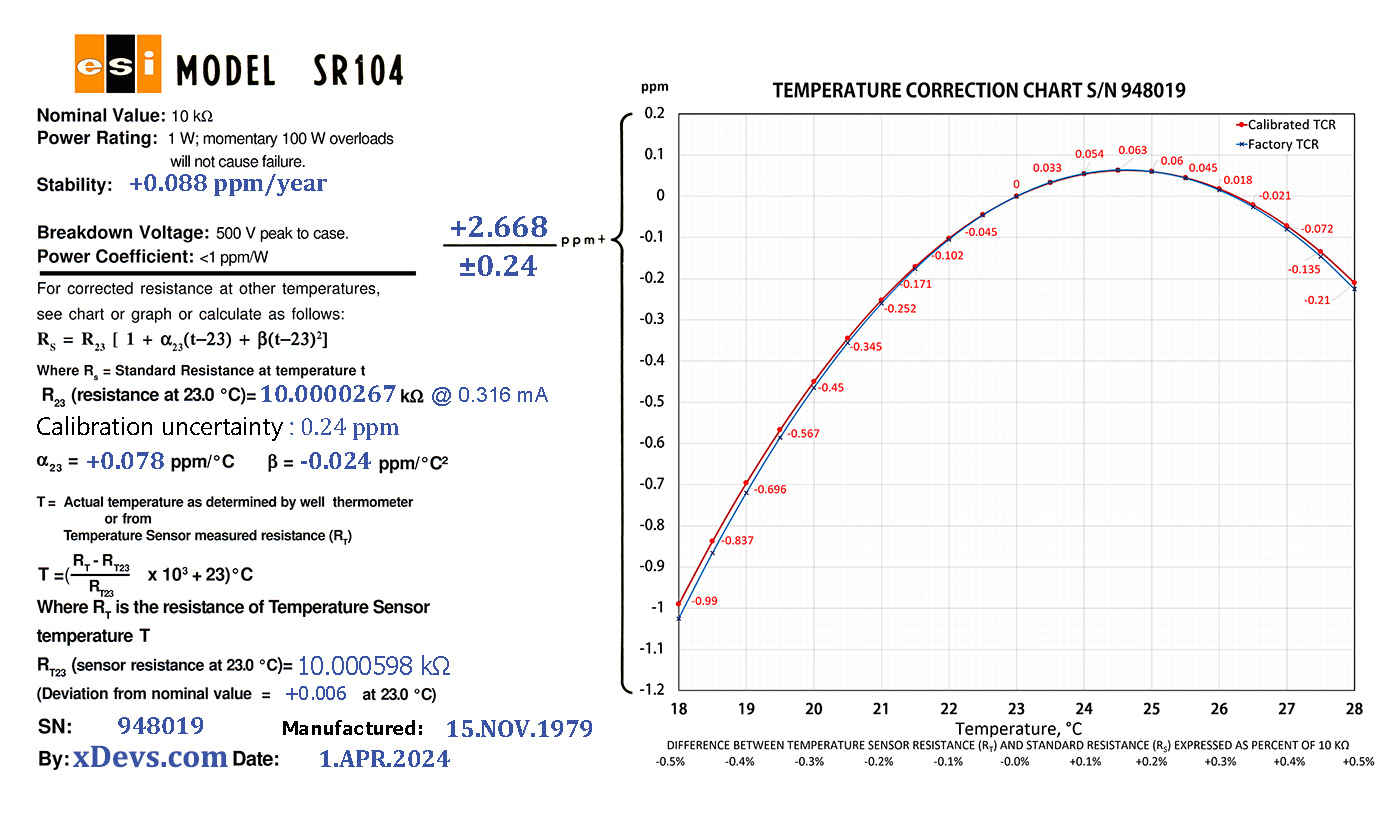
Temperature coefficient of this standard was also measured with very slow temperature profiling over 230 hours test until April 1, 2024. The temperature change speed must be very slow to account for the 6-8 hour settling delay for the massive oil tank mass and insulation properties of the standard unit inside SR104 enclosure. Temperature ramp set points were calculated and programmed from software algorithm implemented in xDevs.com TECKit Python app. Sweep range for the measurement was set between +18 °C and +28 °C and ramp slope was ±0.002 K/minute. From this run we can now determine new coefficients α = +0.078 µΩ/Ω/K and β = -0.024 µΩ/Ω/K2 and zero TC temperature at +24.6 °C. These values are in excellent agreement to original factory certificate on the lid from year 1979!.
SR104’s temperature output correlate to well temperature sensors with linear trend coefficient +975.01 µΩ/Ω/K. One can even calculate 2nd-order coefficients for temperature output from polyfit values (1.0247800E-04x2 + 9.7454051x + 9776.194145) equal αTEMP = 975 µΩ/Ω/K and βTEMP = +0.01 µΩ/Ω/K2, resulting at 10000.598 Ω reference point for +23.00 °C well temperature.
| Model and serial | Calibration date | Assigned value | Uncertainty | Calculated drift | Notes | Age |
|---|---|---|---|---|---|---|
| SR104 948019 | 15.NOV.1979, factory | 9999.9875 Ω (corrected to SI1990) | ± 1.0 µΩ/Ω | Ref | Original factory label | Ref |
| SR104 948019 | 31.MAR.2024 by xDevs | 10000.02785 Ω | ± 0.24 µΩ/Ω | +4.035 µΩ/Ω, +0.091 µΩ/Ω/a | 6010B DCC vs xDevs.com MP1, 0.316 mA | 16209 days |
| SR104 948019 | 1.APR.2024 by xDevs | 10000.02668 Ω | ± 0.2 µΩ/Ω | +3.918 µΩ/Ω, +0.088 µΩ/Ω/a | 6000A BVD vs reference SR104, 0.316 mA | 16210 days |
| SR104 948019 | 7.MAY.2024 by xDevs | 10000.02619 Ω | ± 0.2 µΩ/Ω | +3.869 µΩ/Ω, +0.087 µΩ/Ω/a | 6000A BVD vs reference SR104, 0.316 mA | 16245 days |
| SR104 948019 | 9.MAY.2024 by xDevs | 10000.02624 Ω | ± 0.2 µΩ/Ω | +3.874 µΩ/Ω, +0.087 µΩ/Ω/a | 6000A BVD vs reference SR104, 0.316 mA | 16247 days |
| SR104 948019 | 10.MAY.2024 by xDevs | 10000.02619 Ω | ± 0.2 µΩ/Ω | +3.869 µΩ/Ω, +0.087 µΩ/Ω/a | 6000A BVD vs reference SR104, 0.316 mA | 16248 days |
| SR104 948019 | 11.MAY.2024 by xDevs | 10000.02616 Ω | ± 0.2 µΩ/Ω | +3.866 µΩ/Ω, +0.087 µΩ/Ω/a | 6000A BVD vs reference SR104, 0.316 mA | 16249 days |
| SR104 948019 | 25.MAY.2024, MI measurement | 10000.0281 Ω | ± 0.1 µΩ/Ω | +4.06 µΩ/Ω, +0.091 µΩ/Ω/a | 6010D measurement vs MI 1kΩ, 0.316 mA | 16277 days |
This concludes benchmarks of this 1979 SR104. Temperature coefficient didn’t change since 1979 and resistance standard still demonstrate excellent performance with estimated long-term drift at +0.088 µΩ/Ω per year, well below factory specification from ESI. And finally updated label is printed for the lid with the current data, based on calibration results.
Stability study of SR104 and other resistance standards
Annual drift of this ESI SR104 will be known only after few years of continuous and periodic high end level calibration. Online EEVBlog and bbs.38hot.net forums member zlymex started very neat compilation of annual drift estimate chart on no less than 30 (!) ESI/Tegam SR104 standards:
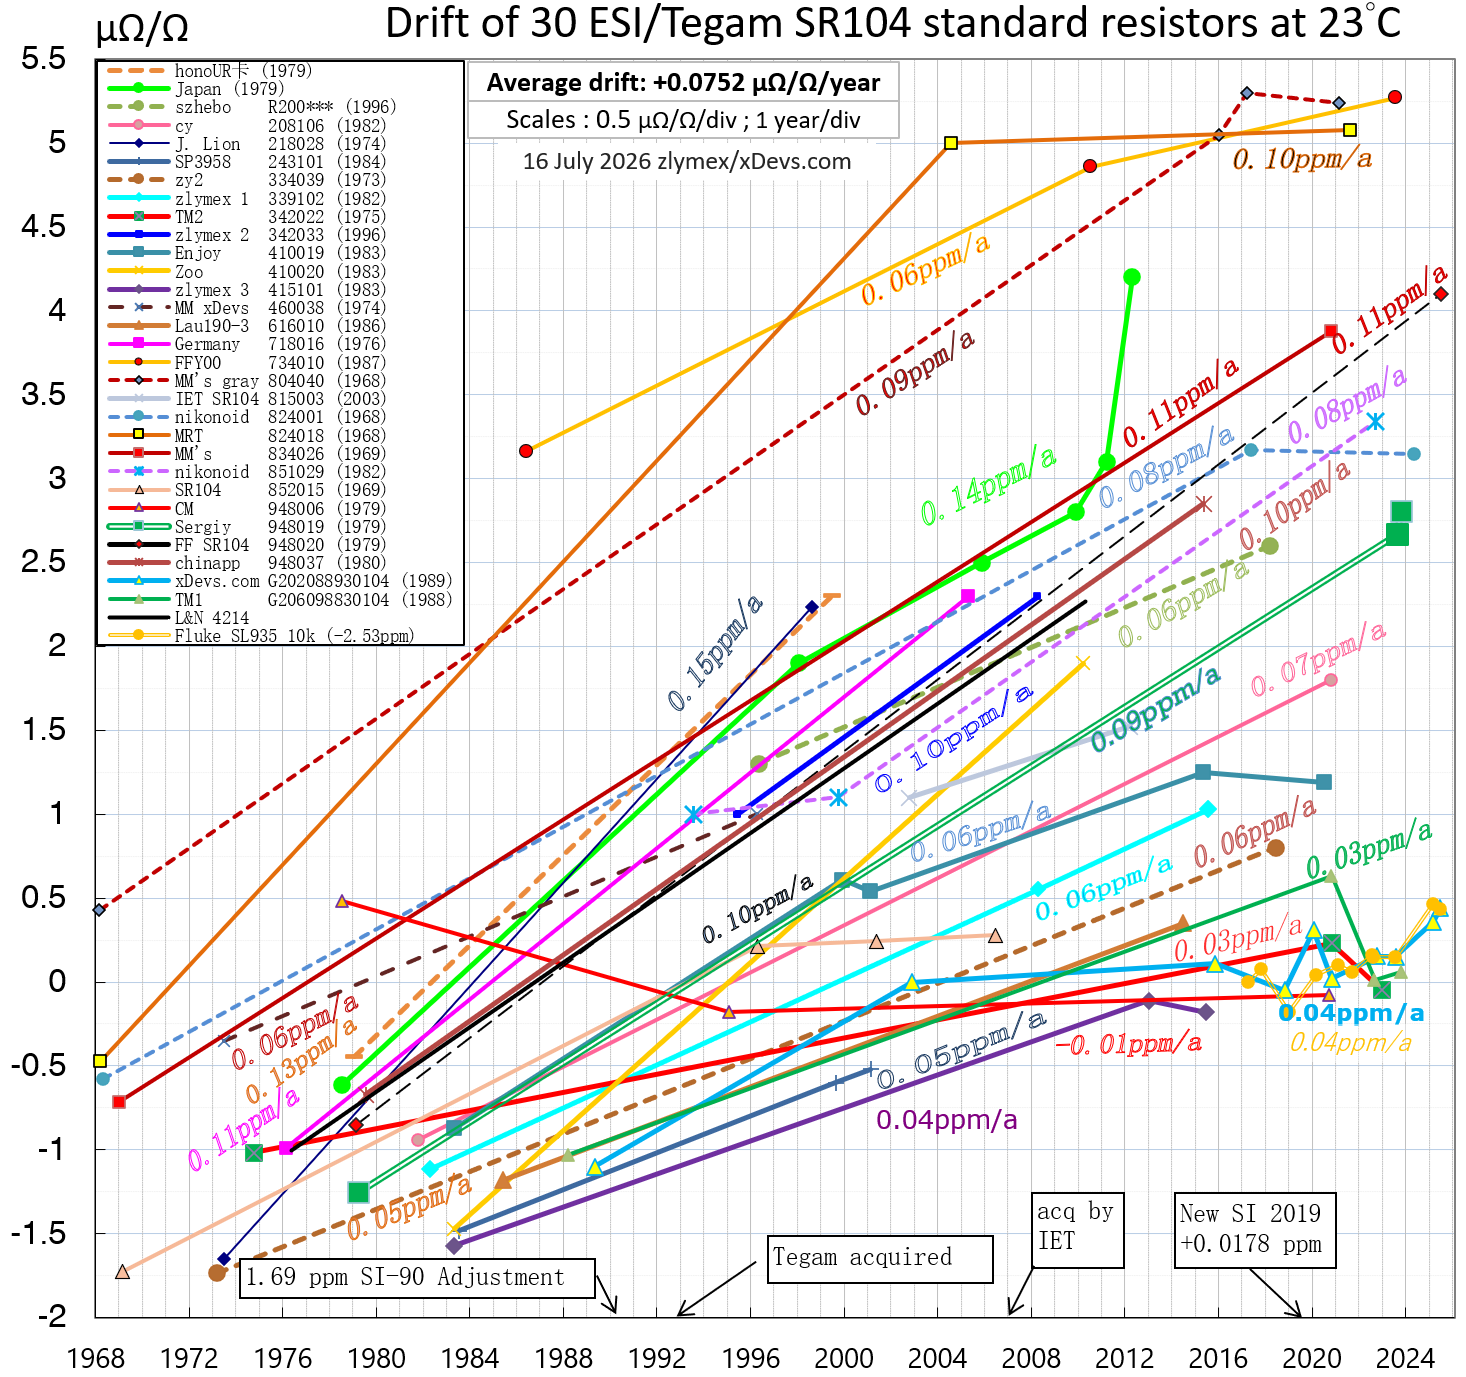
Image 83: Annual drift estimate of 30 pcs ESI SR104 as of July 2026. Compiled by zlymex and xDevs.com
Nearly all SR104 resistance standards show small positive drift over the years with total average annual rate about +0.075 µΩ/&Omega across all of them combined. Perhaps some day we can add IET-made redesigned SR104 into the chart just as well.
Handles replacement
Nikonoid provided this valuable information about possible handle replacements for old SR104 units that got original handles missing or damaged. While SR-104 is still one of the best standard resistors ever produced, many of them are decades old and handles on them do not age as well as resistors themselves.
A close matching replacement handle is available from Keystone as part 8351 – Retractable handle.
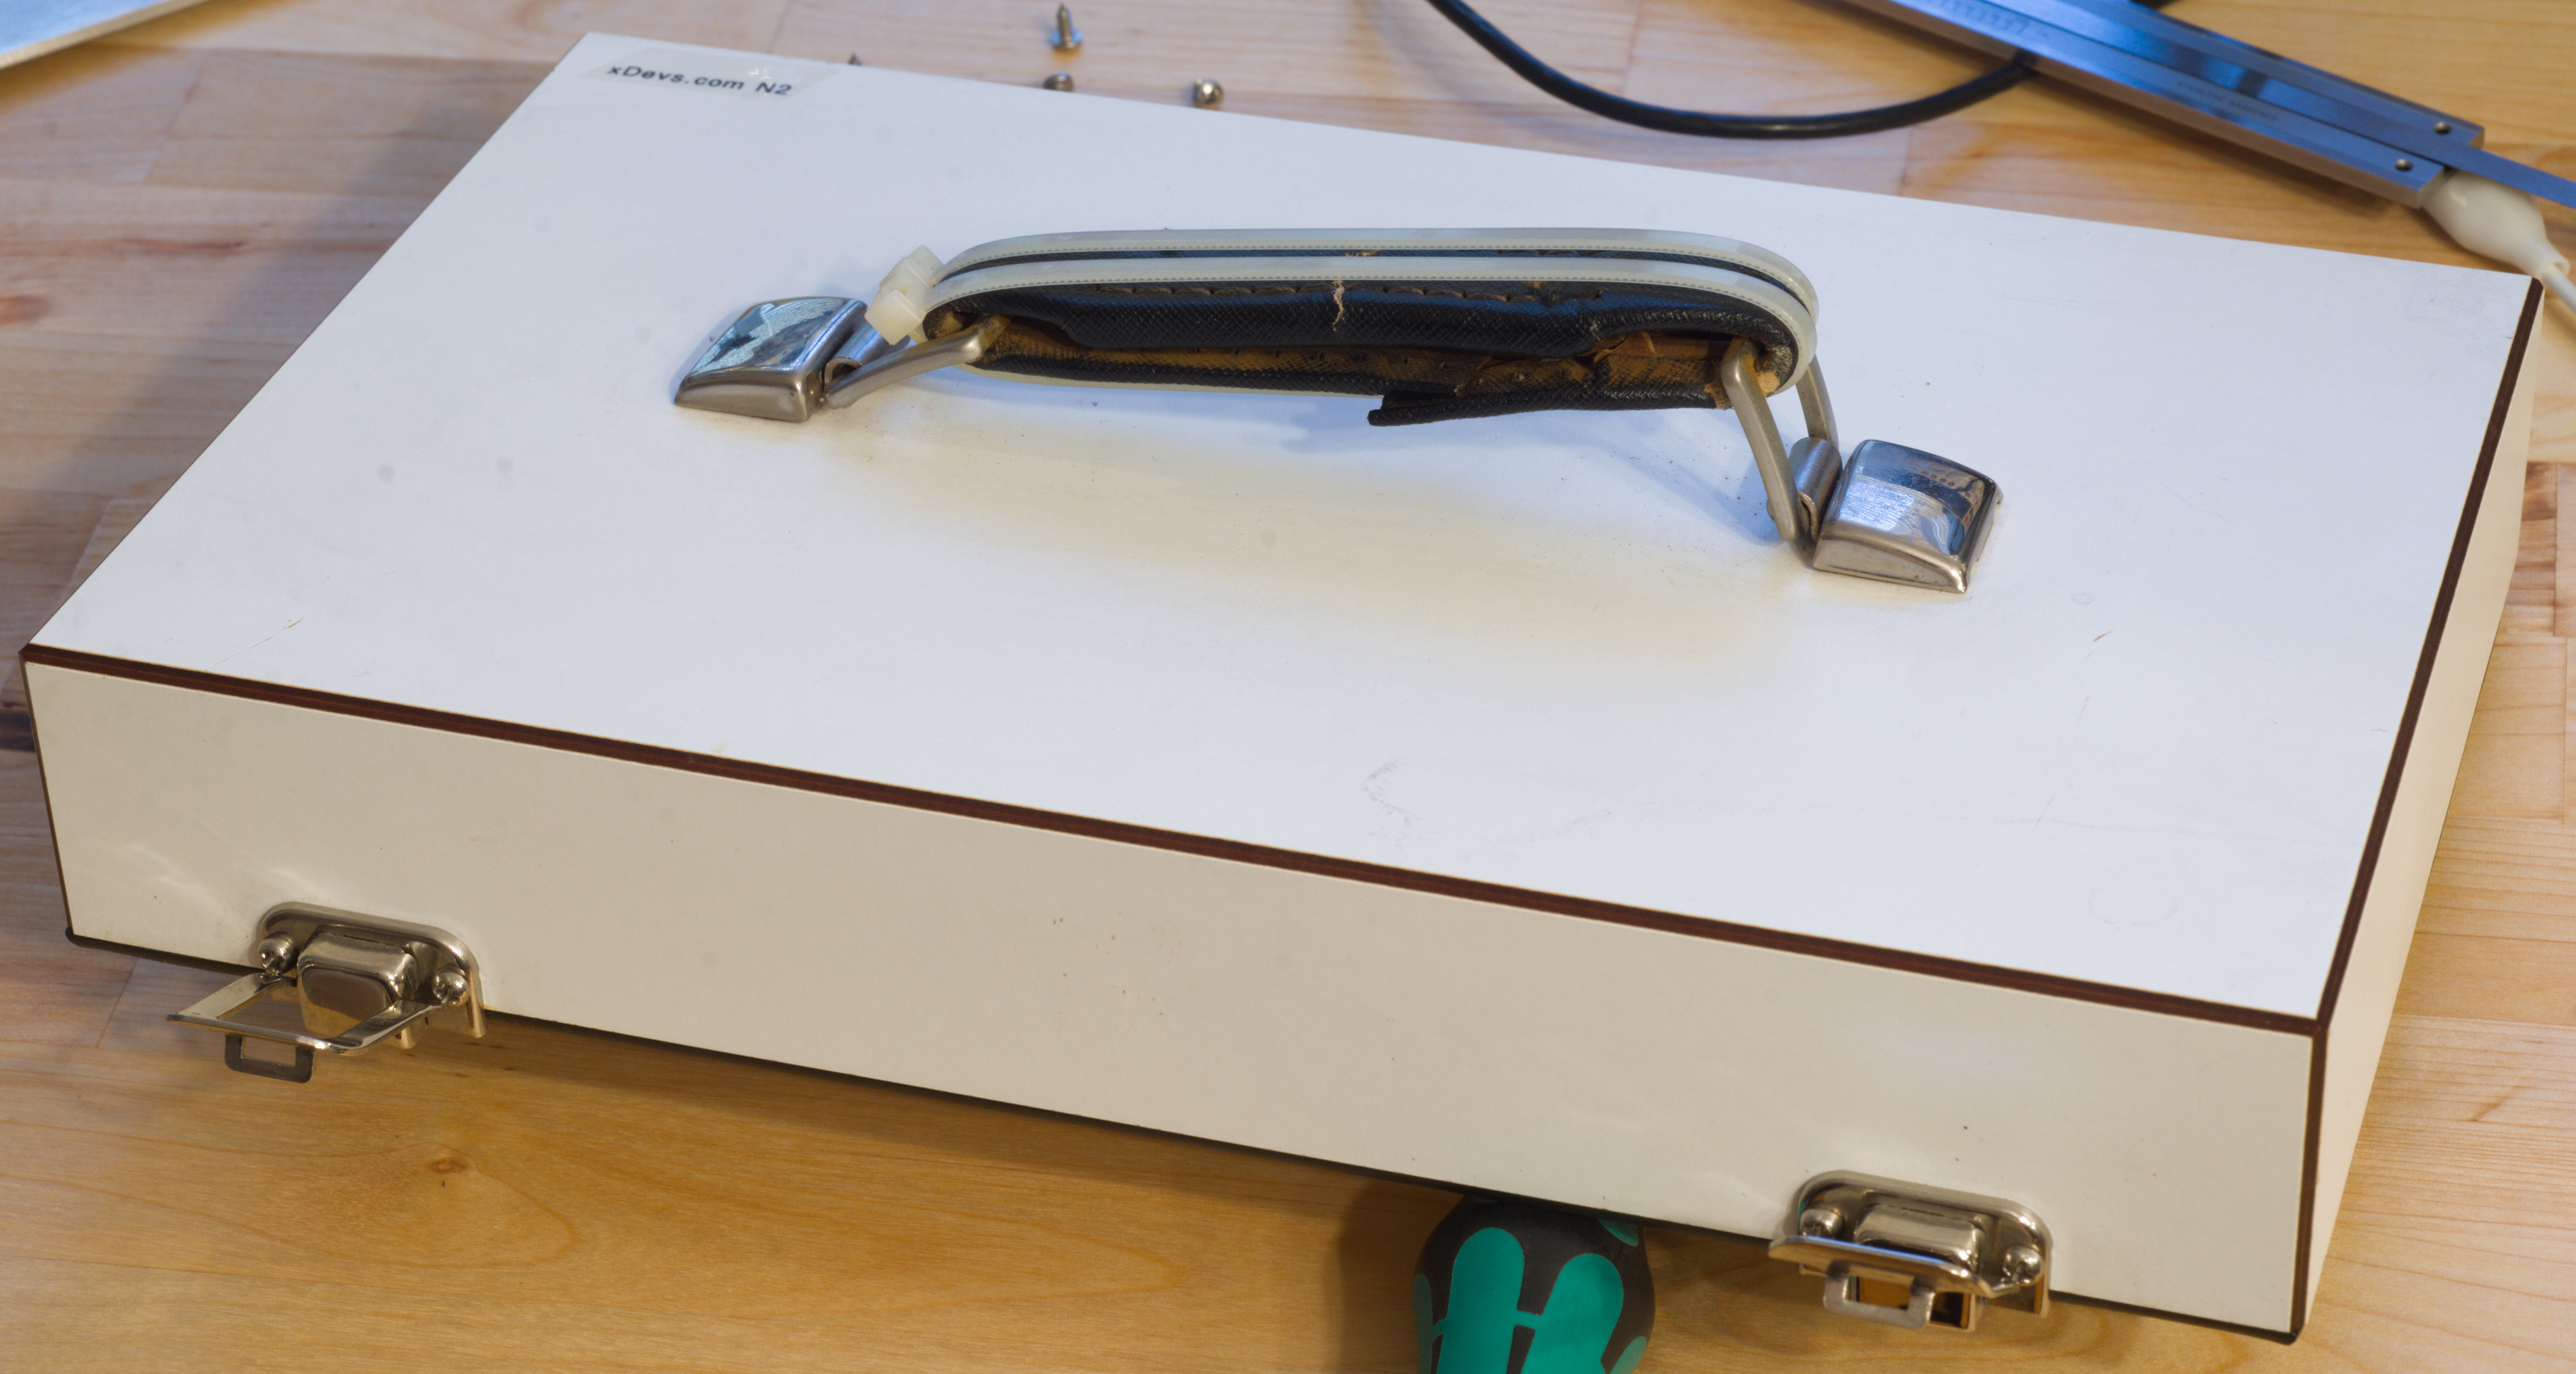
Image 84. Old handle in need of replacement, already doctored with zip-ties
To remove the handle, the clear plastic covering certificate and certificate insert needs to be removed first.
![]()
Image 85. Acrylic sheet with certificate removed, reveals nuts for handle mounts
Then use a plastic card and small screwdriver to carefully pry both metal clasps off, like in photos:
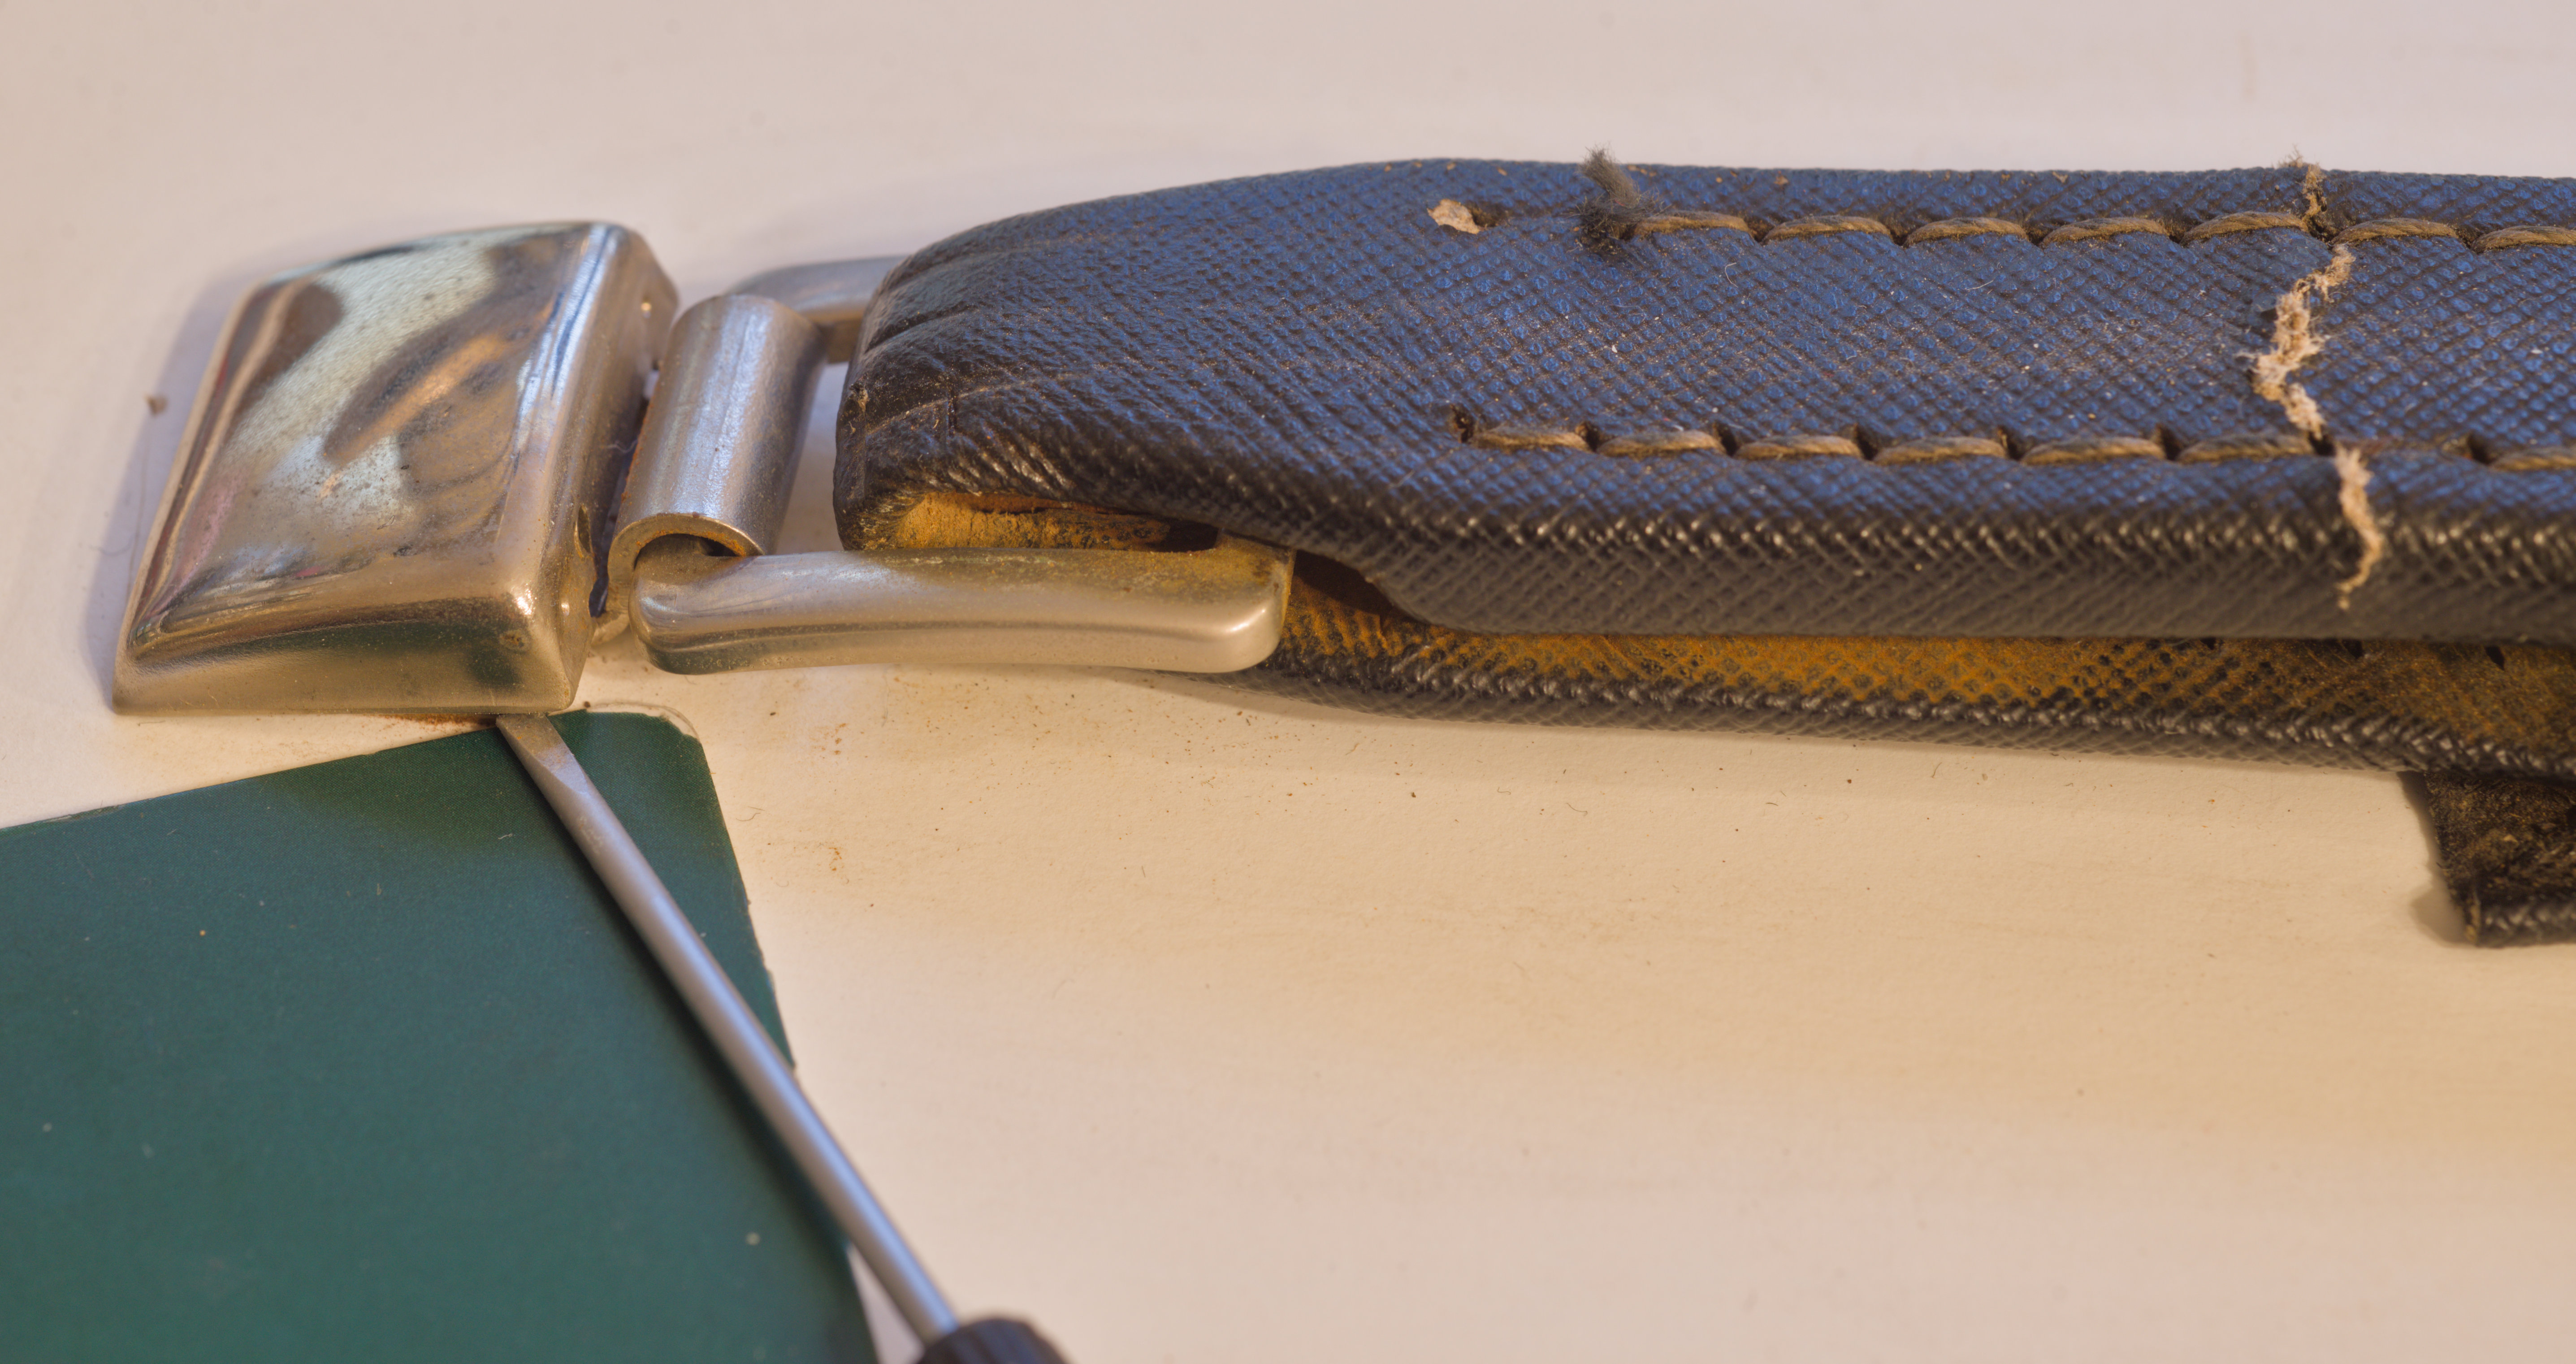
Image 86. Removing decorative cups with screwdriver
You might need a sheet of grippy rubber to hold on to nuts, as you are unscrewing the bolts holding the handle.
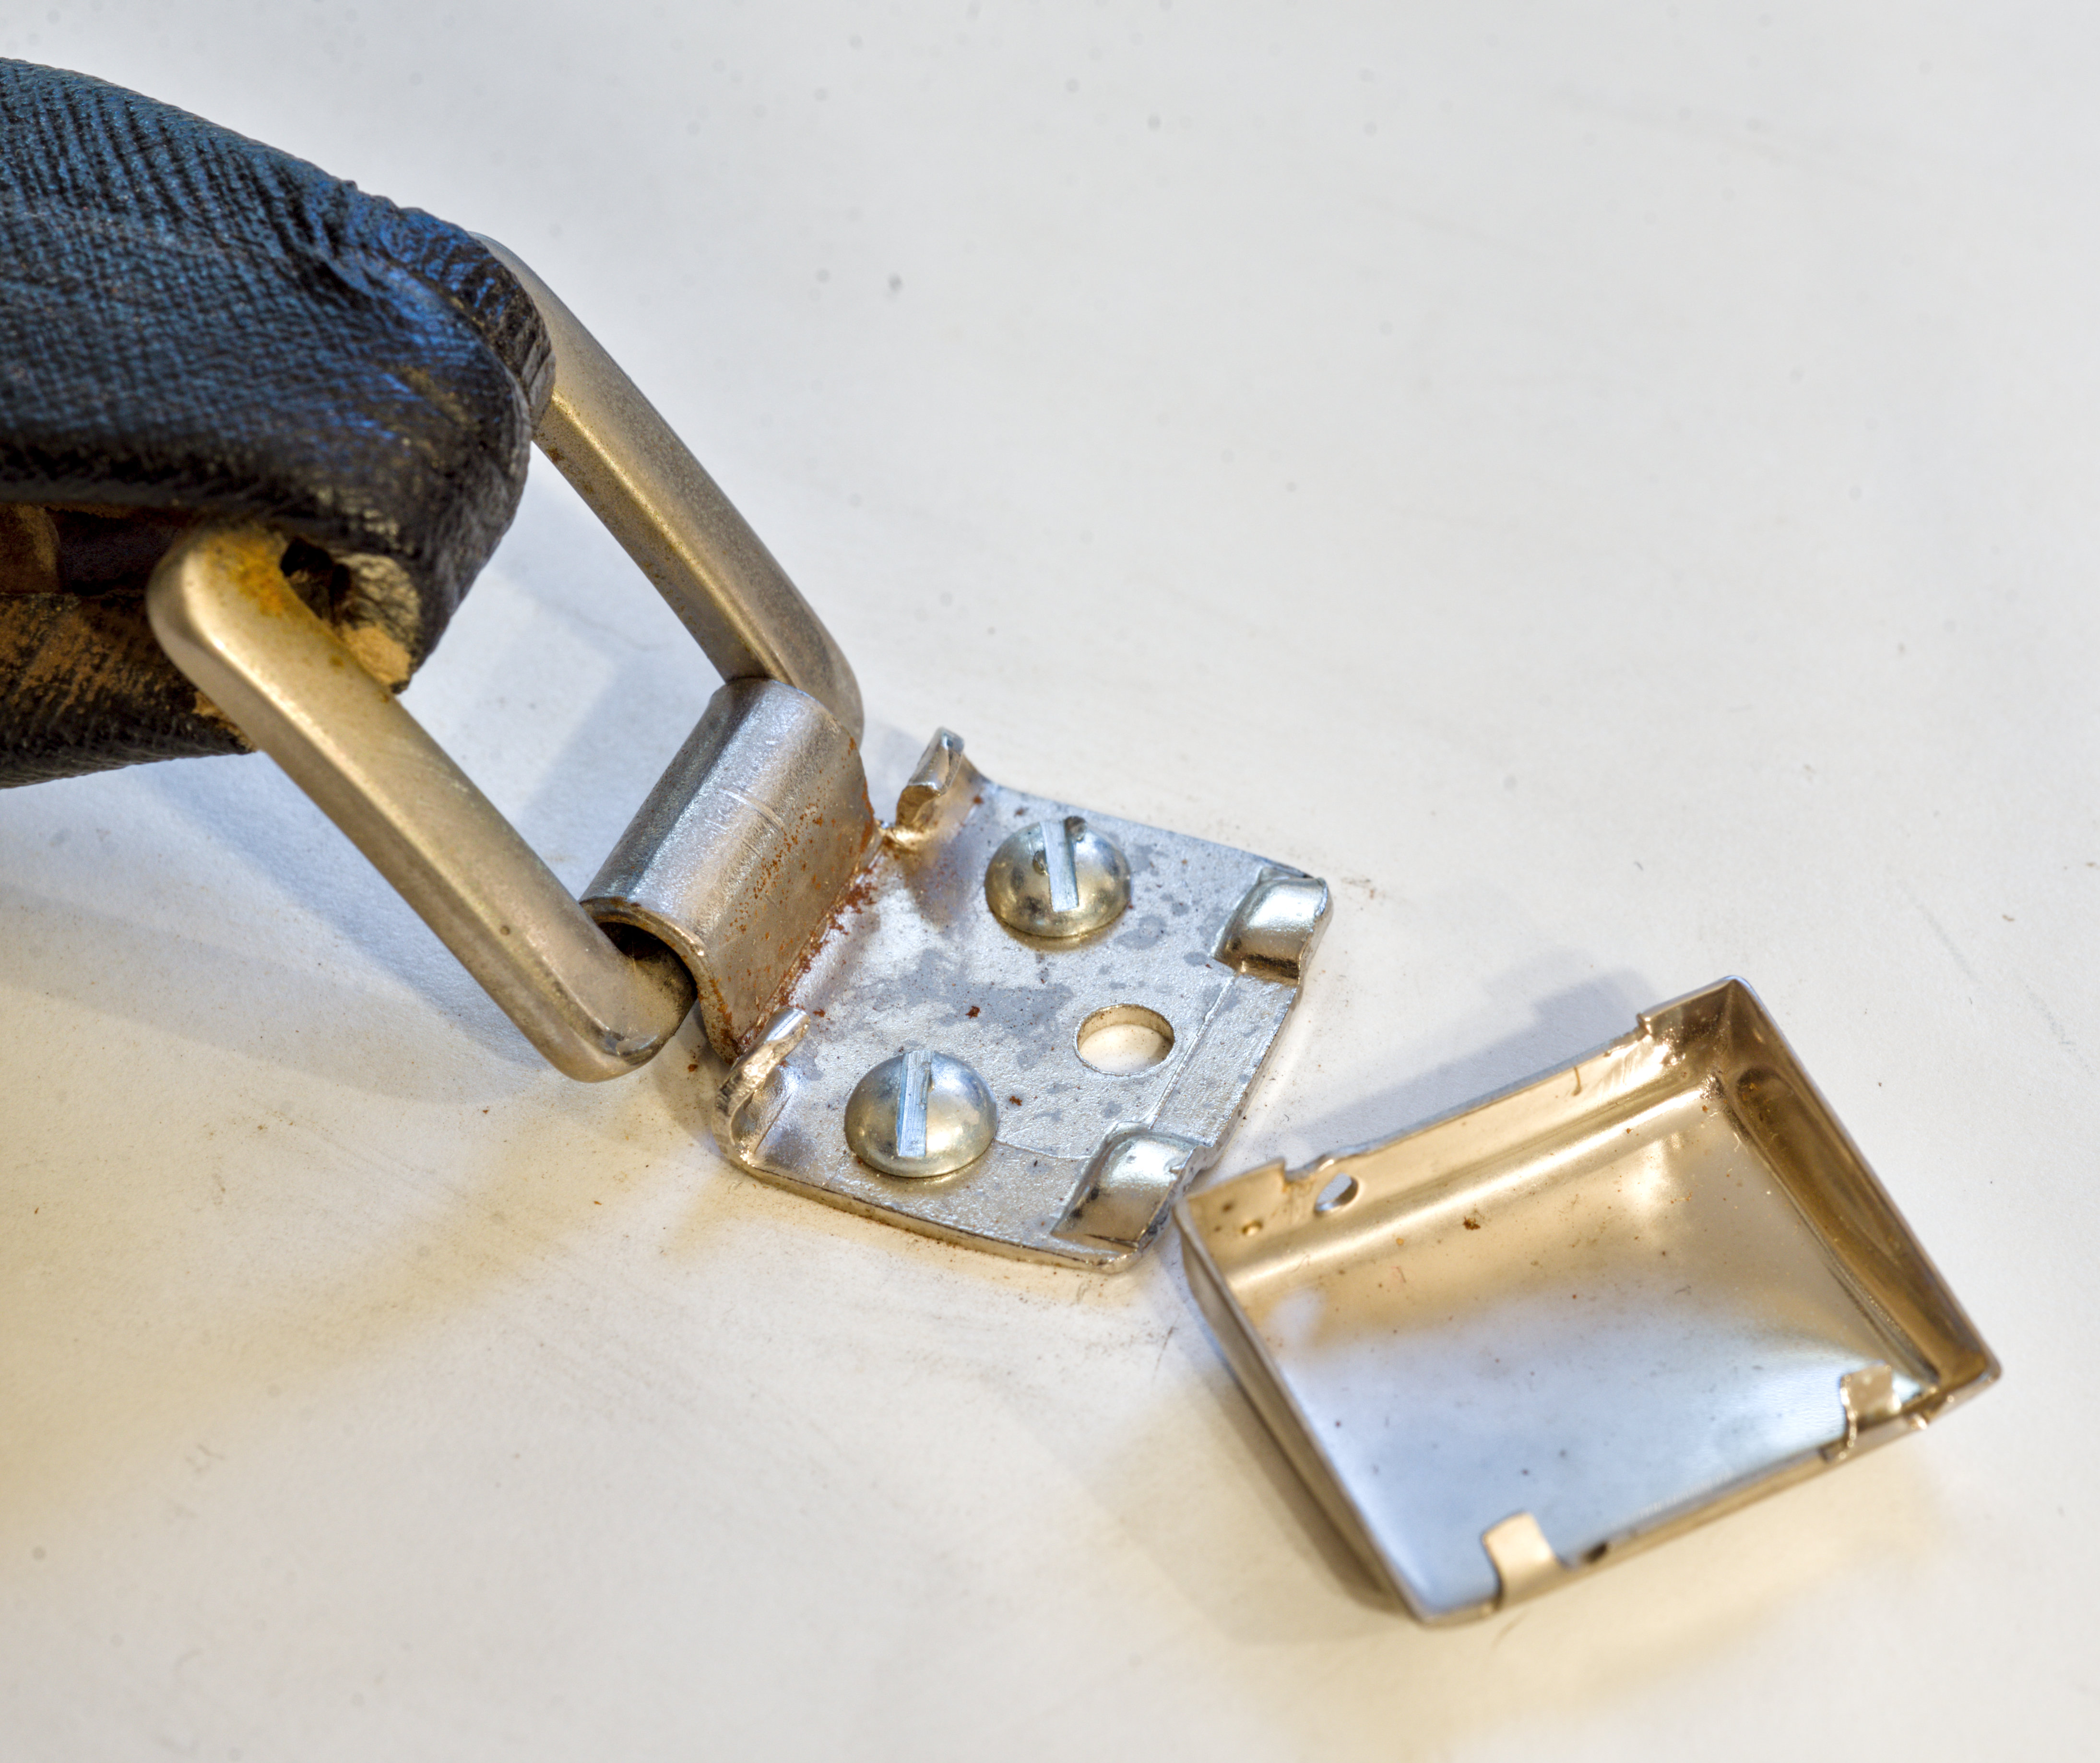
Image 87. Mount bolts
The holes for the nuts are precision made and there is no room for a nut driver or a wrench.
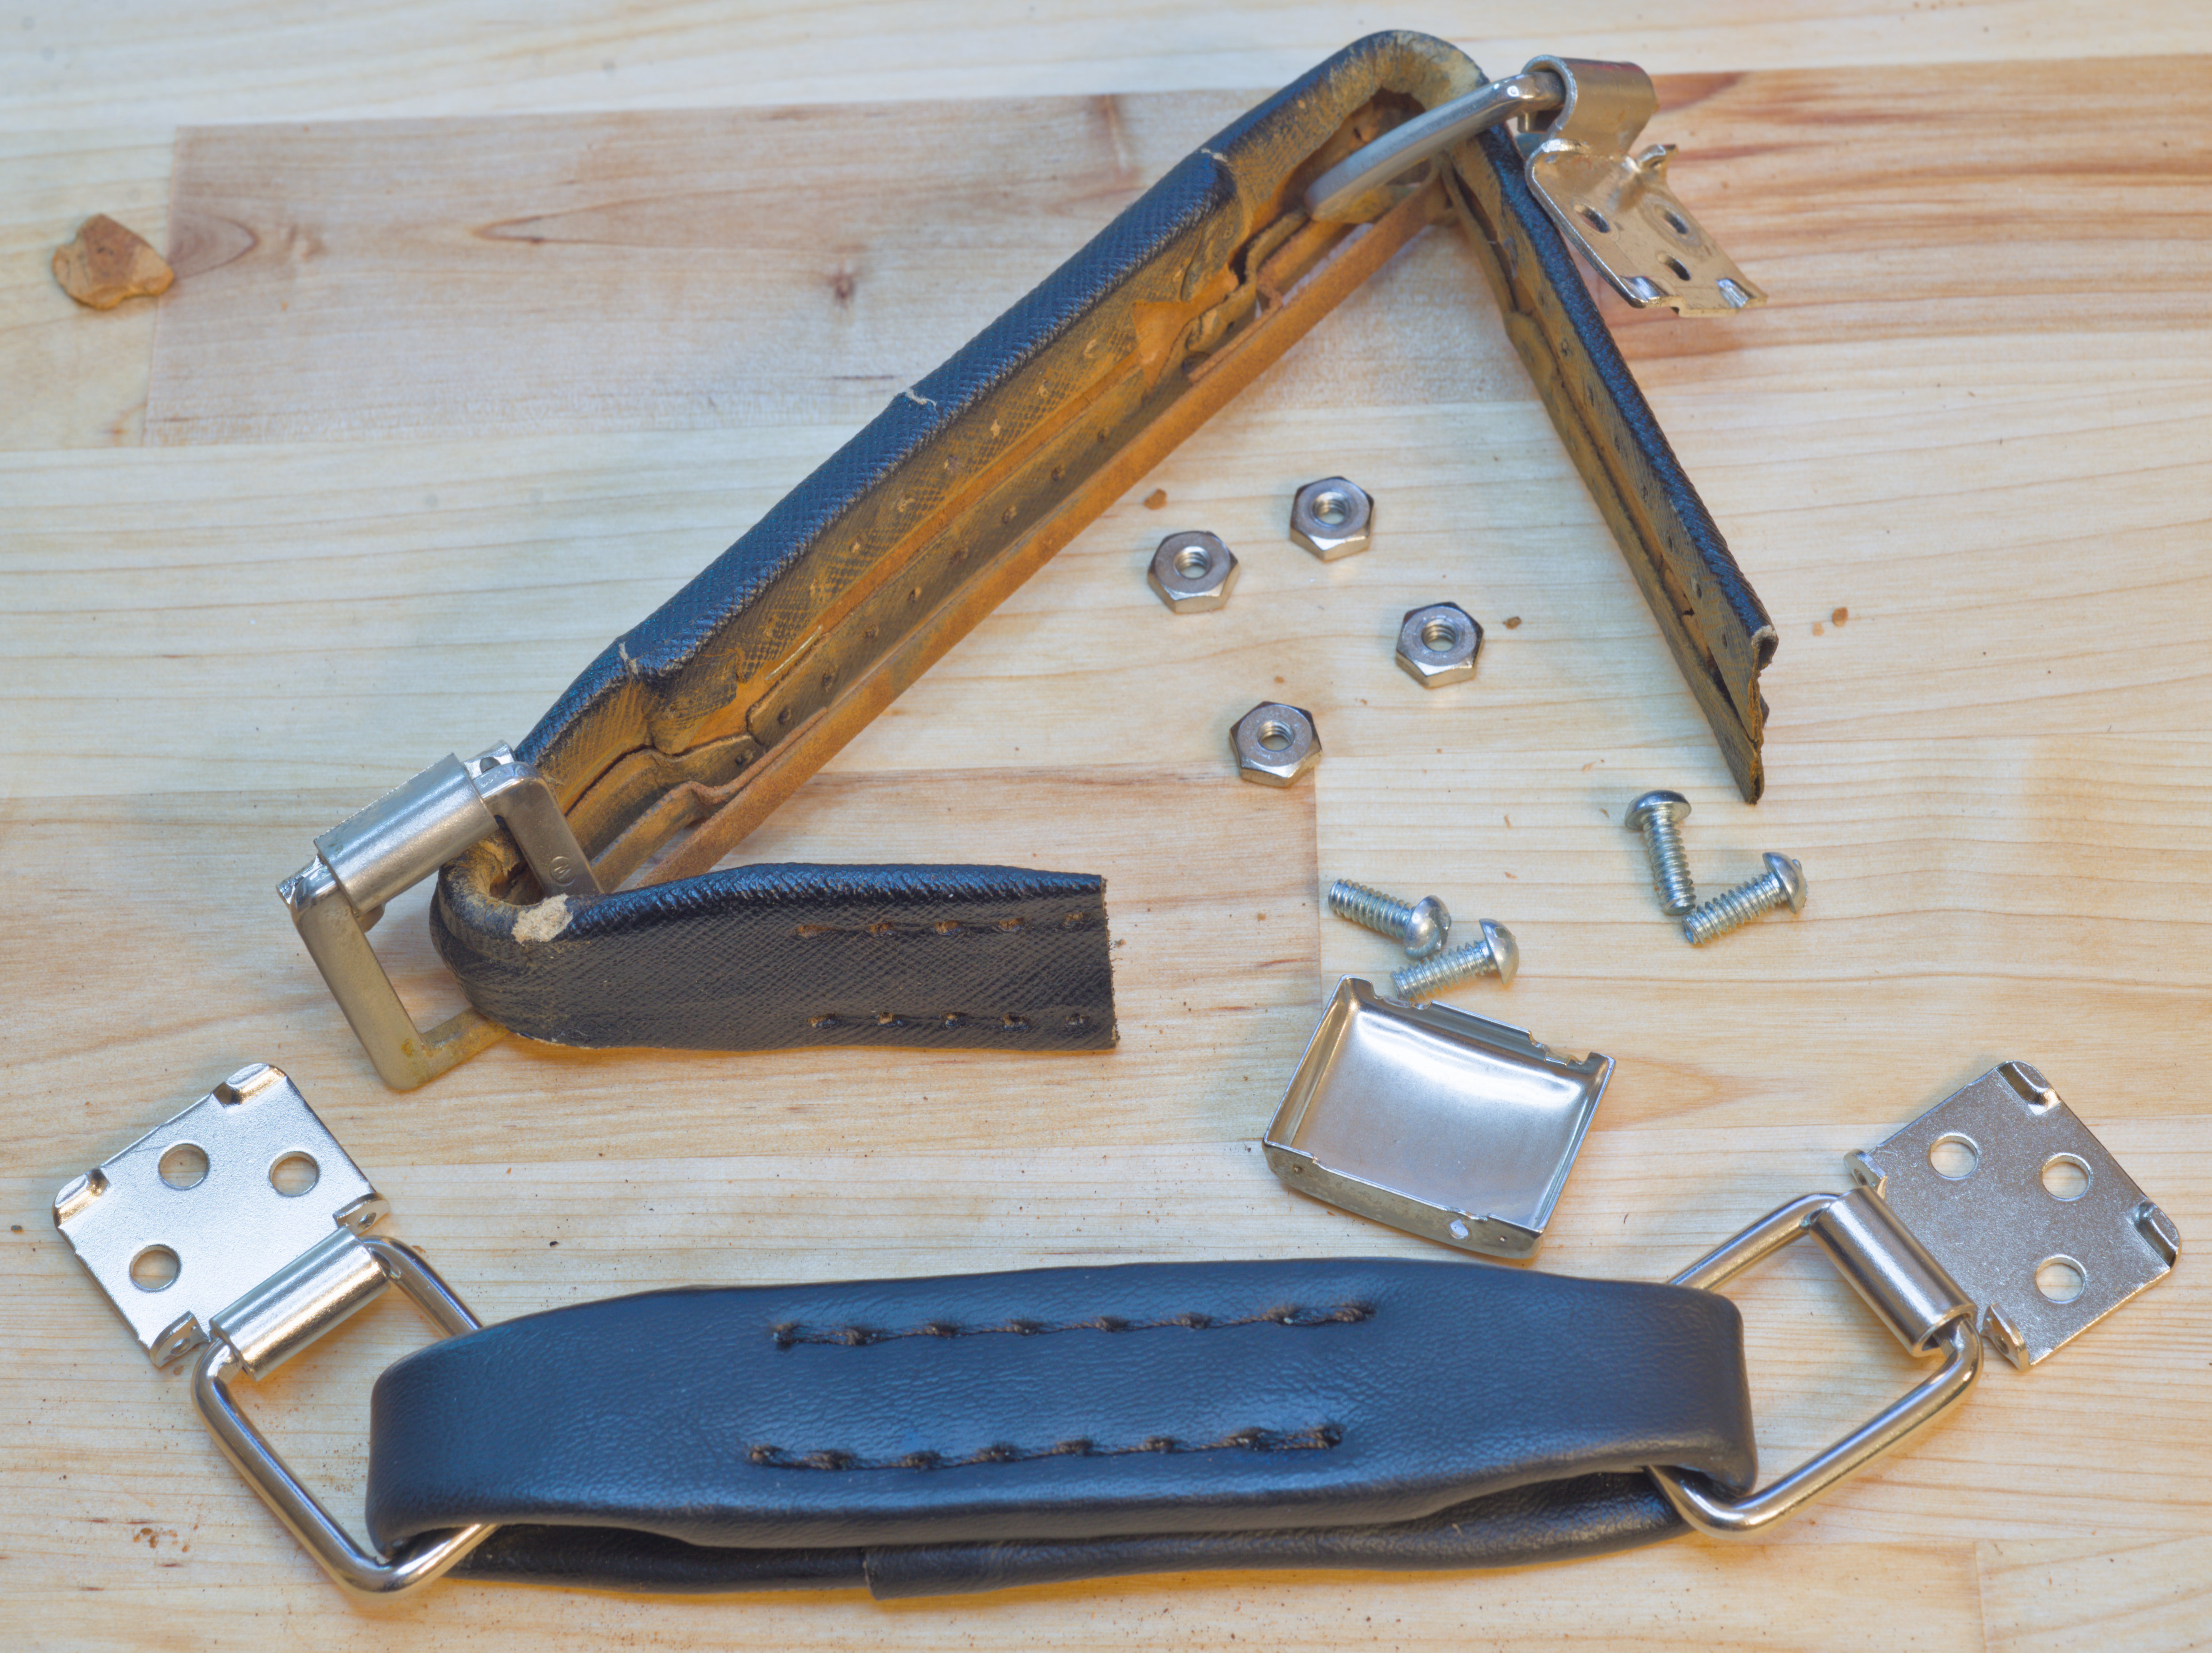
Image 88. Removed handle and new one ready
Here is the old hardware once disassembled.
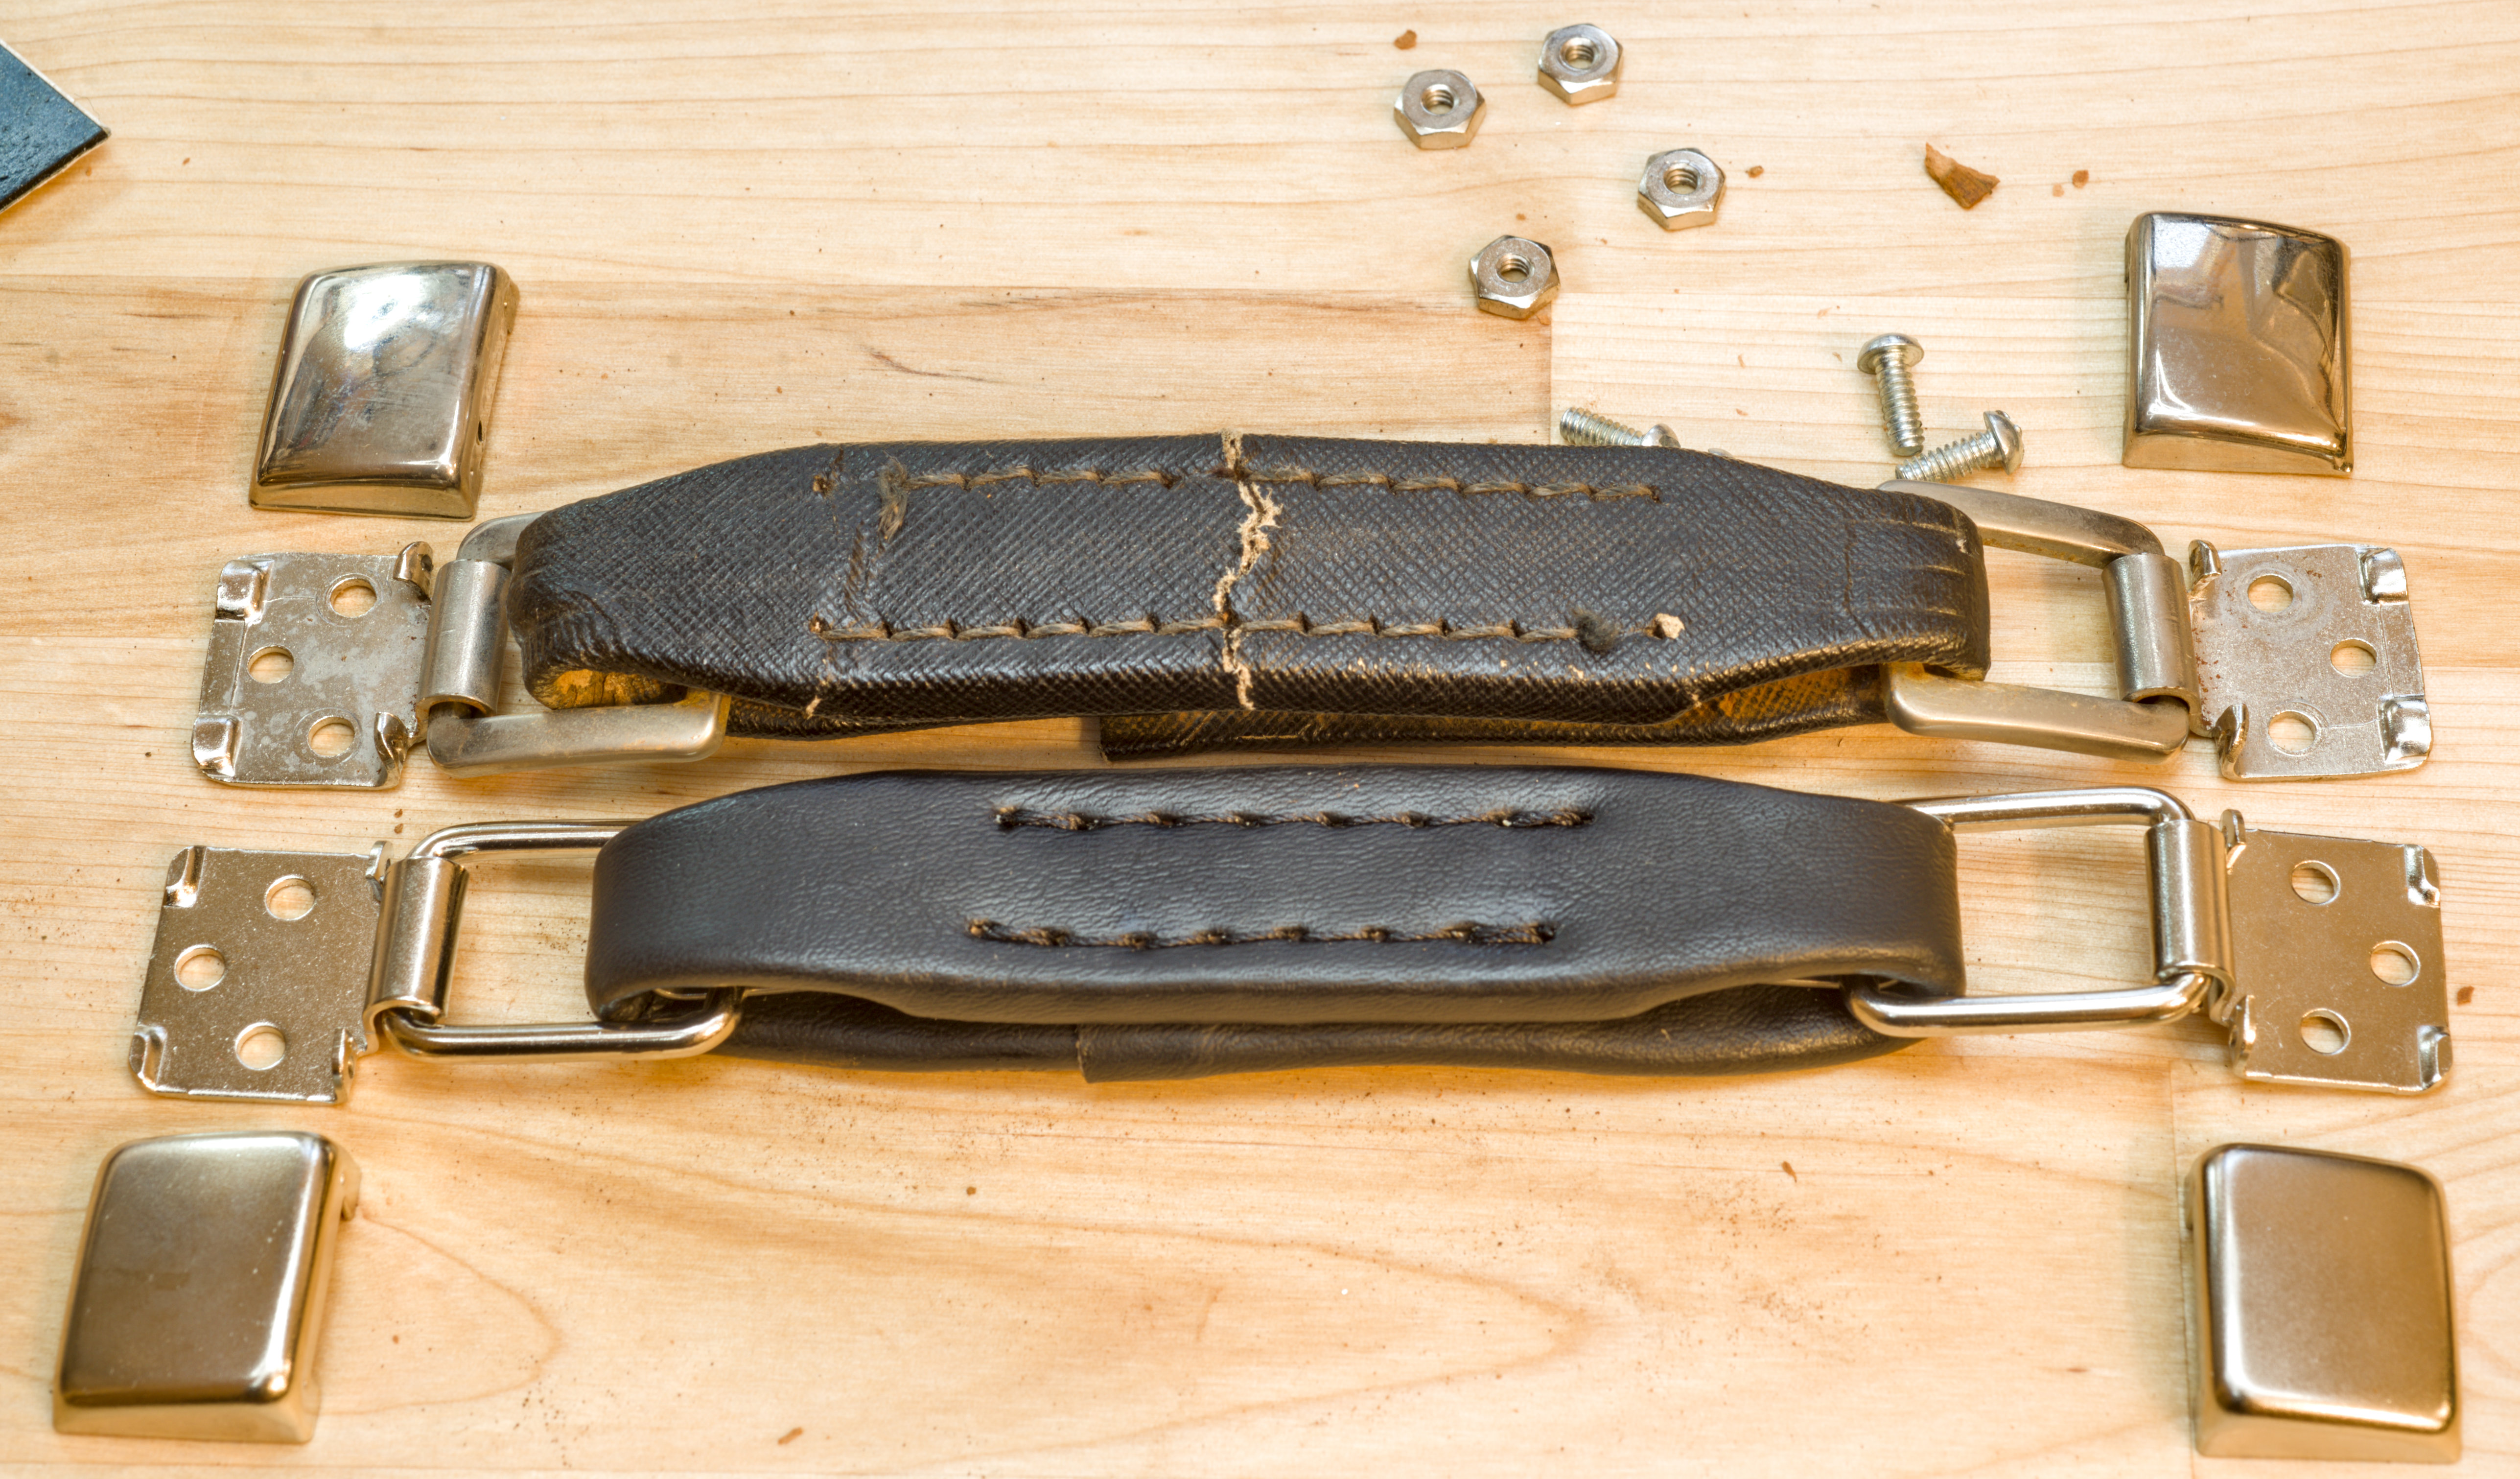
Image 89. All the hardware together
Old handle to new handle comparison. While the new handle is completely compatible with existing holes and bolts, it is a bit different. With new handle installed:
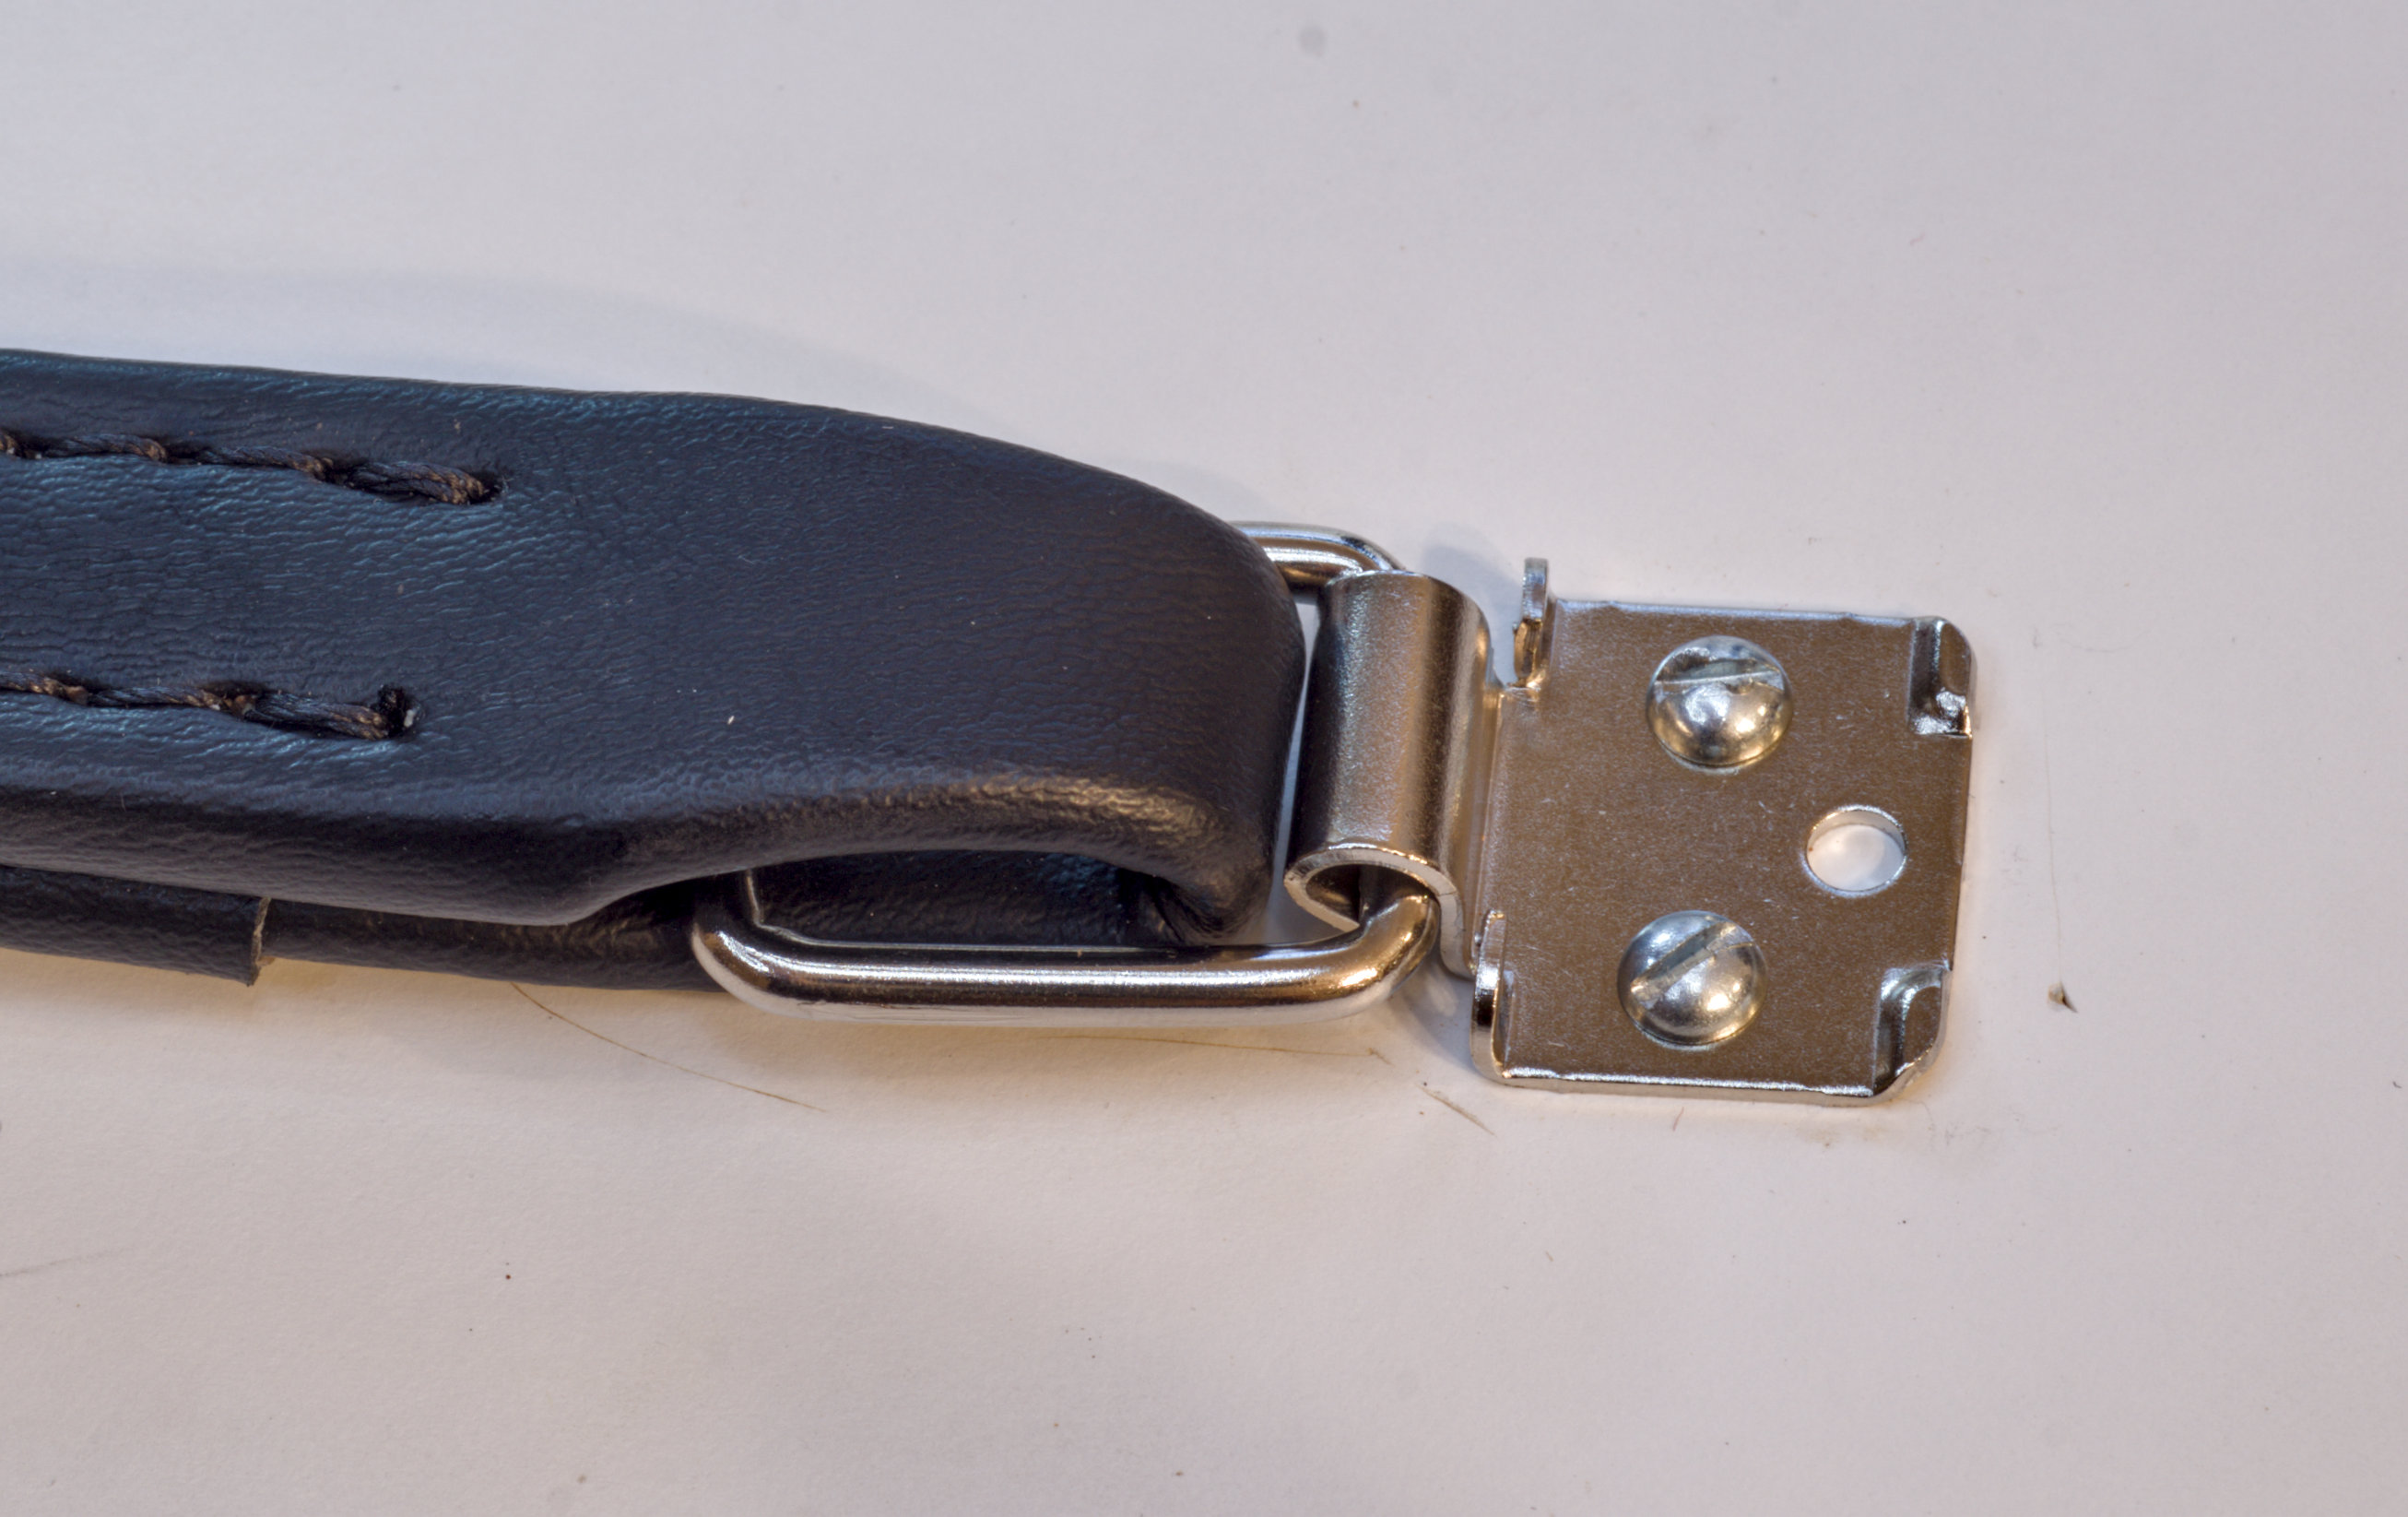
Image 90. Mounted new handle
Both new and old handles have the metal spring on the inside to reinforce it.
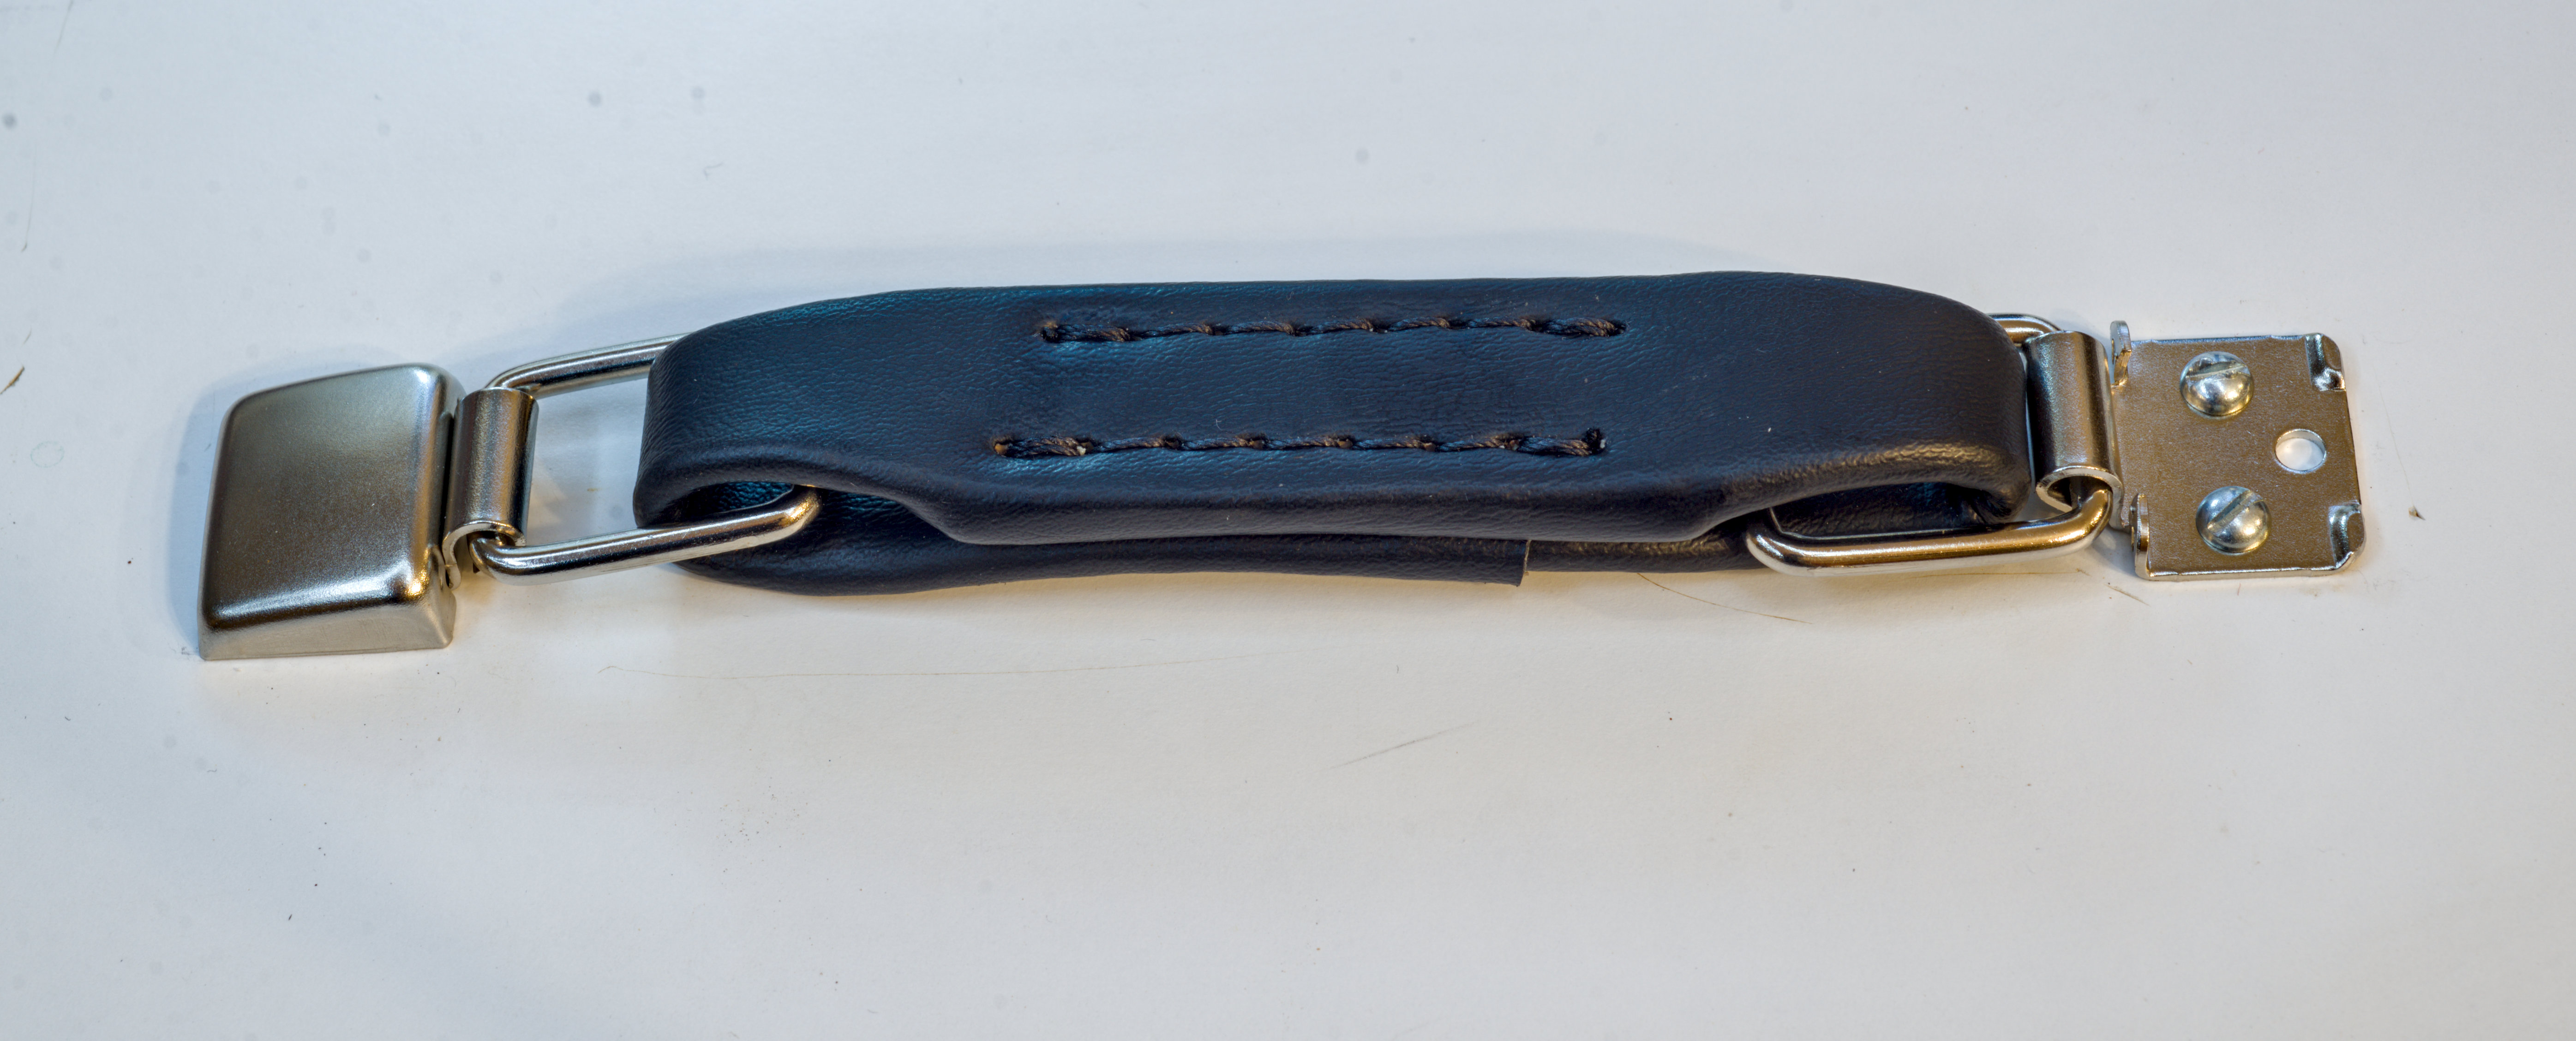
Image 91. New handle in place
Reinstall the certificate after the handle is replaced:
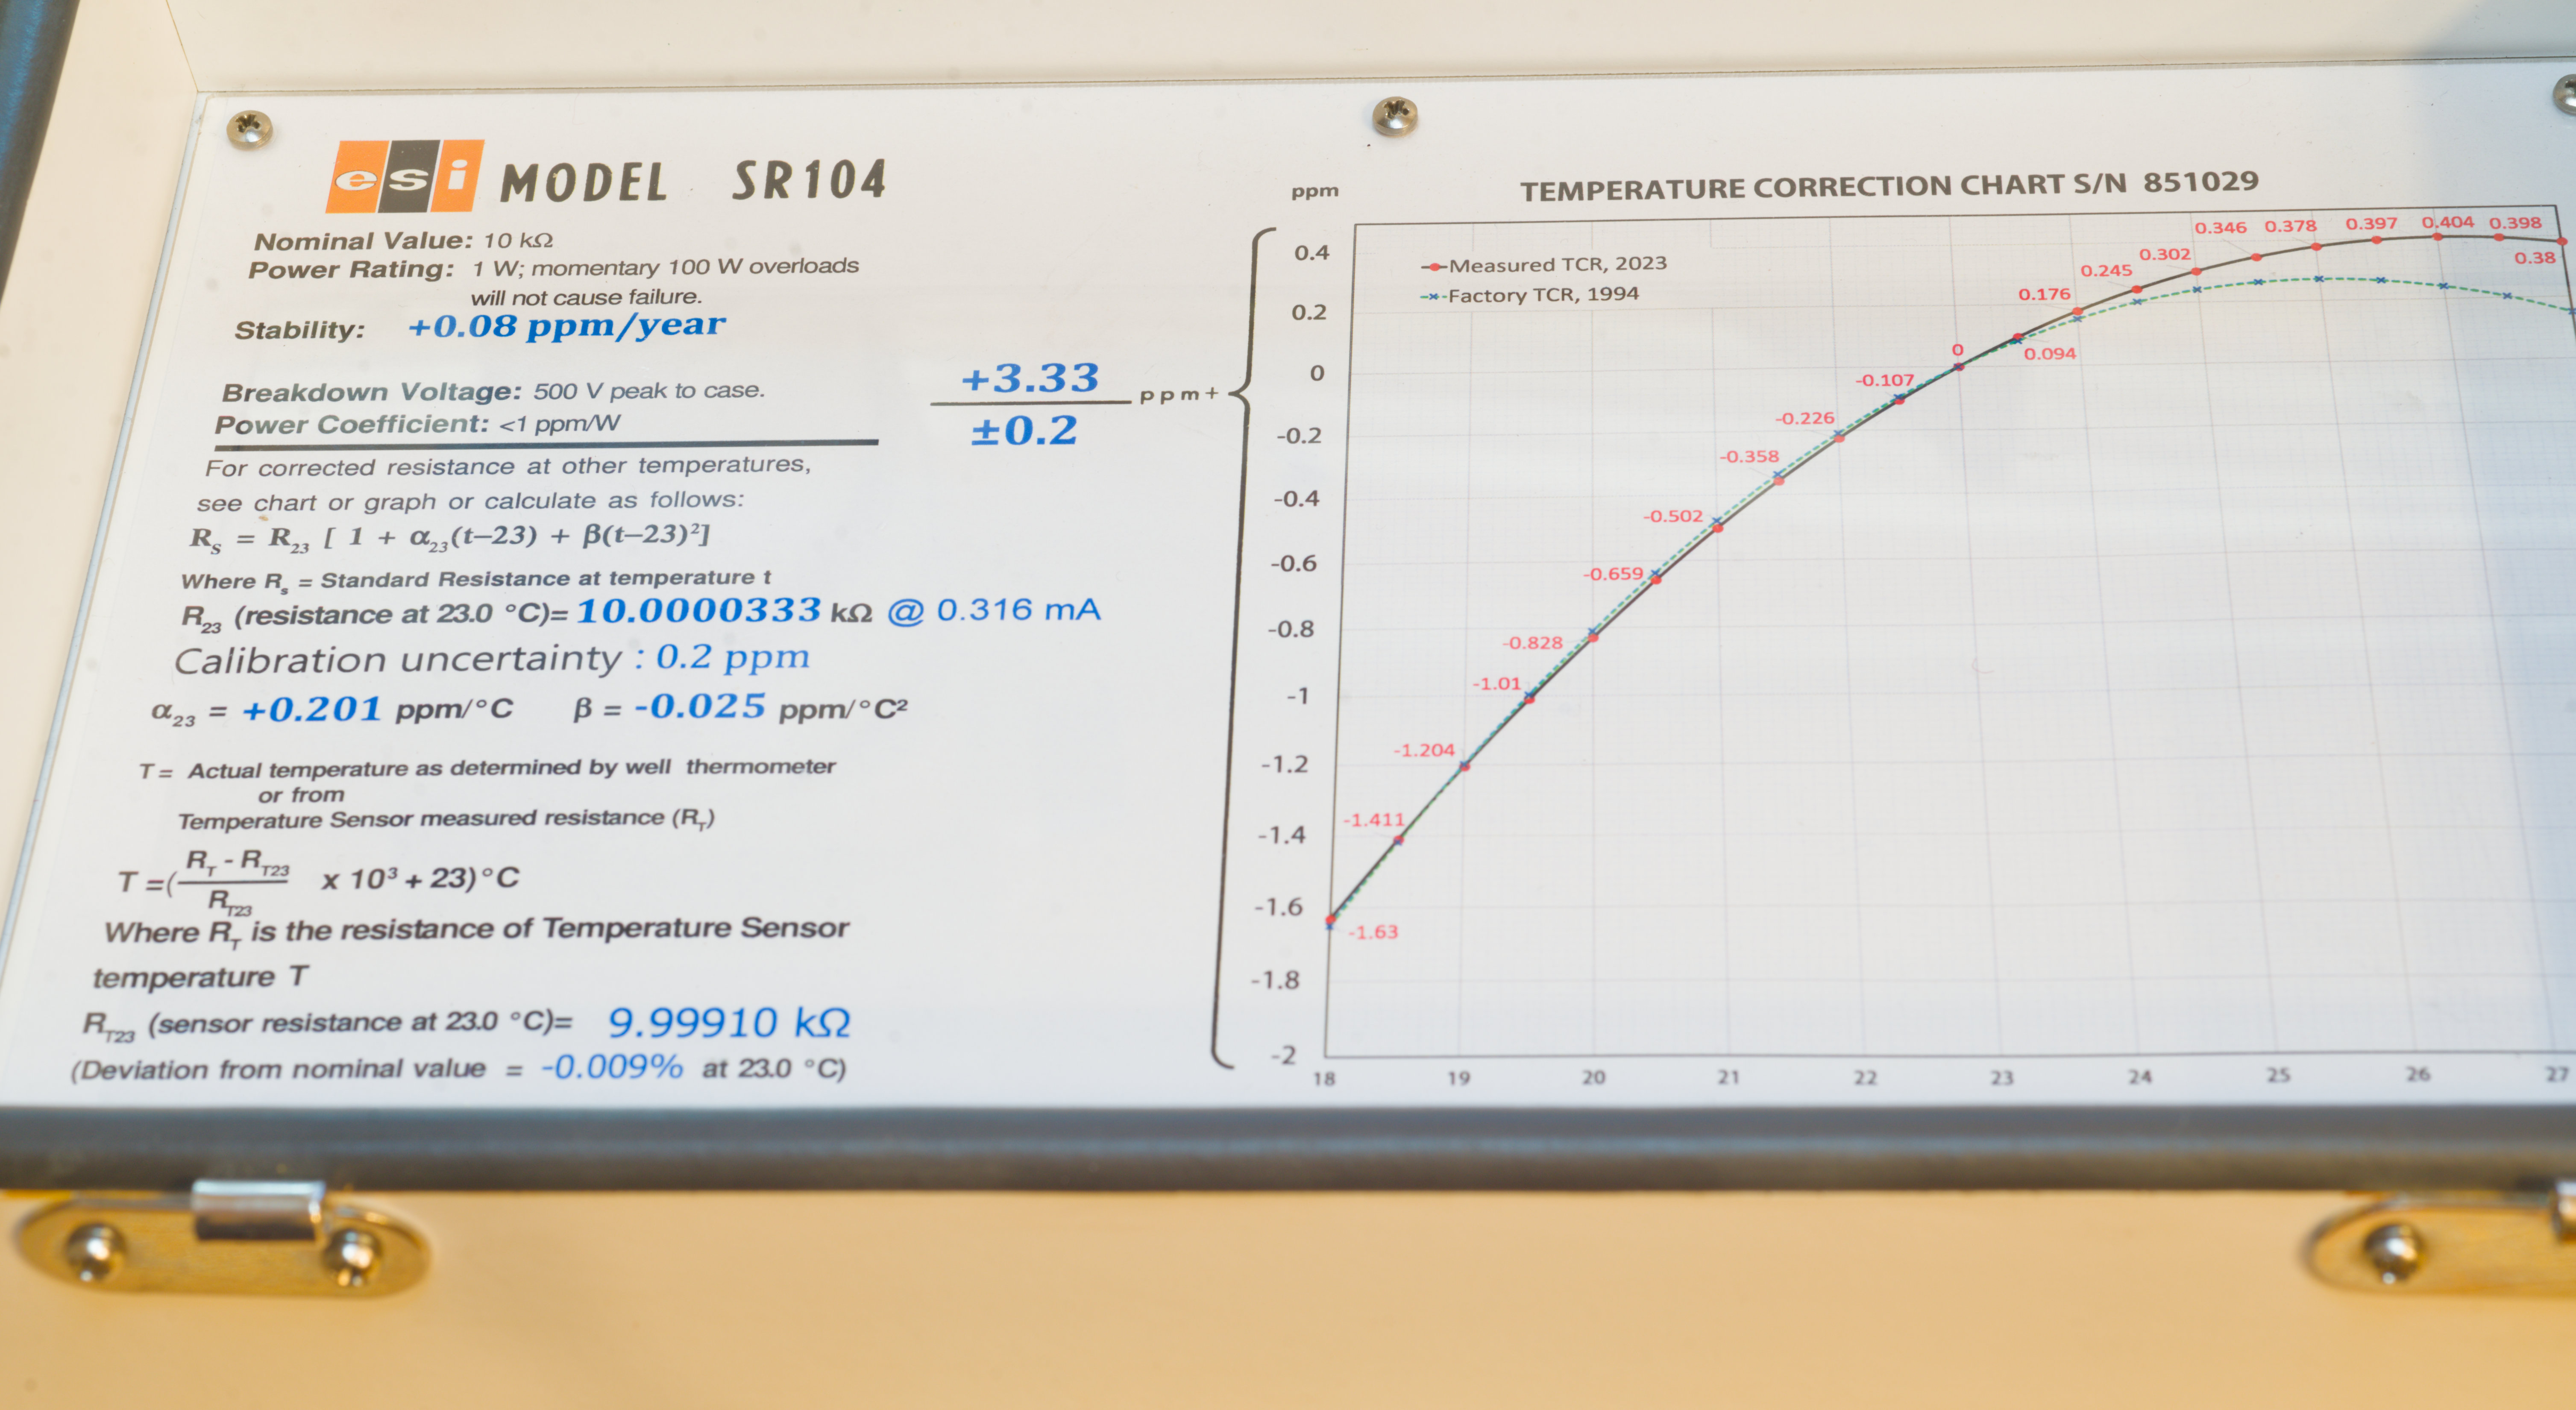
Image 92. Certificate renewed and printed with actual data
While handles are almost identical, the new handle is a few millimeters taller:
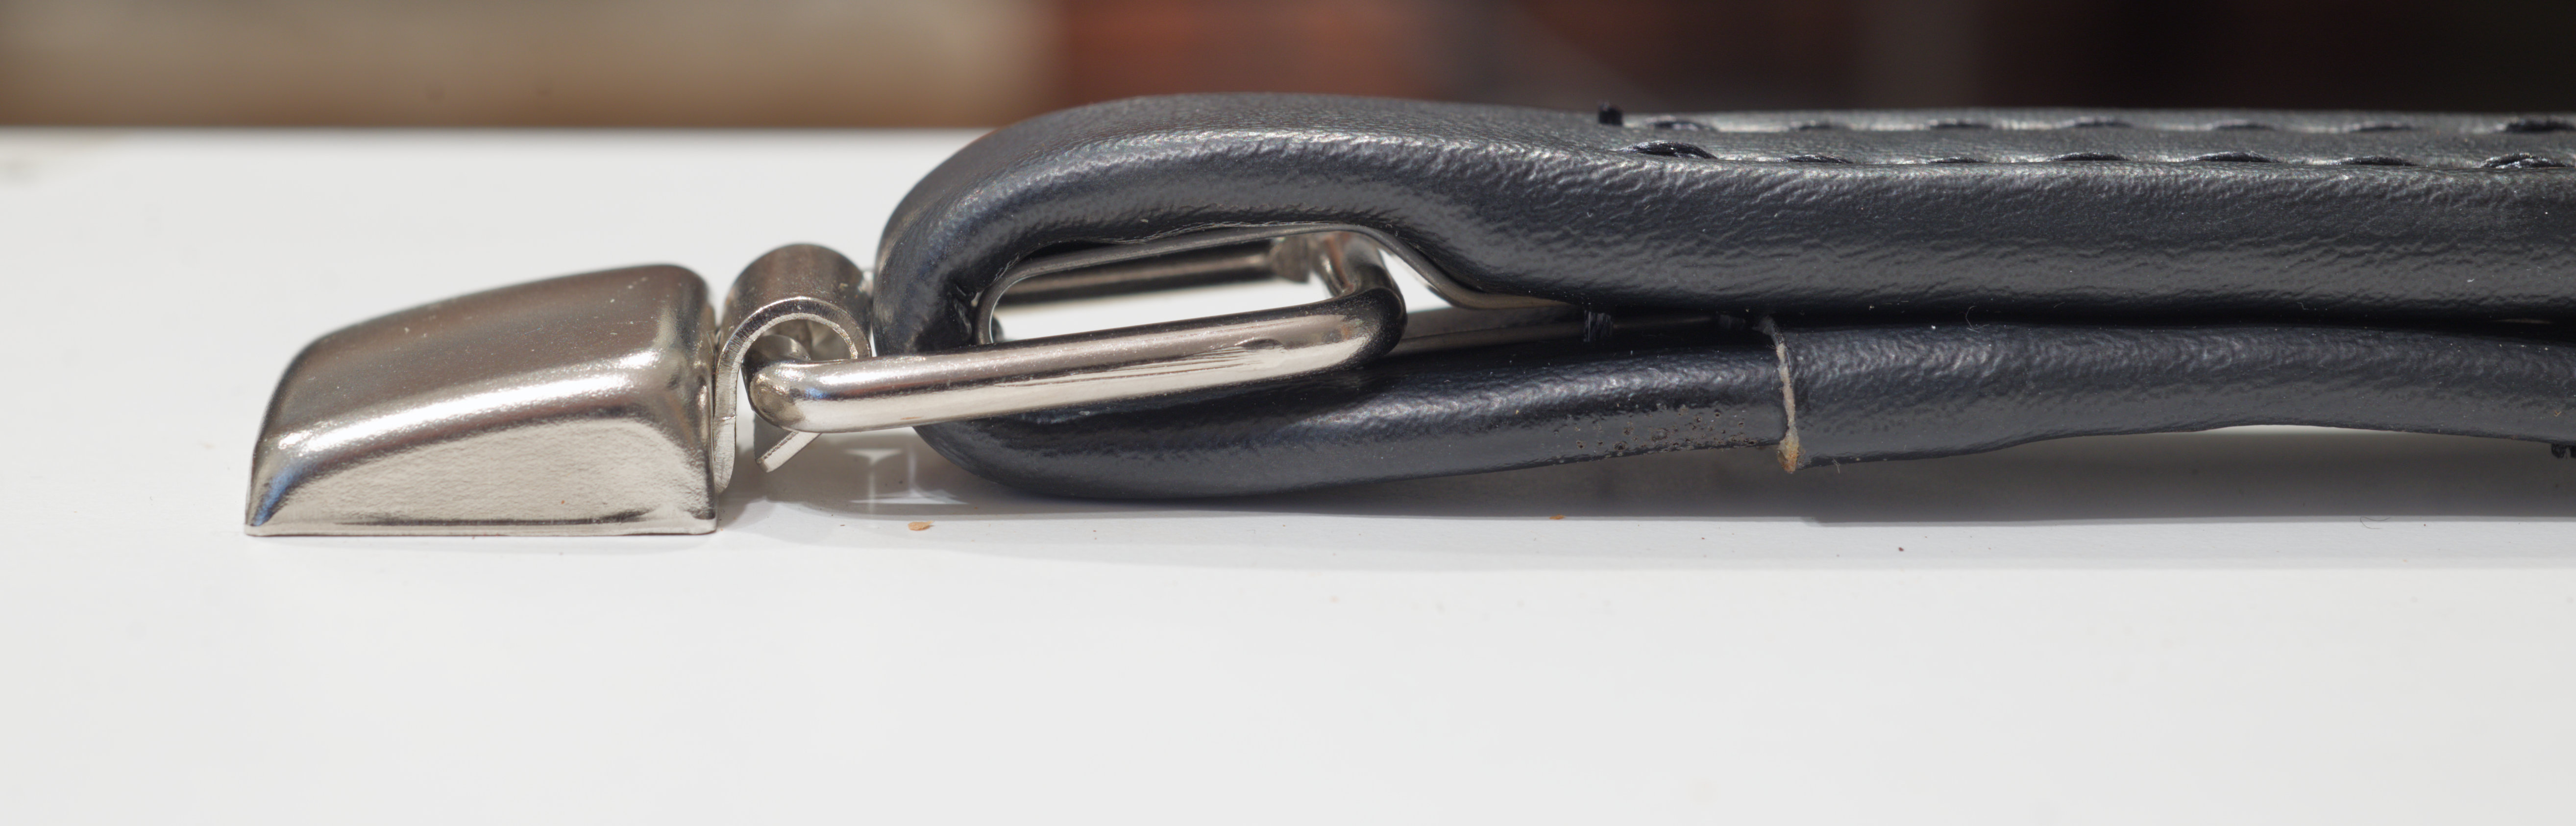
Image 93. Handle height difference
This means that SR-104s resistors with new handles are no longer stackable on the top of each other. However, this is only relevant to people keeping multiples :)
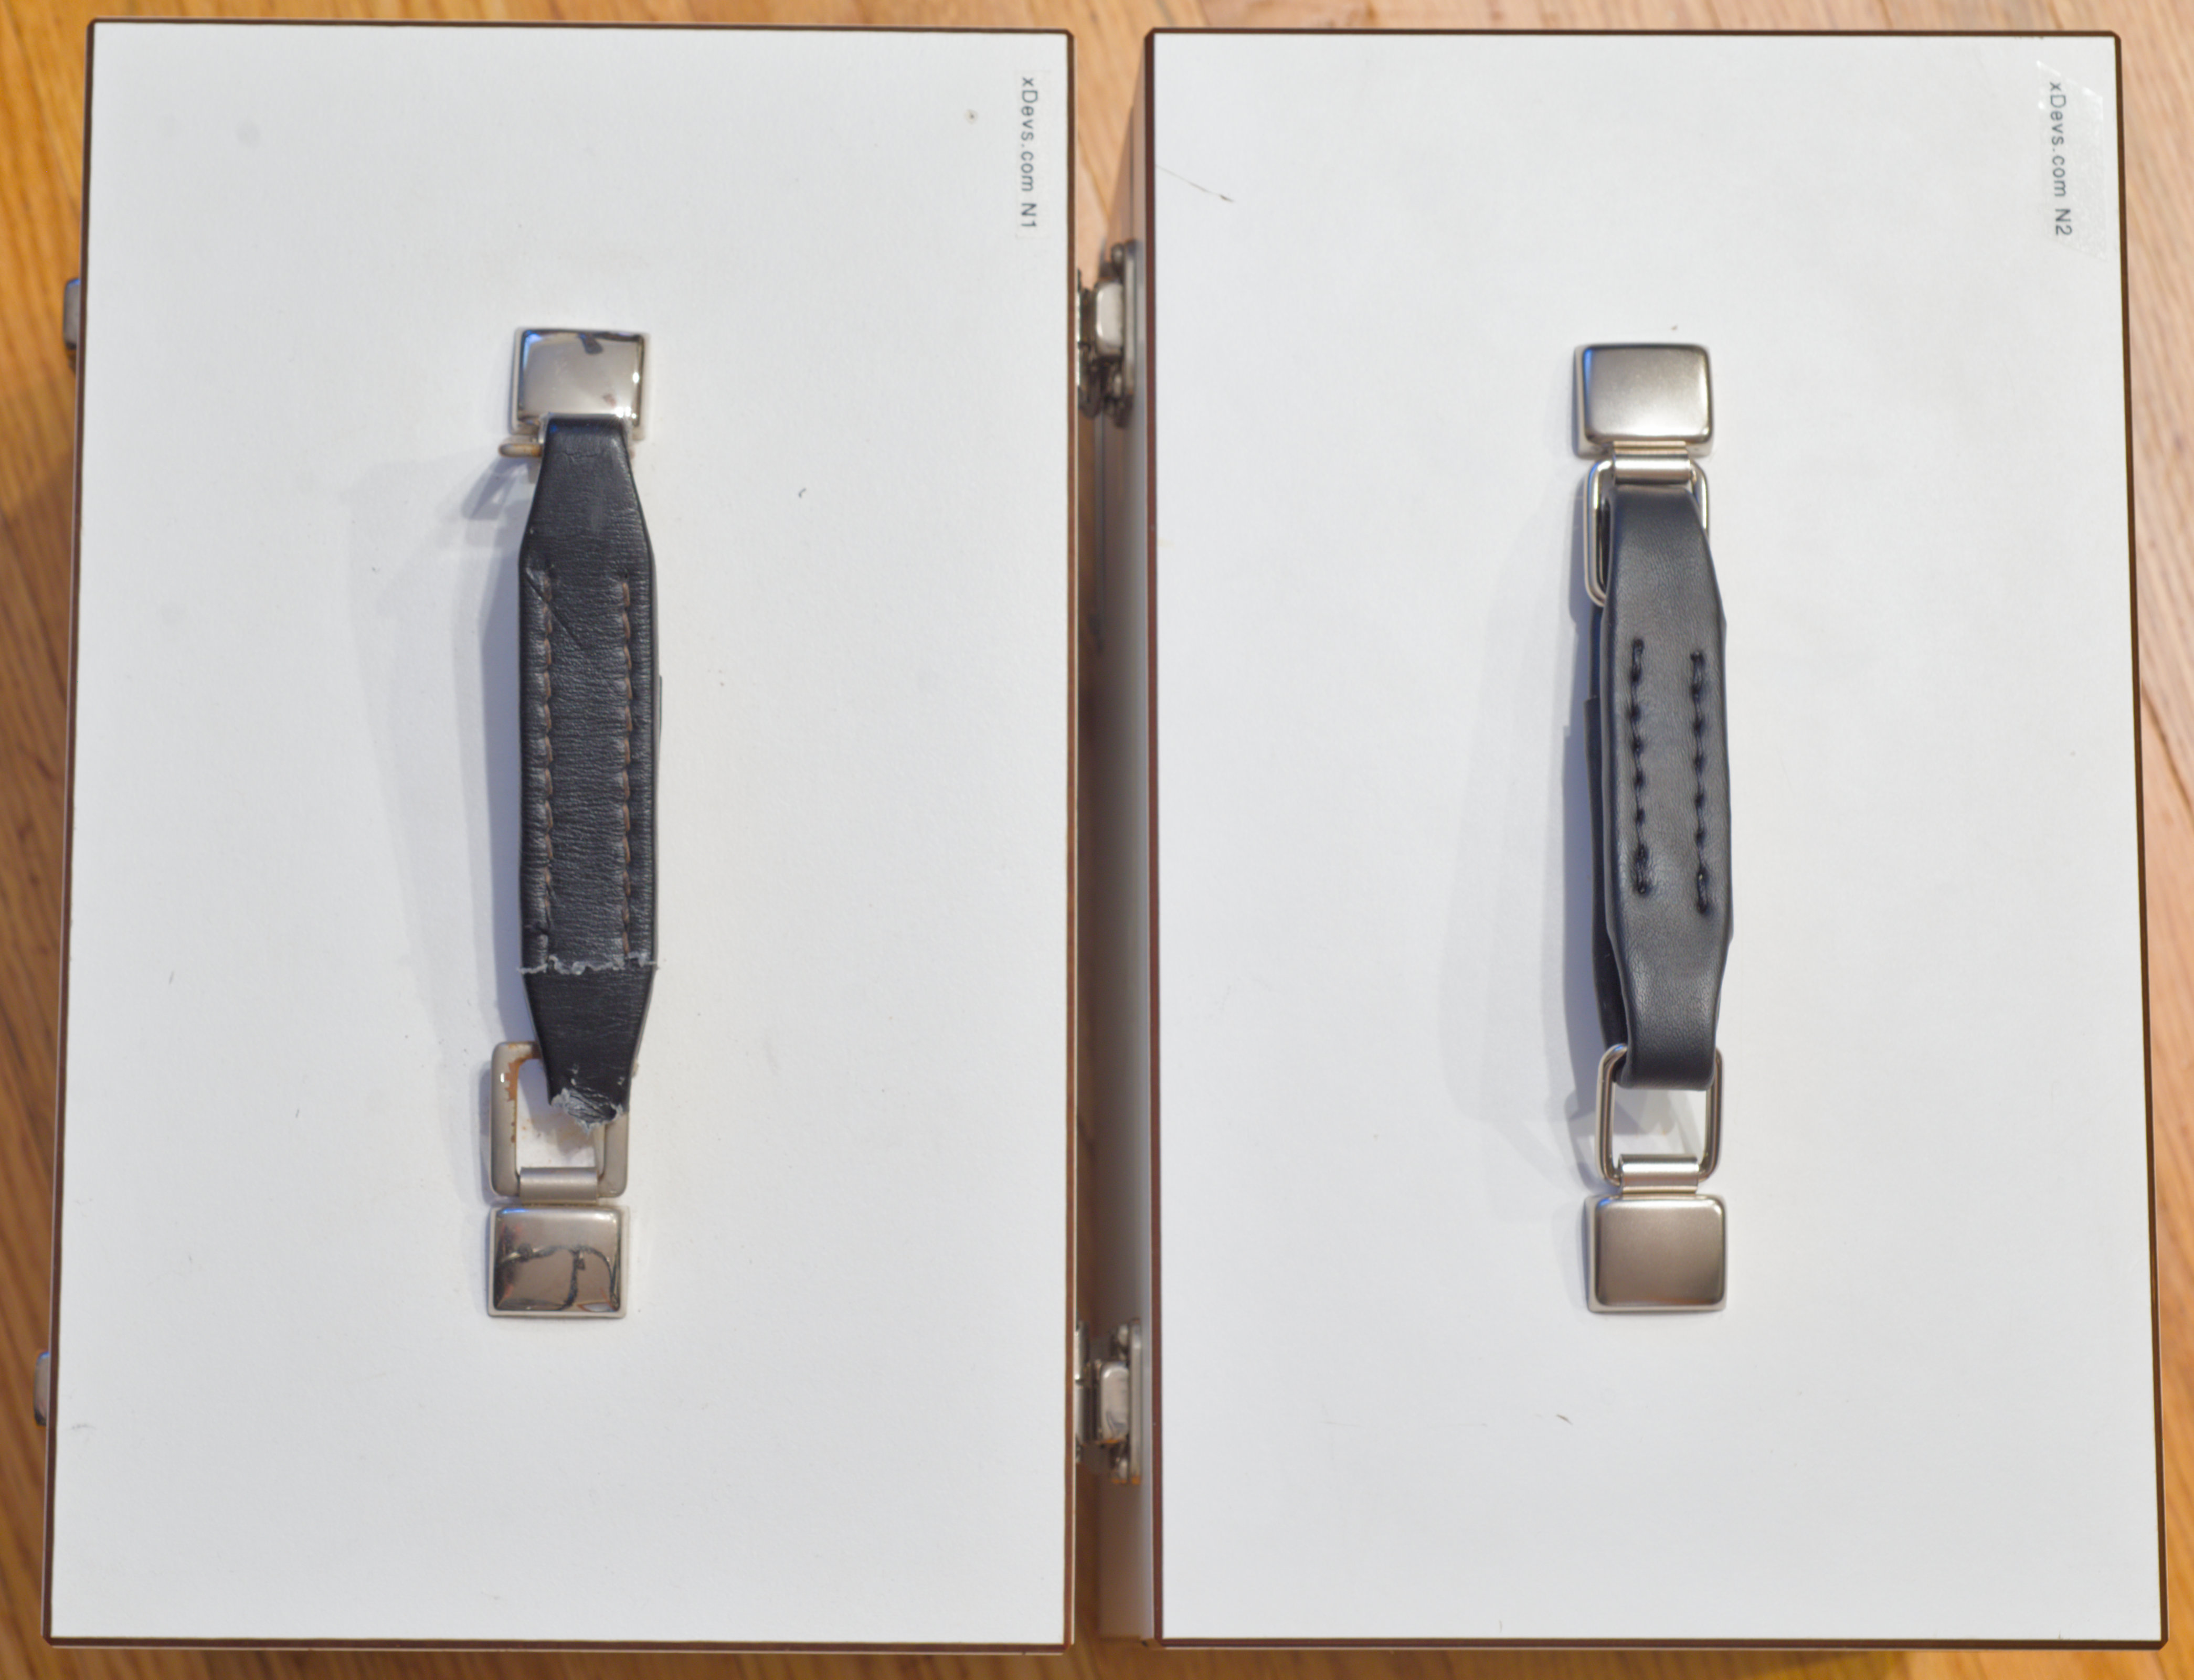
Image 94. Comparison of old SR104 with original handle (left) and new handle SR104
Thank you nikonoid for documenting this modification and refreshing famous ESI SR104 with a new hardware.
Summary & Conclusion
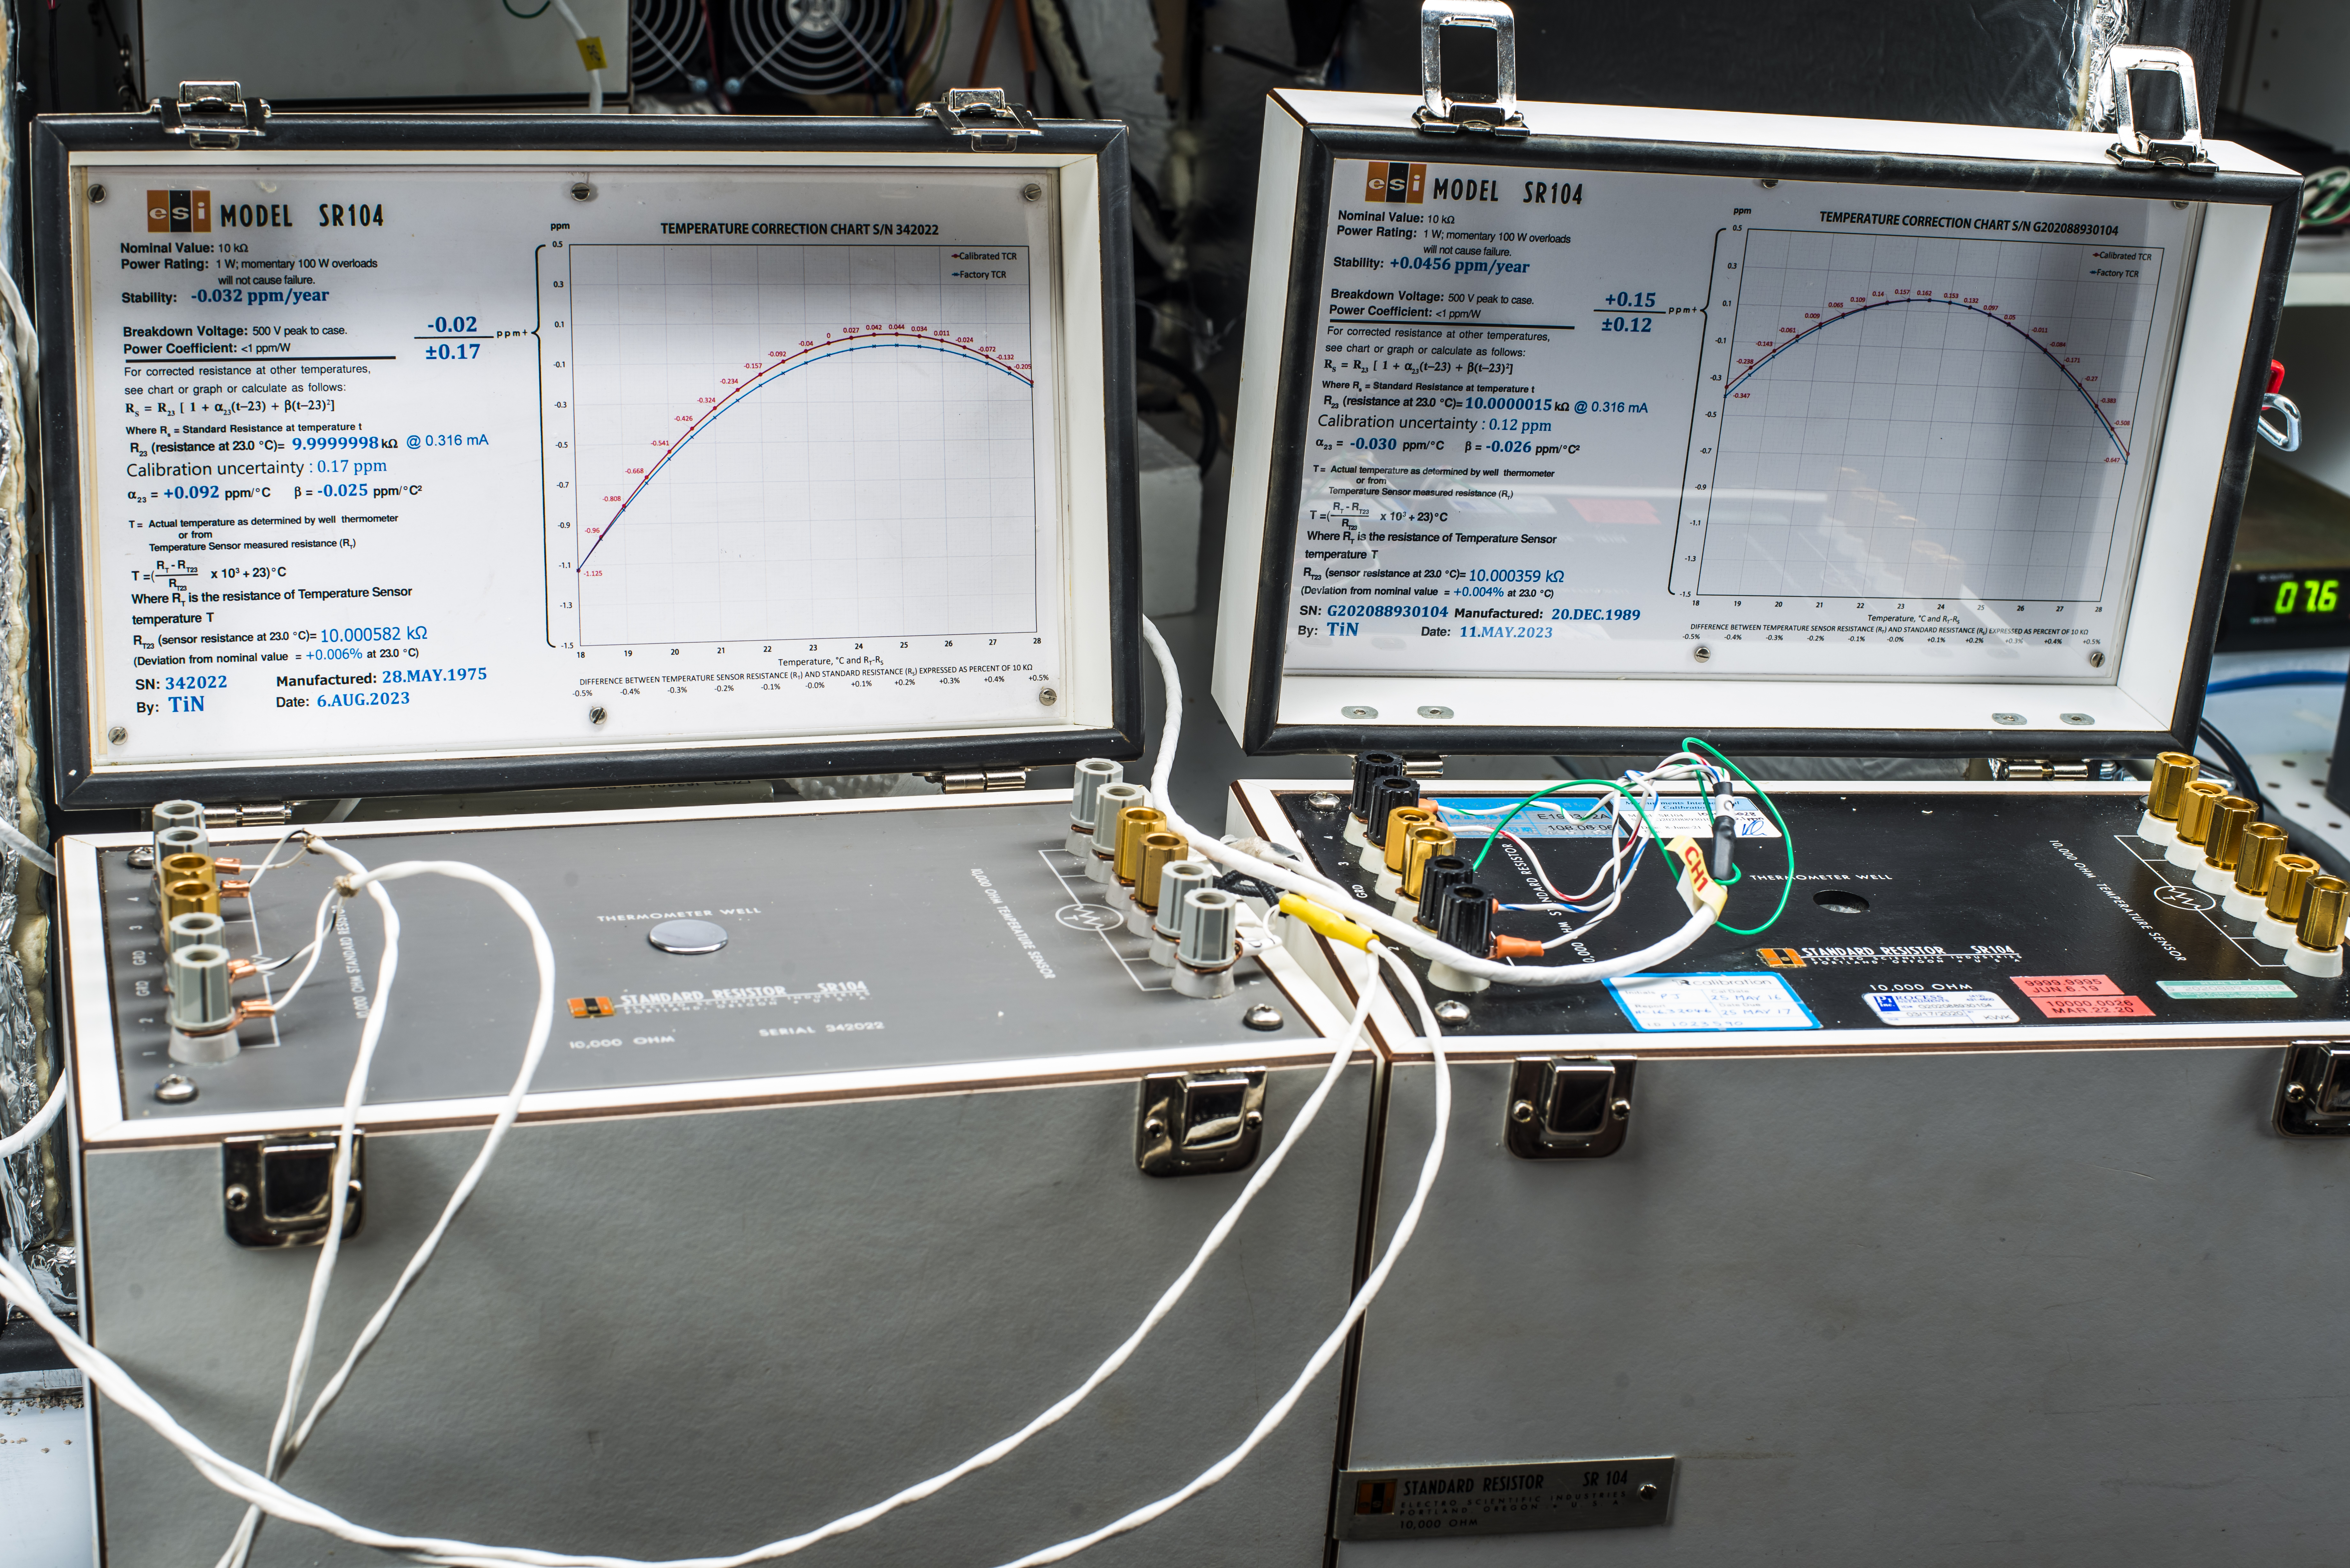
Image 95: Happy ESI SR104 standards for laboratory applications
Cost breakdown for project to maintain ultra-stable 10000 Ω at xDevs.com lab, to date presented below. This table should give the rough estimate of costs required to get started with own laboratory 10000 Ω standard maintenance and upkeep. Of course spending this kind of effort for high quality and long-term stable ESI SR104 might not be suitable for everyone. With availability of other precision resistance elements it’s possible to build and use much cheaper reference transfer resistors. This was already demonstrated before in our articles here , here and here. It’s also possible to use affordable secondary standards such as L&N 4040 for less demanding tasks, such as calibrating 5½-digit DMMs and ohm-meters.
| Item | Cost | Shipping | Supplier |
|---|---|---|---|
| Primary ESI SR104 resistance standard | $1528 | $215 | eBay |
| Calibration by ITRI CMS National lab | $400 | hand-carry | |
| Calibration by PI on 3/17/2020 | $550 | $200 | |
| Calibration by Measurements International on 6/8/2021 | $600 | $260 | |
| Secondary ESI SR104 resistance standard | $2380 | $270 (including case) | eBay |
| Calibration by Measurements International on 2nd SR104 | $600 | $300 | |
| Total spent on 10000 Ω maintenance | $7k+ USD | ||
Table 6. Costs summary
Given the performance and level of this resistance standard, condition and calibration data from 2016 total cost sounds reasonable. This primary SR104 act now as main 10000 Ω reference. ESI SR104 performance will help to maintain xDevs.com lab resistance calibration accuracy and stability in years to come as artifact for 8½-digit DMMs and multifunction calibrators verification.
Resistance measurement at sub ppm-level uncertainty is a very tricky business, and ESI SR104 is a great tool to aid these lower uncertainties. After getting some initial data during next few years, we plan to send SR104 for more comparisons with other calibrated SR104. After doing this procedure for some years, we will eventually come up with good annual stability/drift figures. Hopefully, we will know this primary 10000 Ω resistance actual stability with great uncertainty by the year 2030. Drift is always present with any non-quantum derived metrology artifact, the only question remaining is how large it is.
Until then, stay tuned and let us know your feedback! Discussion about this article and related stuff is welcome in comment section or at our own IRC chat server: xdevs.com (port 4808, channel: #xDevs.com). You can also participate in xDevs forum here
Projects like this are born from passion and a desire to share how things work. Education is the foundation of a healthy society - especially important in today's volatile world. xDevs began as a personal project notepad in Kherson, Ukraine back in 2008 and has grown with support of passionate readers just like you. There are no (and never will be) any ads, sponsors or shareholders behind xDevs.com, just a commitment to inspire and help learning. If you are in a position to help others like us, please consider supporting xDevs.com’s home-country Ukraine in its defense of freedom to speak, freedom to live in peace and freedom to choose their way. You can use official site to support Ukraine – United24 or Help99. Every cent counts.
Modified: July 17, 2026, 3:36 a.m.