- Intro
- Disclaimer
- Tinsley 5685A 1 Ω resistance standard, S/N 262249
- Tinsley 5685A 10 Ω resistance standard, S/N 262283
- Tinsley 5685A 100 Ω resistance standard, S/N 262763
- Benchmarks
- Tinsley 5648 oven enclosure units teardown
- Conclusion and summary
![]()
![]()
![]()
![]()
![]()
![]()
Introduction to Tinsley resistance standards
Tinsley is old and well-known manufacturer for high stability metrology resistance standards and test equipment. Founded in 1904 by Henry Tinsley the company today is internationally recognized as one of the instruments manufacturers, supplying instrumentation and standards to National Standards Laboratories and industry worldwide.
Their Model 5865A is resistance standard for various thermometry, AC and DC resistance metrology applications. In this article we will look and test few of these, sourced from secondary market used. Much of the design for these resistance standards originated with F.J. Wilkins of the NPL back in year 1970.
Per that research paper these resistance standards are made from either Evanohm, Moleculoy or Stabilohm 133 wire. These alloys have low Seebeck coefficients, and hence low Peltier coefficients with copper, so that the influence of the thermoelectric effects should be small. Moreover, each of the standard element is immersed in the can filled with silicone oil. Oil greatly increase the thermal contact and thermal capacity of each internal junction to further help with transfer stability.
| Unit | S/N | Results | Measured value | Calibration Date, method |
|---|---|---|---|---|
| 5685A-100 | 262763 | Details 1 | 99.998737 Ω ±0.36 ppm, 10 mA | 1.JAN.2023, DCC w/air bath |
| 5685A-10 | 262283 | Details 1 | 9.9998258 Ω ±0.4 ppm, 31.6 mA | 15.JAN.2025, DCC w/air bath |
| 5685A-1 | 262249 | Details 1 | 0.99997704 Ω ±0.49 ppm, 31.6 and 50 mA | 5.JAN.2023, DCC w/air bath |
Table 1: Tinsley resistors in this review
There are multiple other standards that Tinsley manufactured. Full list shown below. Resistors in this article marked in bold.
| Model | Type | Features |
|---|---|---|
| 5685A1 | 1 Ω high-stability standard, 2 ppm | Oil-filled SS can with thermal well, 4 terminal connection |
| 5685A2 | 10 Ω high-stability standard, 2 ppm | Oil-filled SS can with thermal well, 4 terminal connection |
| 5685A3 | 25 Ω high-stability standard, 2 ppm | Oil-filled SS can with thermal well, 4 terminal connection |
| 5685A4 | 100 Ω high-stability standard, 2 ppm | Oil-filled SS can with thermal well, 4 terminal connection |
| 5685A07 | 300 Ω high-stability standard, 2 ppm | Oil-filled SS can with thermal well, 4 terminal connection |
| 5685B24 | 400 Ω high-stability standard, 2 ppm | Oil-filled SS can with thermal well, 4 terminal connection |
| 5685B16 | 500 Ω high-stability standard, 2 ppm | Oil-filled SS can with thermal well, 4 terminal connection |
| 5685B1 | 1000 Ω high-stability standard, 2 ppm | Oil-filled SS can with thermal well, 4 terminal connection |
| 5685C | 10000 Ω special standard, 2 ppm | Oil-filled? SS can with 4 terminal connection |
| 5695R1 | Standard Resistor, 1 Ω 5ppm | Small SS can with four 5-way binding post connection |
| 5695R10 | Standard Resistor, 10 Ω 5ppm | Small SS can with four 5-way binding post connection |
| 5695R25 | Standard Resistor, 25 Ω 5ppm | Small SS can with four 5-way binding post connection |
| 5695R100 | Standard Resistor, 100 Ω 5ppm | Small SS can with four 5-way binding post connection |
| 5695R300 | Standard Resistor, 300 Ω 5ppm | Small SS can with four 5-way binding post connection |
| 5695R400 | Standard Resistor, 400 Ω 5ppm | Small SS can with four 5-way binding post connection |
| 5695R500 | Standard Resistor, 500 Ω 5ppm | Small SS can with four 5-way binding post connection |
| 5695R1000 | Standard Resistor, 1K Ω 5ppm | Small SS can with four 5-way binding post connection |
| 5615A | 100 kΩ high resistance standard, 50 ppm accuracy, ±10 ppm/°C TCR | SS can with 4 terminal connection |
| 5615B | 1 MΩ High resistance standard, 50 ppm accuracy, ±20 ppm/°C TCR | SS can with 4 terminal connection |
| 5615C | 10 MΩ High resistance standard, 50 ppm accuracy, ±20 ppm/°C TCR | SS can with 4 terminal connection |
| 5686A | Low resistance 0.001 Ω DC standard, 200 ppm, ±50 ppm/°C TCR | Oil-filled SS can with 4 terminal connection |
| 5686B | Low resistance 0.01 Ω DC standard, 100 ppm, ±10 ppm/°C TCR | Oil-filled SS can with 4 terminal connection |
| 5686C | Low resistance 0.1 Ω DC standard, 20 ppm, ±10 ppm/°C TCR | Oil-filled SS can with 4 terminal connection |
| 1660 | Low cost standard | Metal box with 4 5-way binding post connection |
| 1659 | Precision non-inductive manganin standard, 0.2 to 10000 Ω, 0.03 to 7A, DC to AC 1kHz | Small SS can with 4 terminal connection |
| 1682 | Precision non-inductive manganin standard, 0.02 to 0.2 Ω, 3 to 50A, DC to AC 1kHz | Medium side SS can with 4 terminal connection |
| 3111 | Precision non-inductive manganin standard, 0.005 to 0.2 Ω 100 to 200A, DC to AC 1kHz | Large SS can with 4 terminal connection |
| 660M | Precision non-inductive manganin standard, 0.001 Ω 700 A, DC to AC 1kHz | Large SS can with 4 terminal connection |
| 5576M | Precision non-inductive manganin standard, 0.0001 to 0.0005 Ω 1000 and 2250A, DC to AC 1kHz | Large SS can with 4 terminal connection |
Table 2: Tinsley resistance standard products
Tinsley also makes special Model 5648 Temperature controlled oven enclosure designed to keep one standard of type 5695, 5685A, 5685B, 5685 or 5615 at fixed +36.0 °C ±0.1 °C. Keeping standard at fixed temperature removes temperature coefficient effects from measurement. It is particularly useful for thermometry metrology applications and eliminate need of large oil bath and oil maintenance mess it involves. These Tinsley resistance standards also licensed and sold by Isotech under model names SRA and SRB. Isotech specialize in thermometry products and metrology, so it makes sense to use high quality standard like 5685A for thermometry measurements.
Another alternative today for these resistors is perhaps Measurement International 9210A and 9210B series which have similar construction, AC resistance capability to few kHz frequency and bit better factory specifications for temperature coefficient and long-term stability.
Disclaimer
Redistribution and use of this article, any part of it or any images or files referenced in it, in source and binary forms, with or without modification, are permitted provided that the following conditions are met:
- Redistributions of article must retain the above copyright notice, this list of conditions, link to this page (https://xdevs.com/review/tinsleyres/) and the following disclaimer.
- Redistributions of files in binary form must reproduce the above copyright notice, this list of conditions, link to this page (https://xdevs.com/review/tinsleyres/), and the following disclaimer in the documentation and/or other materials provided with the distribution, for example Readme file.
All information posted here is hosted just for education purposes and provided AS IS. In no event shall the author, xDevs.com site, or any other 3rd party be liable for any special, direct, indirect, or consequential damages or any damages whatsoever resulting from loss of use, data or profits, whether in an action of contract, negligence or other tortuous action, arising out of or in connection with the use or performance of information published here.
If you willing to contribute or add your experience regarding instrument repairs or provide extra information, you can do so following these simple instructions.
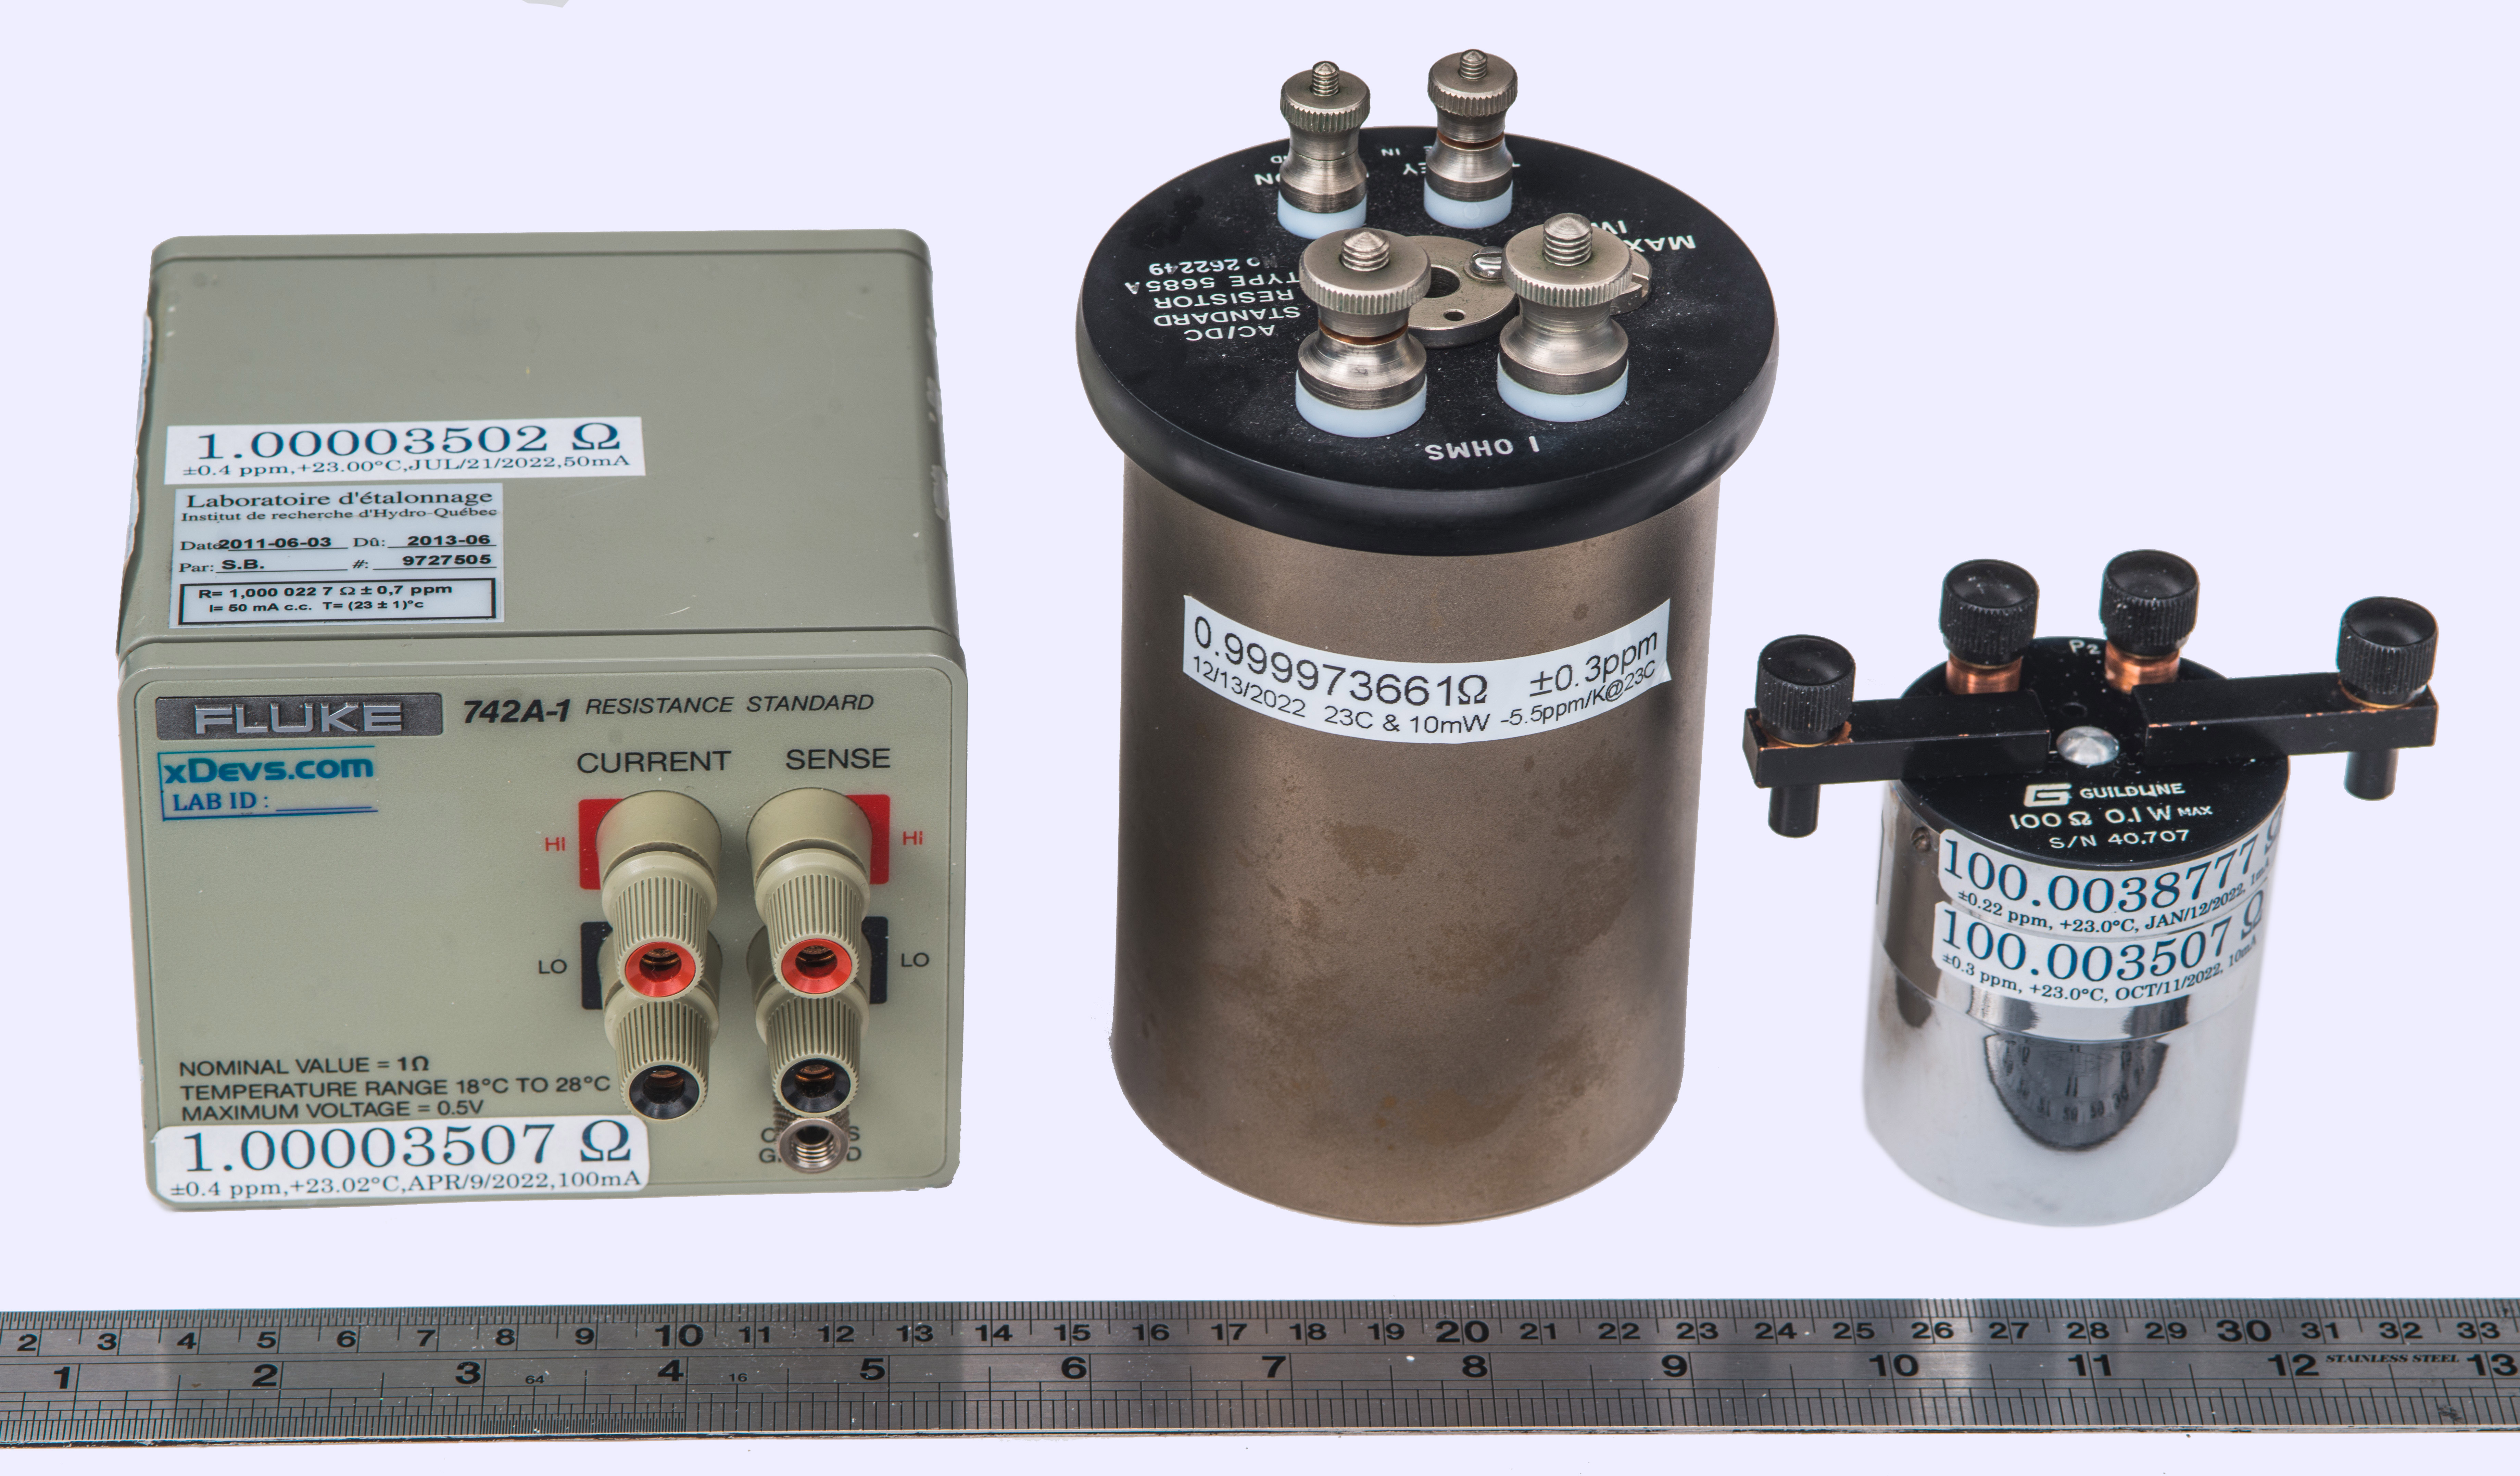
Image 1: Exterior comparison between Fluke 742A-1 (left), Tinsley 5685A-1 (center) and Guildline 9330-100 (right)
Specification for these resistance standard from Tinsley website:
- Standard values are 10, 25, 100, 400 and 1000 Ω, other values possible for special order.
- Factory calibration with uncertainty 3 ppm
- AC/DC frequency dependence 1 ppm up to 1592 Hz for 10 to 10000 Ω 5 ppm for 1 Ω
- Stability per 1 year 2 ppm (there is special HS version is 0.5 ppm/year)
- Initial absolute tolerance within ± 10 ppm
- Temperature coefficient better than 2 ppm/K (there is special HS version is 0.5 ppm/K TCR)
- Approximate power coefficient 6 ppm/W
- Recommended power 10 mW
- Recommended working temperature +20 °C with allowed range from +15 to +40 °C
- Dimensions D = 76mm, H = 114 mm, 0.7 kg weight
Here we have three standards with nominals 1 Ω, 10 Ω and 100 Ω for some benchmarks and tests. They came from same source on secondary market and supposedly good and happy units. Testing will reveal the truth soon enough.
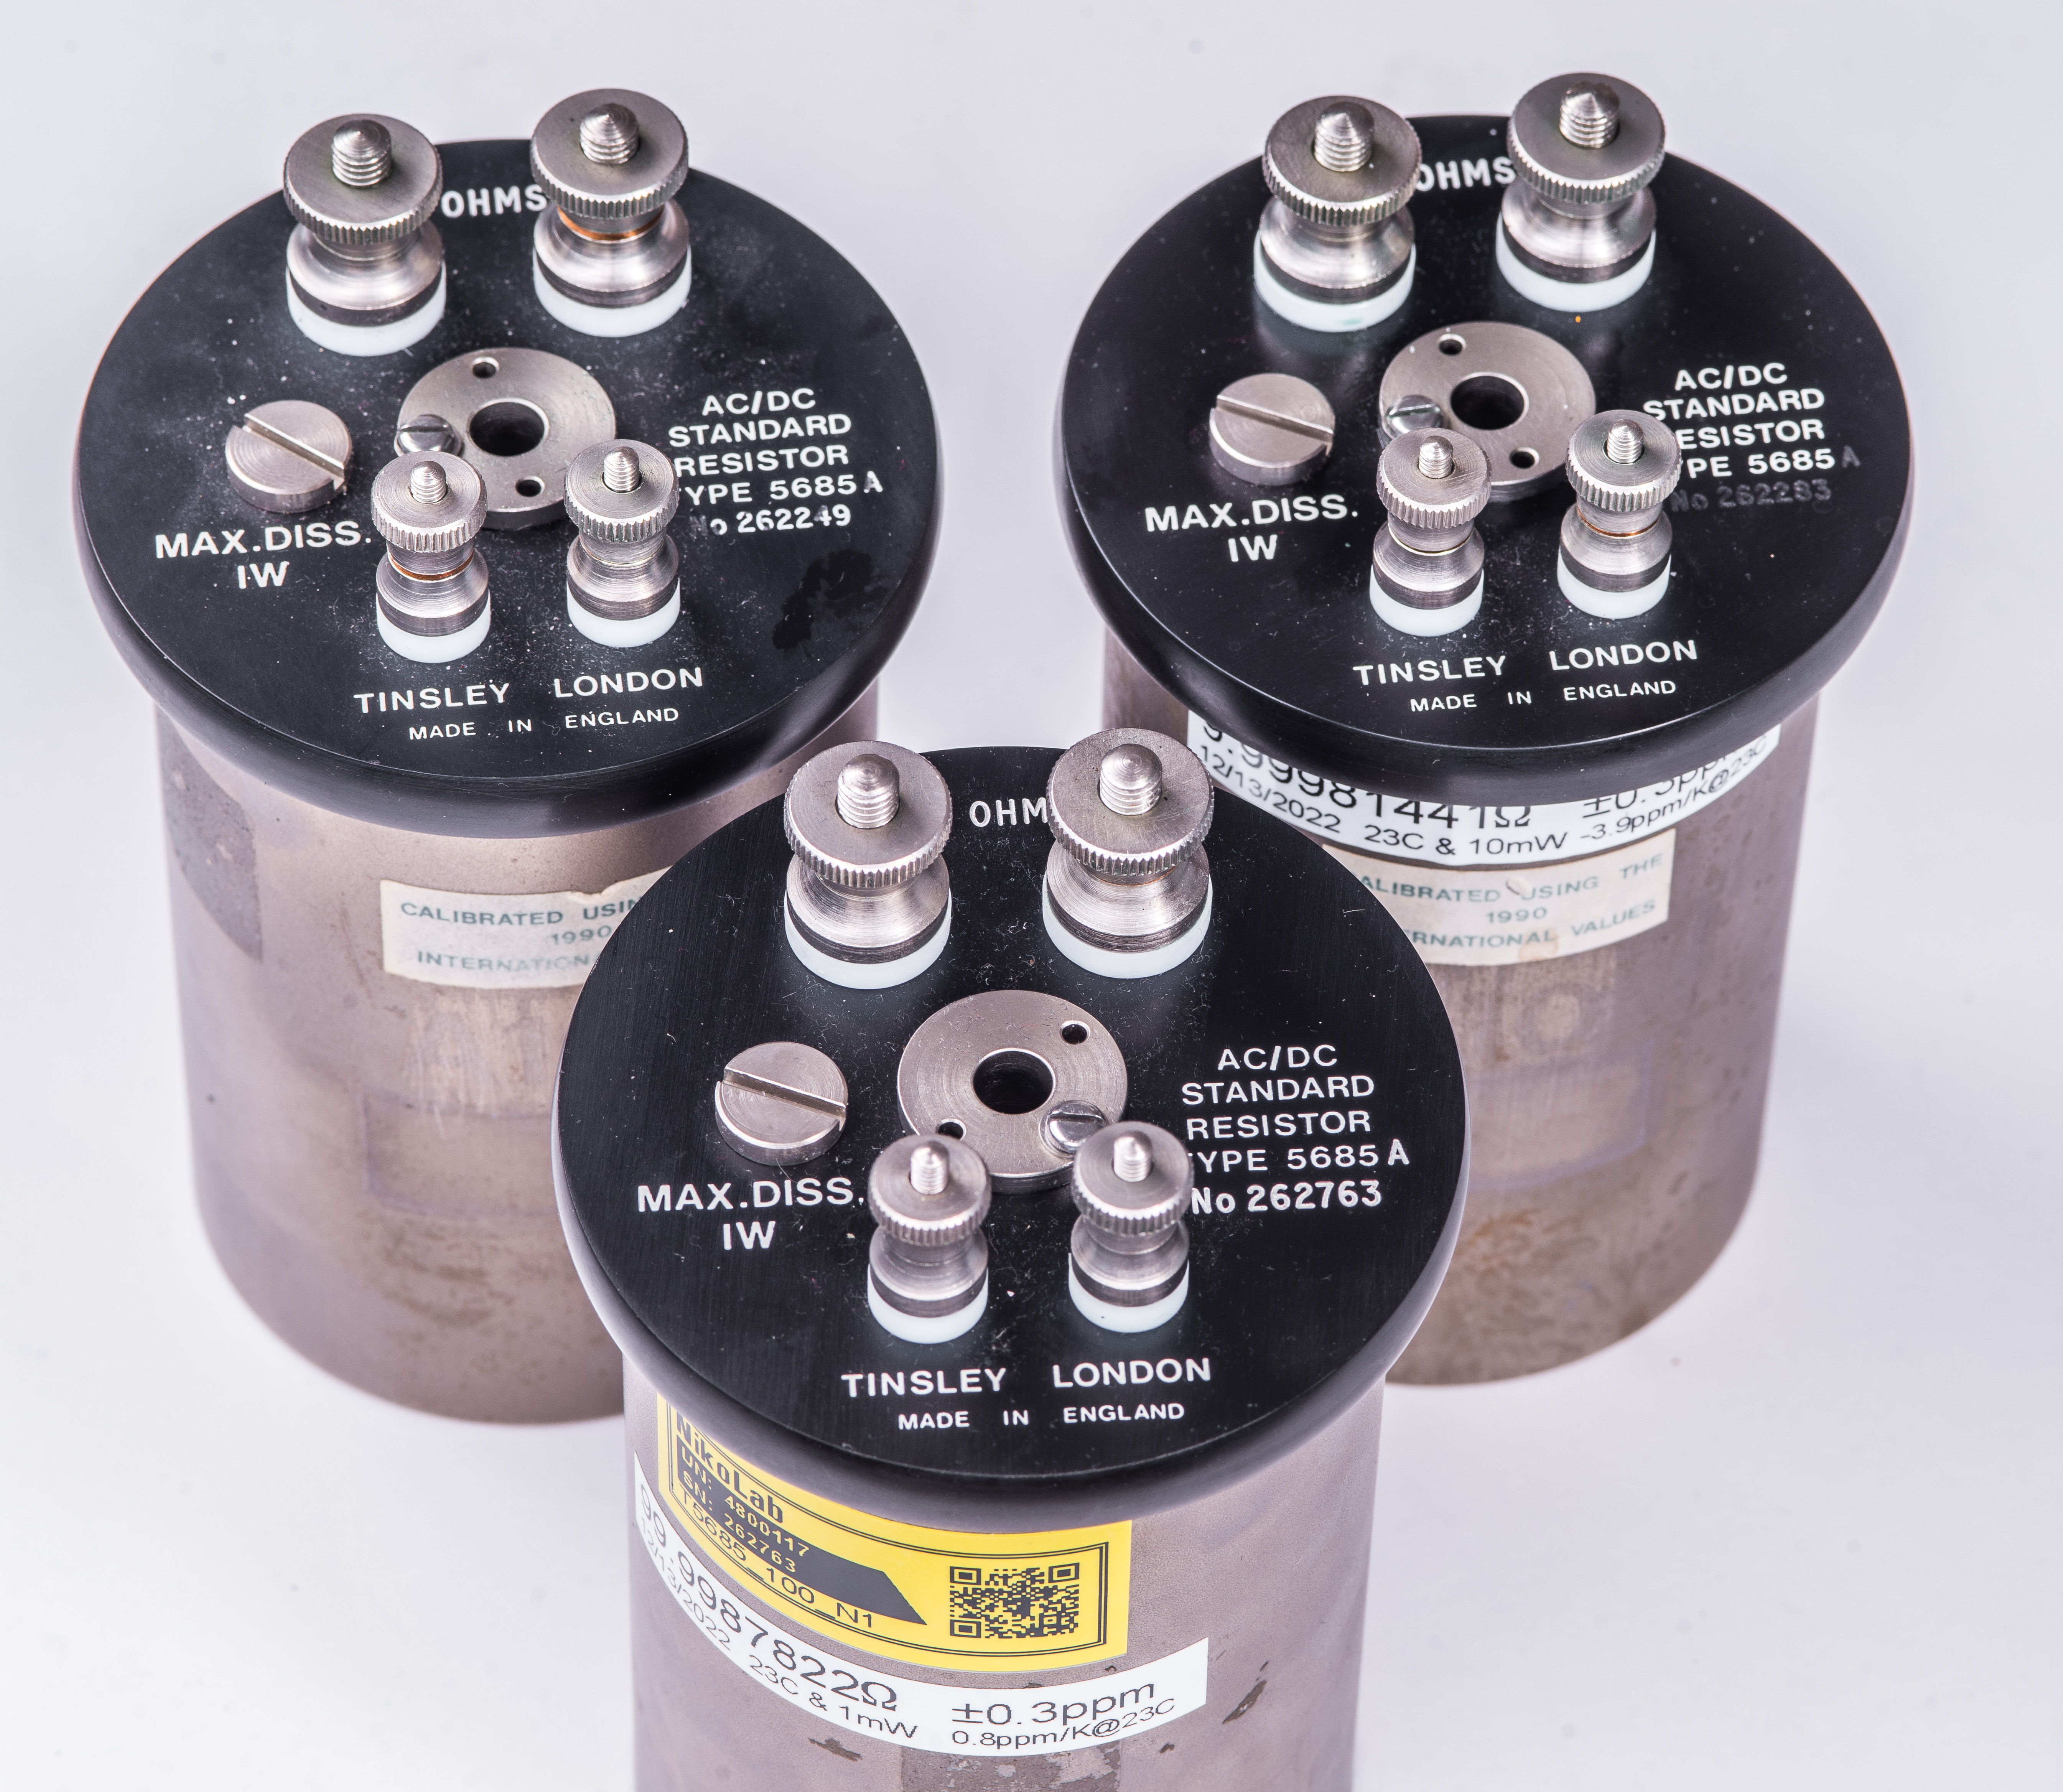
Image 2: Set of three resistors for testing
Design of these Tinsley 5685A standard is based on collaboration with NPL (UK National Physical Laboratory). These resistors are known to demonstrate long-term stability similar to famous ESI SR104 10000 Ω primary standards.
Body of these standards is stainless steel, so orange grime on the sidewall is not really a rust but some dirt from years of the previous usage.

Image 3: Two 5685A on the side with some labels, as received
White labels with recent values are measured by neighbor NLab using DCC bridge. All standards were compared against Fluke 742A-10 that was restored and re-calibrated some time while ago.
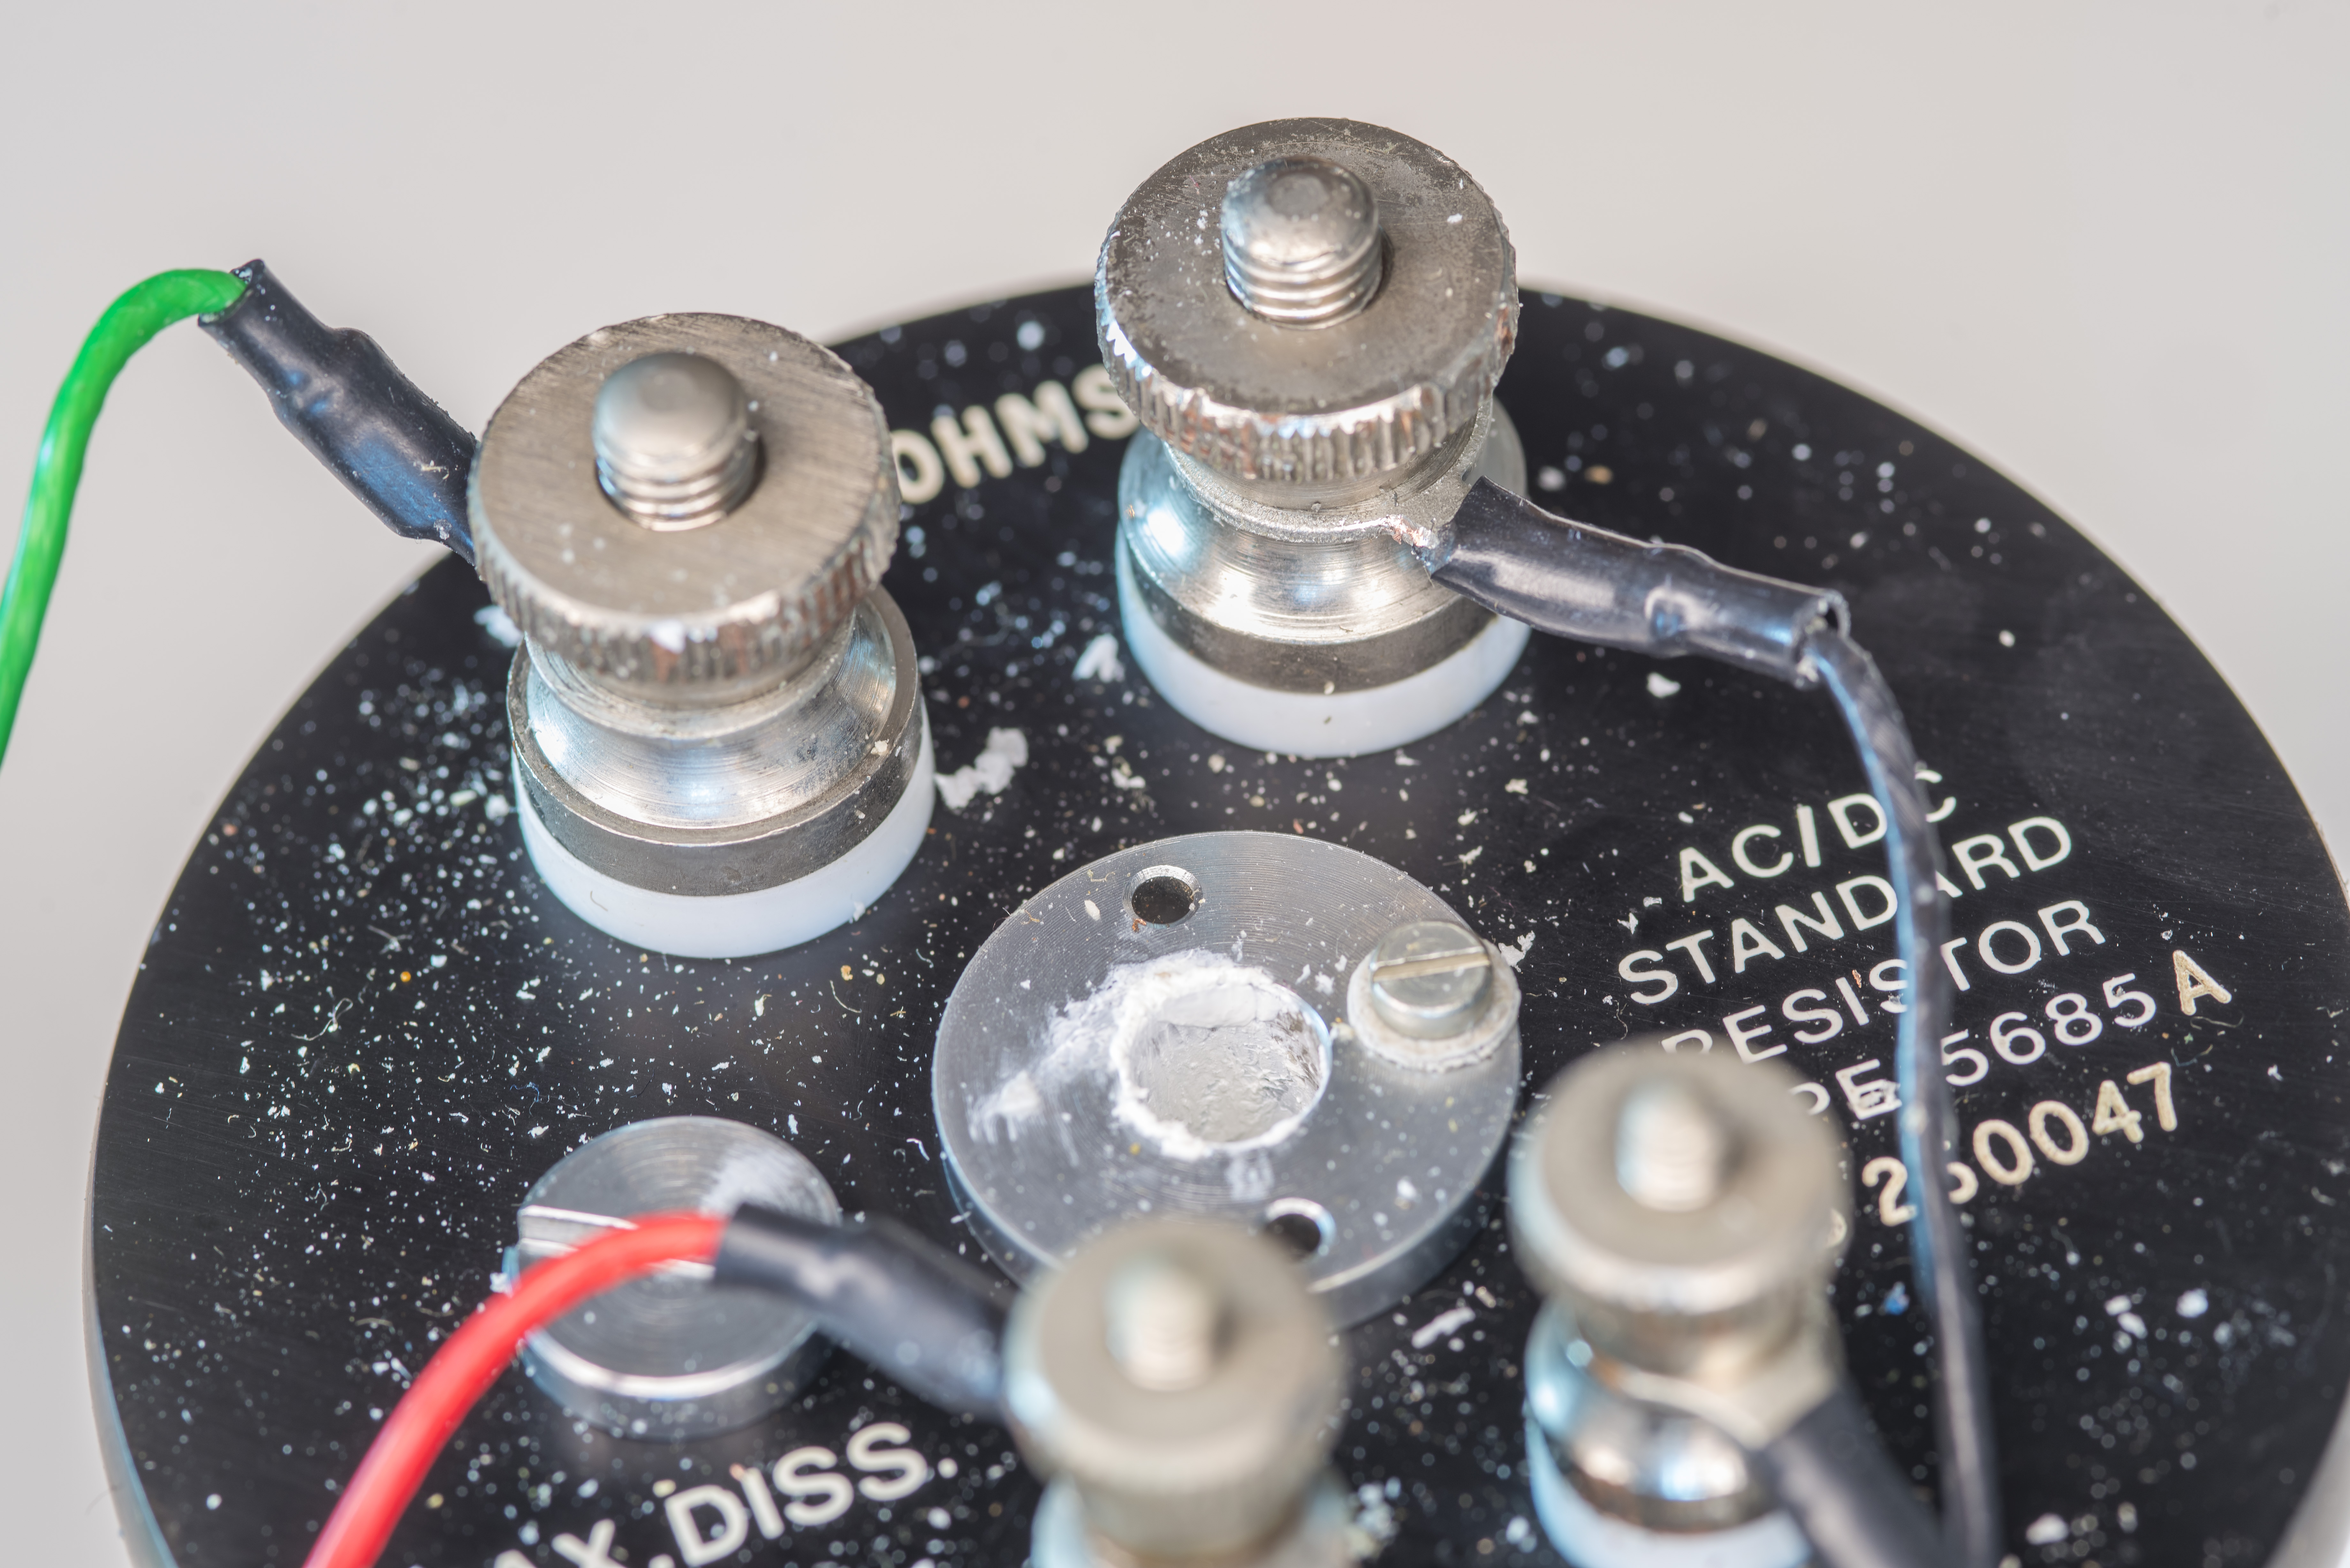
Top bakelite plate has four massive nickel-plated copper terminals, thermal well insert and fill port plug. Larger terminals for current are made with 0BA British size thread. Potential terminals use smaller 4BA thread size. Earth/ground screw mounted on well has 6BA thread size.
All three resistors are 5685A model, which is current product that Tinsley sells today. Top plate is fixed to the stainless steel can body with massive bolt, accessible on the bottom. For additional security and reliability this bolt is fixed with hard epoxy.

Image 4: Resistor from top and bottom side
Not exactly clear what the small flat head screw is for on the thermal well. Our best guess it is for grounding/shield wire connection? It is short ~4mm length bolt with steel washer under it. It does not hold anything externally visible. There is electrical connection less than 0.1 Ω between thermal well and outer body of the standard. Obviously, all four main terminals are isolated from the body and thermal well with resistance over 1 GΩ. The white insulator under terminals look and feels like PTFE.
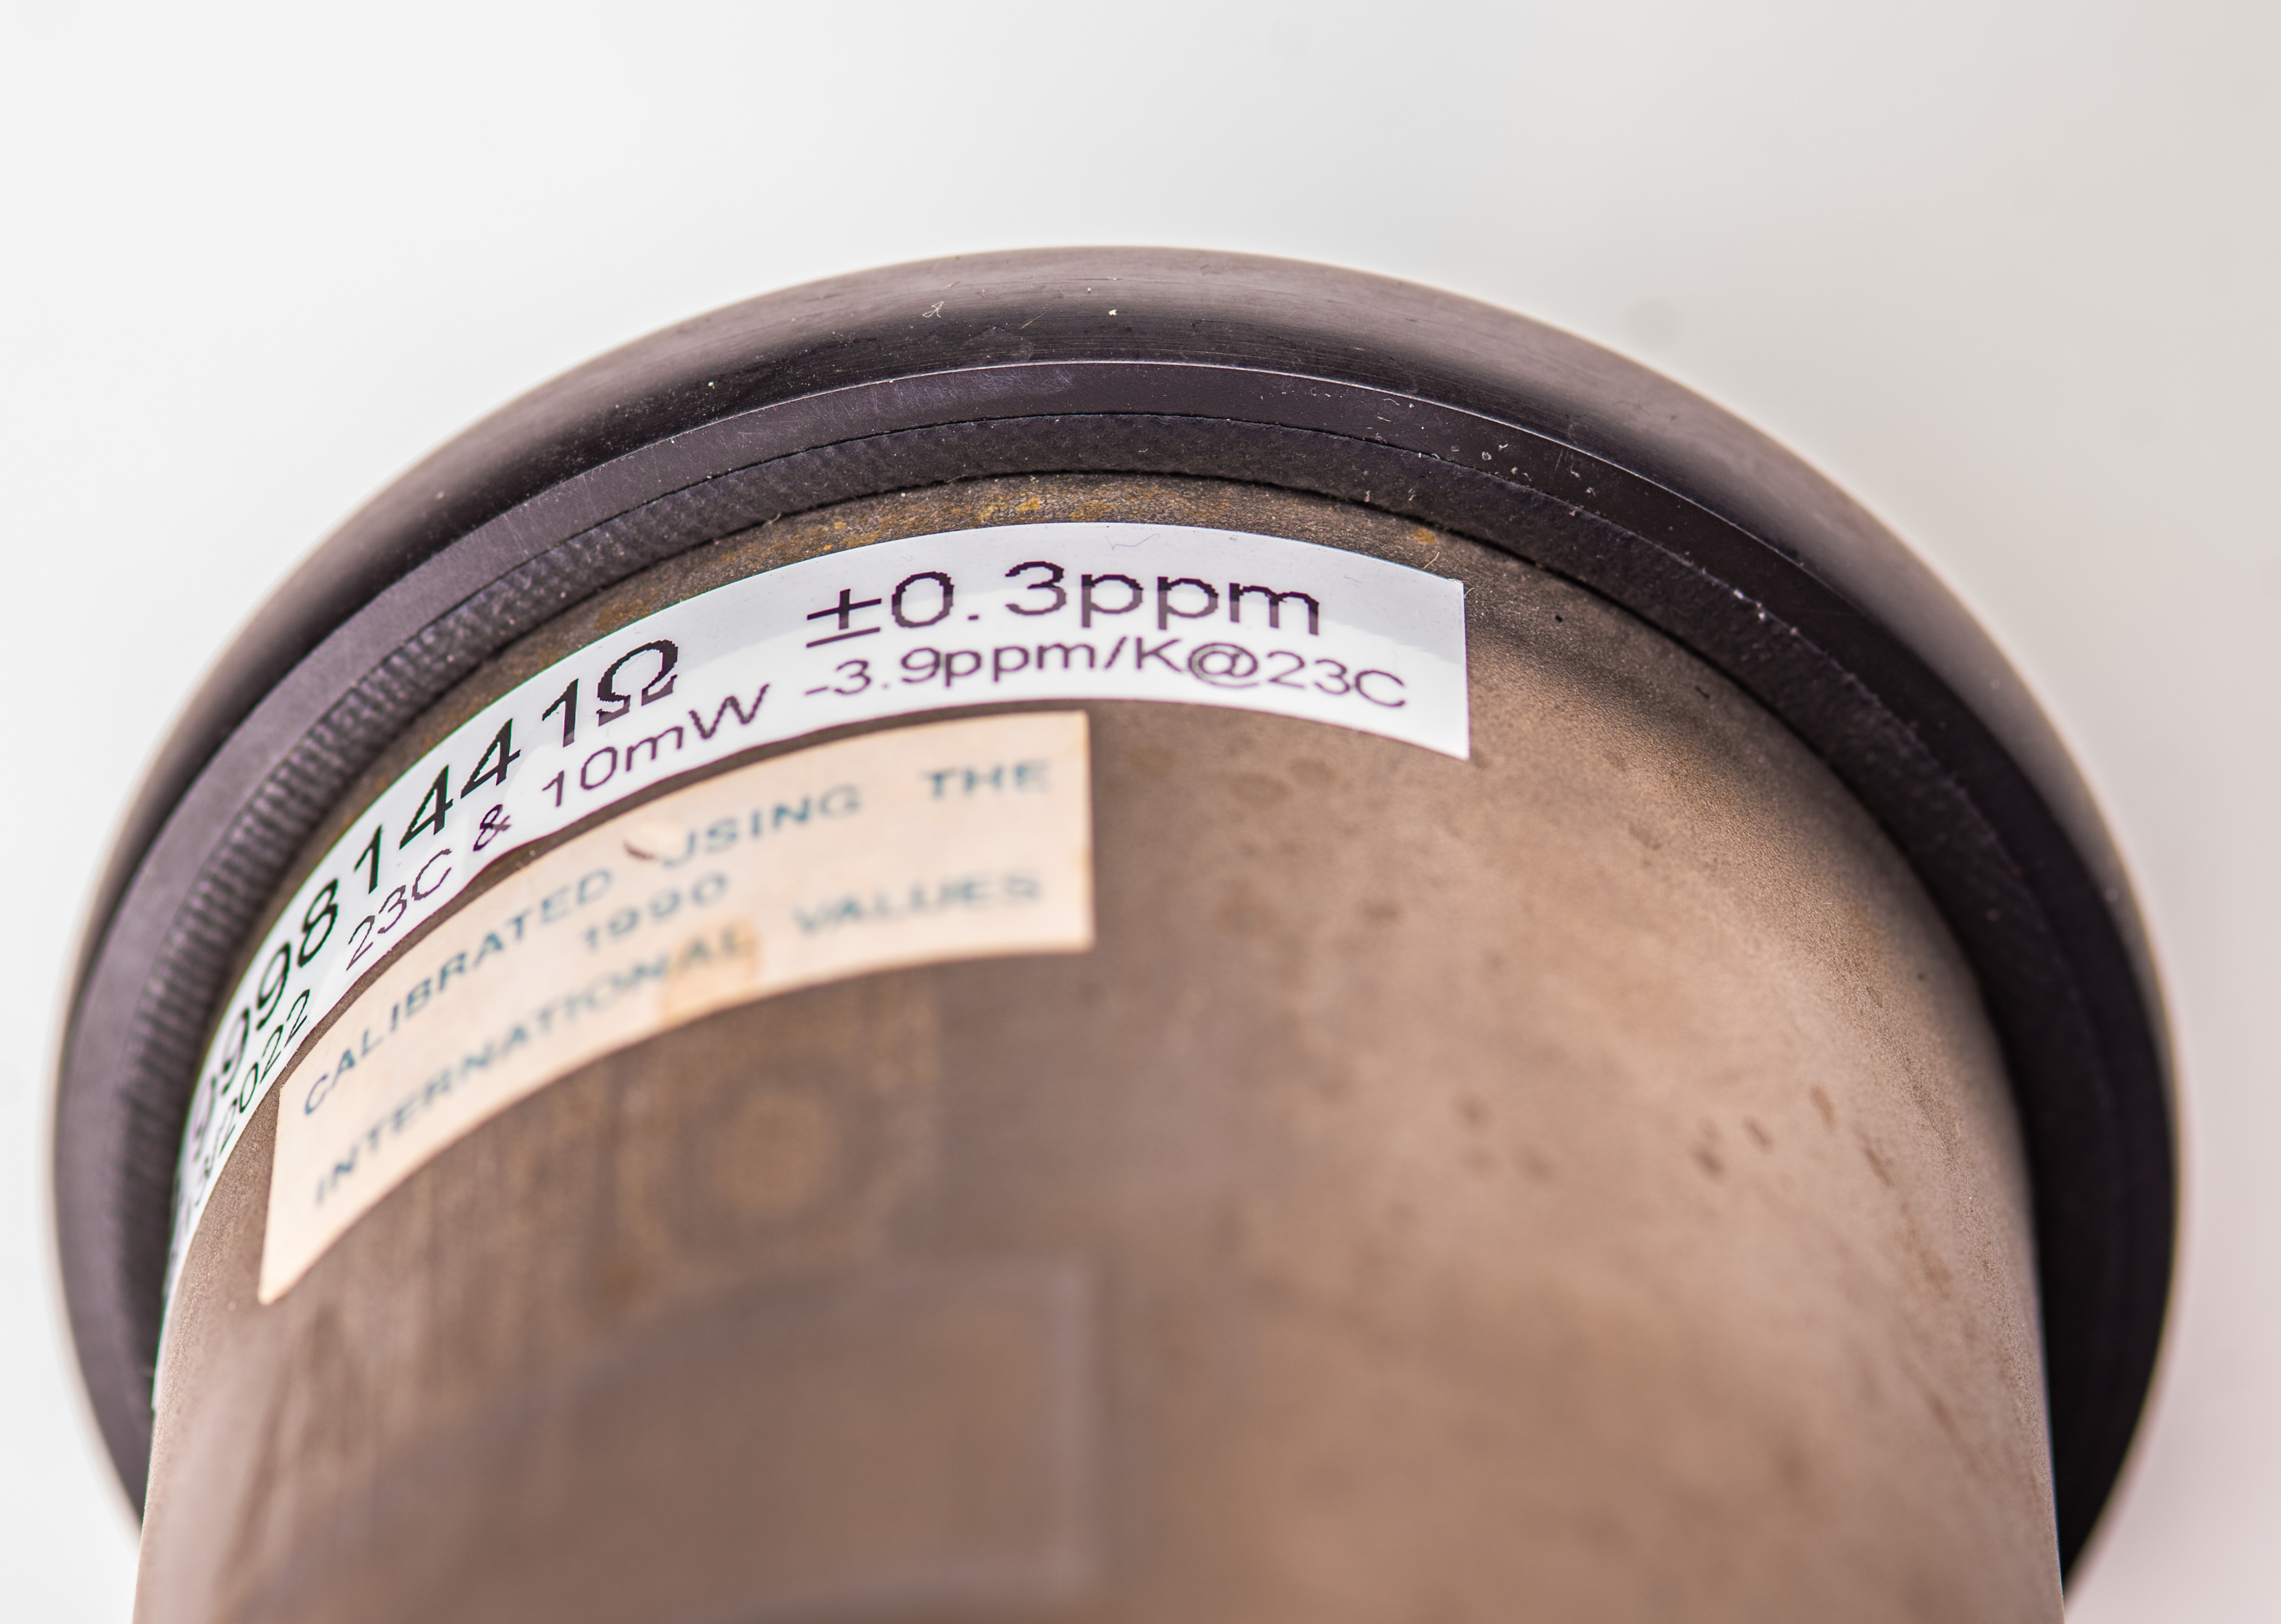
Image 5: Seal between bakelite top and metal body can
Metal can is pressed against rubber seal in the bakelite lid’s bottom surface.
All three standards did not have any previous calibration stickers, so we don’t have any past history. There are residues on the body from past rectangular shaped labels, as well as nice number stickers. 1 Ω had number A109, 10 Ω A110 and 100 Ω finally had A108, whatever that means.
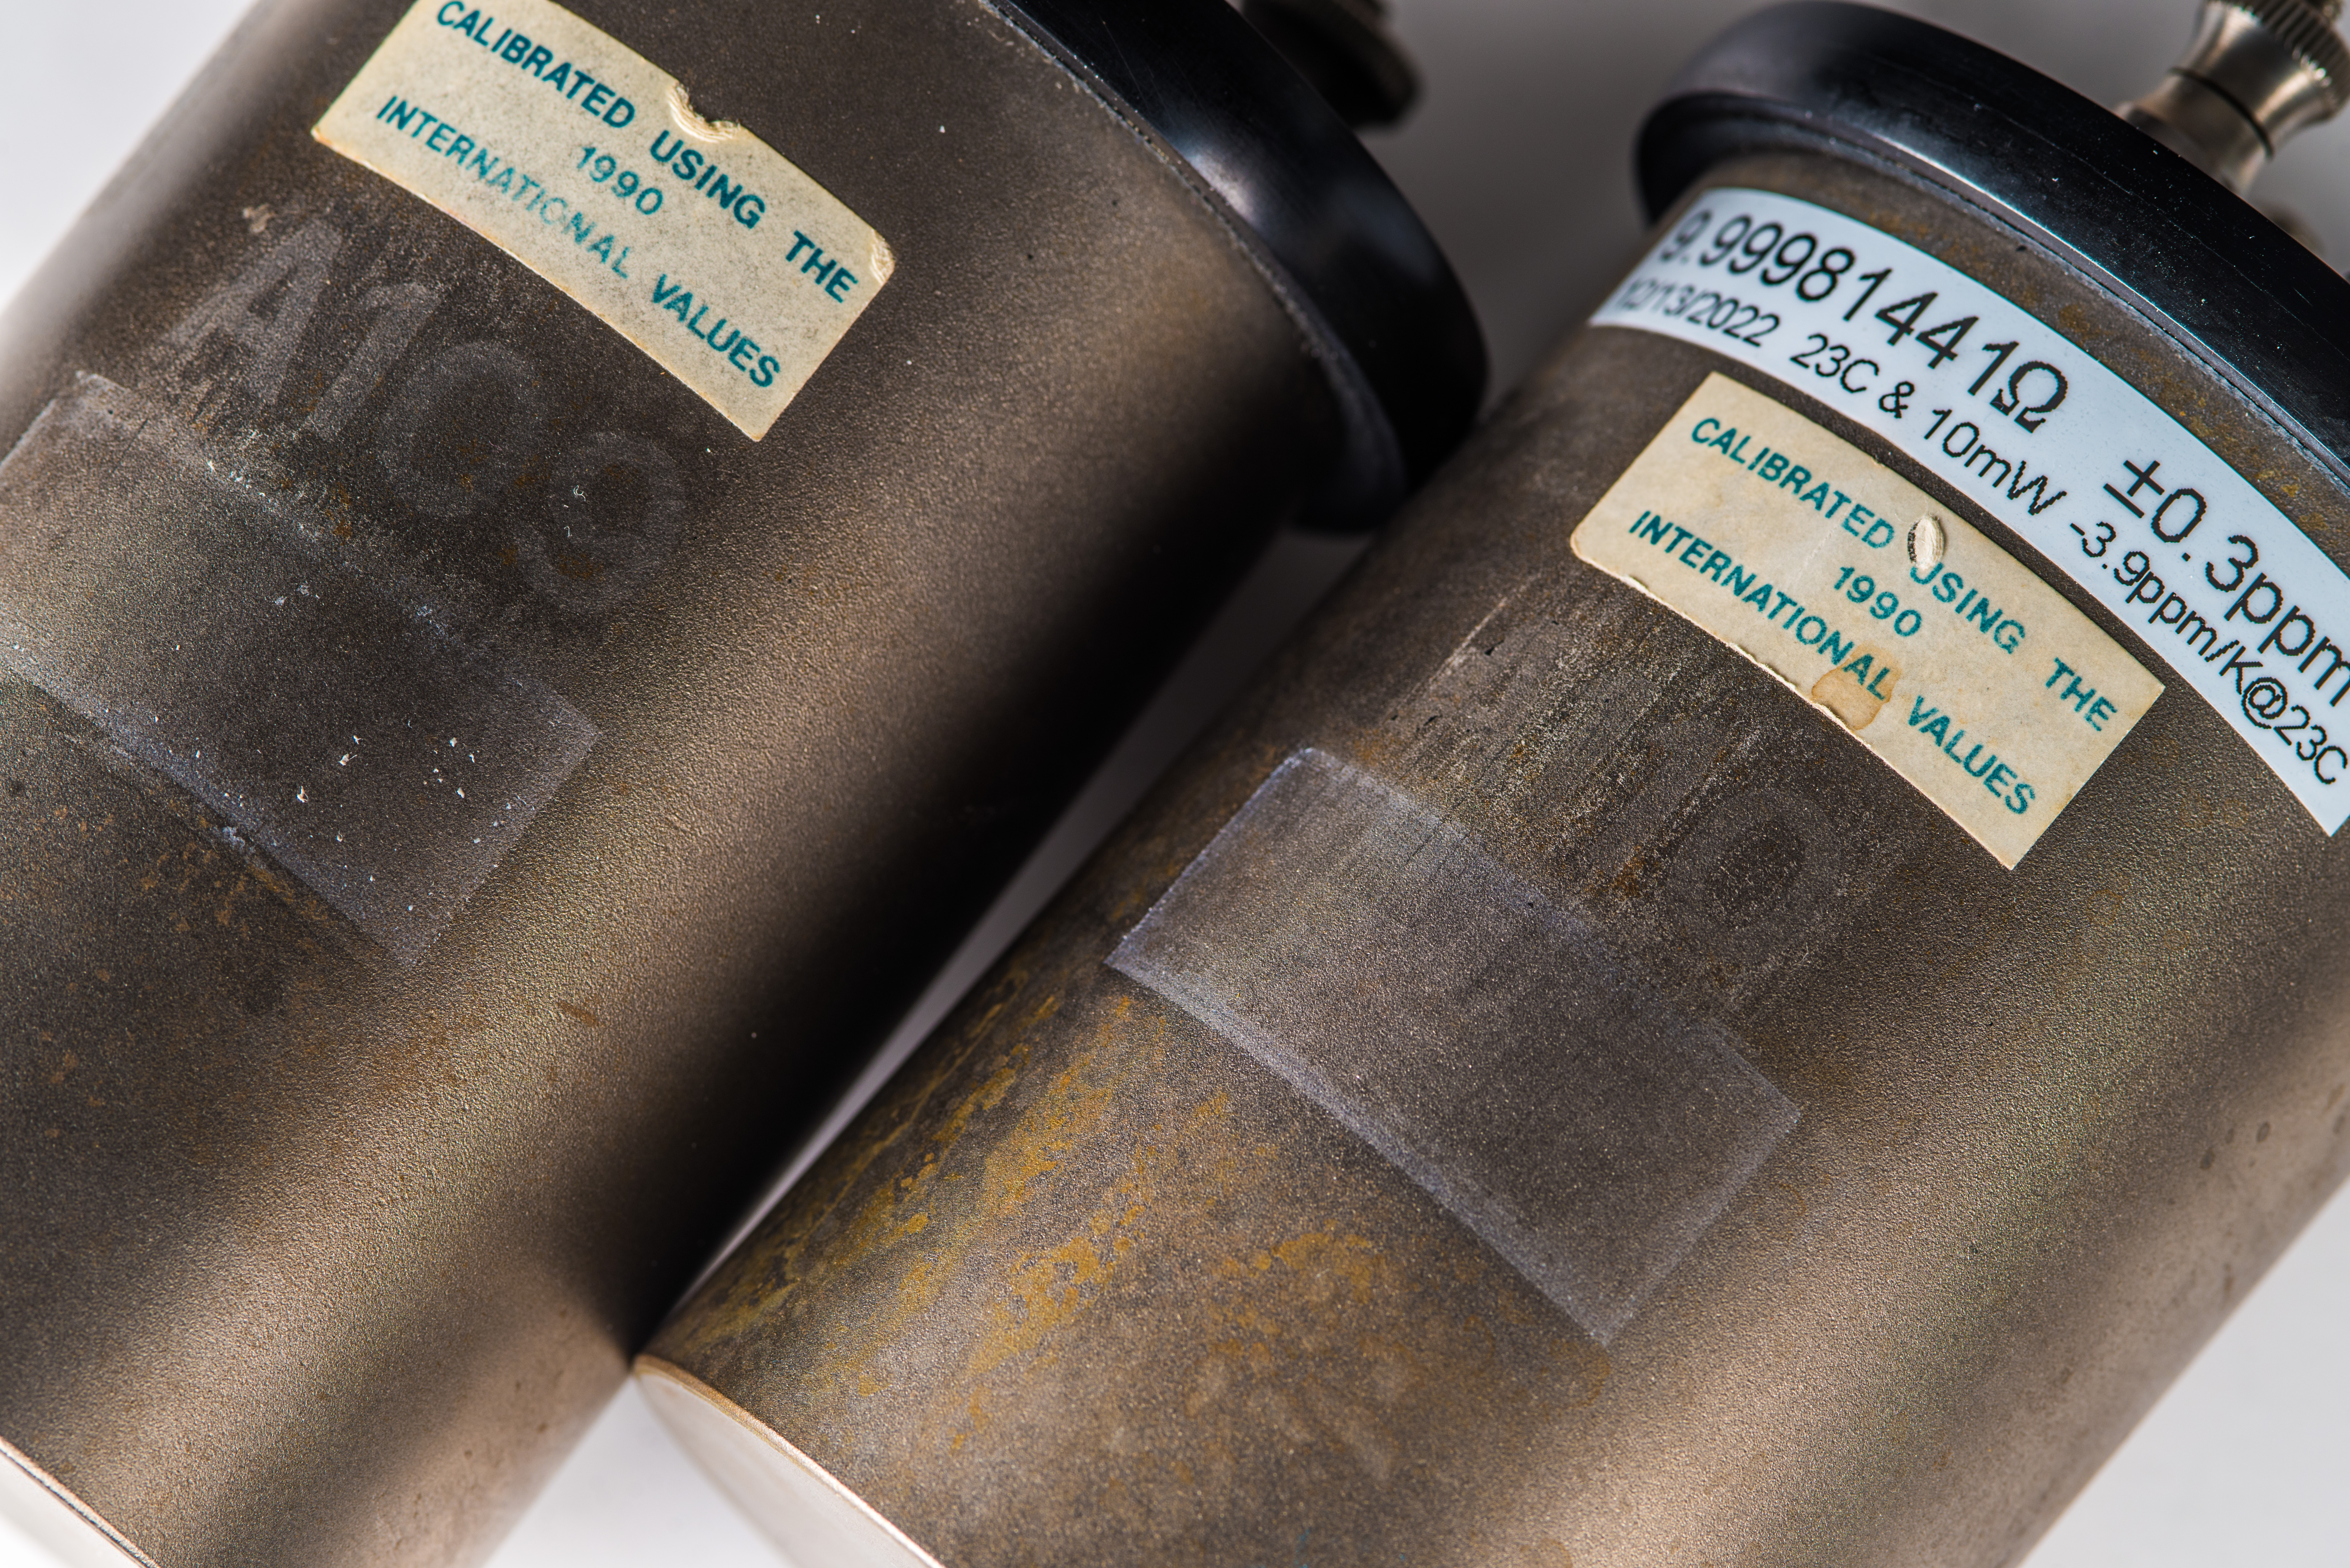
Image 6: Label residues on the body cans
Overall these Tinsley standards feel like glorified Guildline 9330 with better terminals, much larger thermal mass and better long term stability. They are however still best used in oil bath, like Fluke 7015 or similar due to quite noticeable TCR.
Tinsley 5685 and 5695 Resistance Standards, Datasheet
Tinsley year 2002 website archive with product catalog
Datasheet also shows low-res photograph of disassembled Tinsley 5685 resistor. Always good when manufacturer is confident in their product and actually does show internal design in official documentation. All resistors tested in this article supposed to be good and working, so there would be no invasive teardown this time around, sorry.
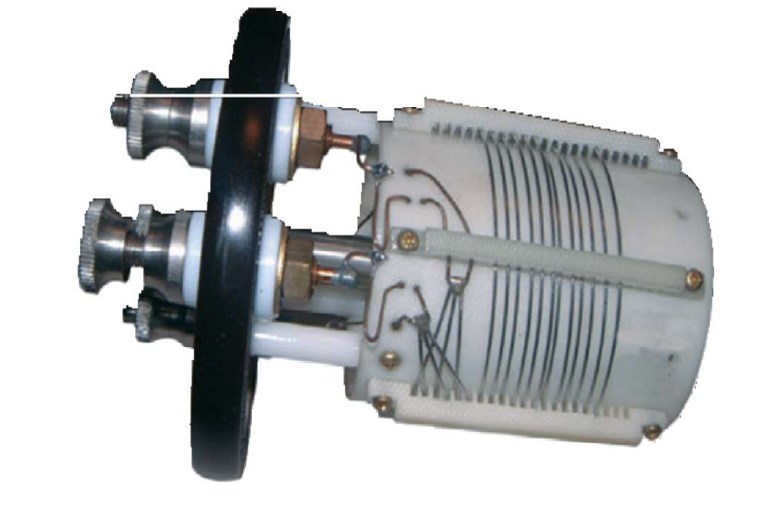
Image 7: Inner construction photo from datasheet
There is also interesting paper from NZ MSL on terminal issue discovered during measurements for CCEM-K10 ILC. Based on this paper terminals do not have orientation locking mechanism and rely on tightness of mounting between white PTFE insulator between top body plate and terminal itself.
Resistive coil with special alloy wire is loosely wound with bifilar method on fiberglass bobin.
Tinsley 5685A 1 Ω resistance standard, S/N 262249
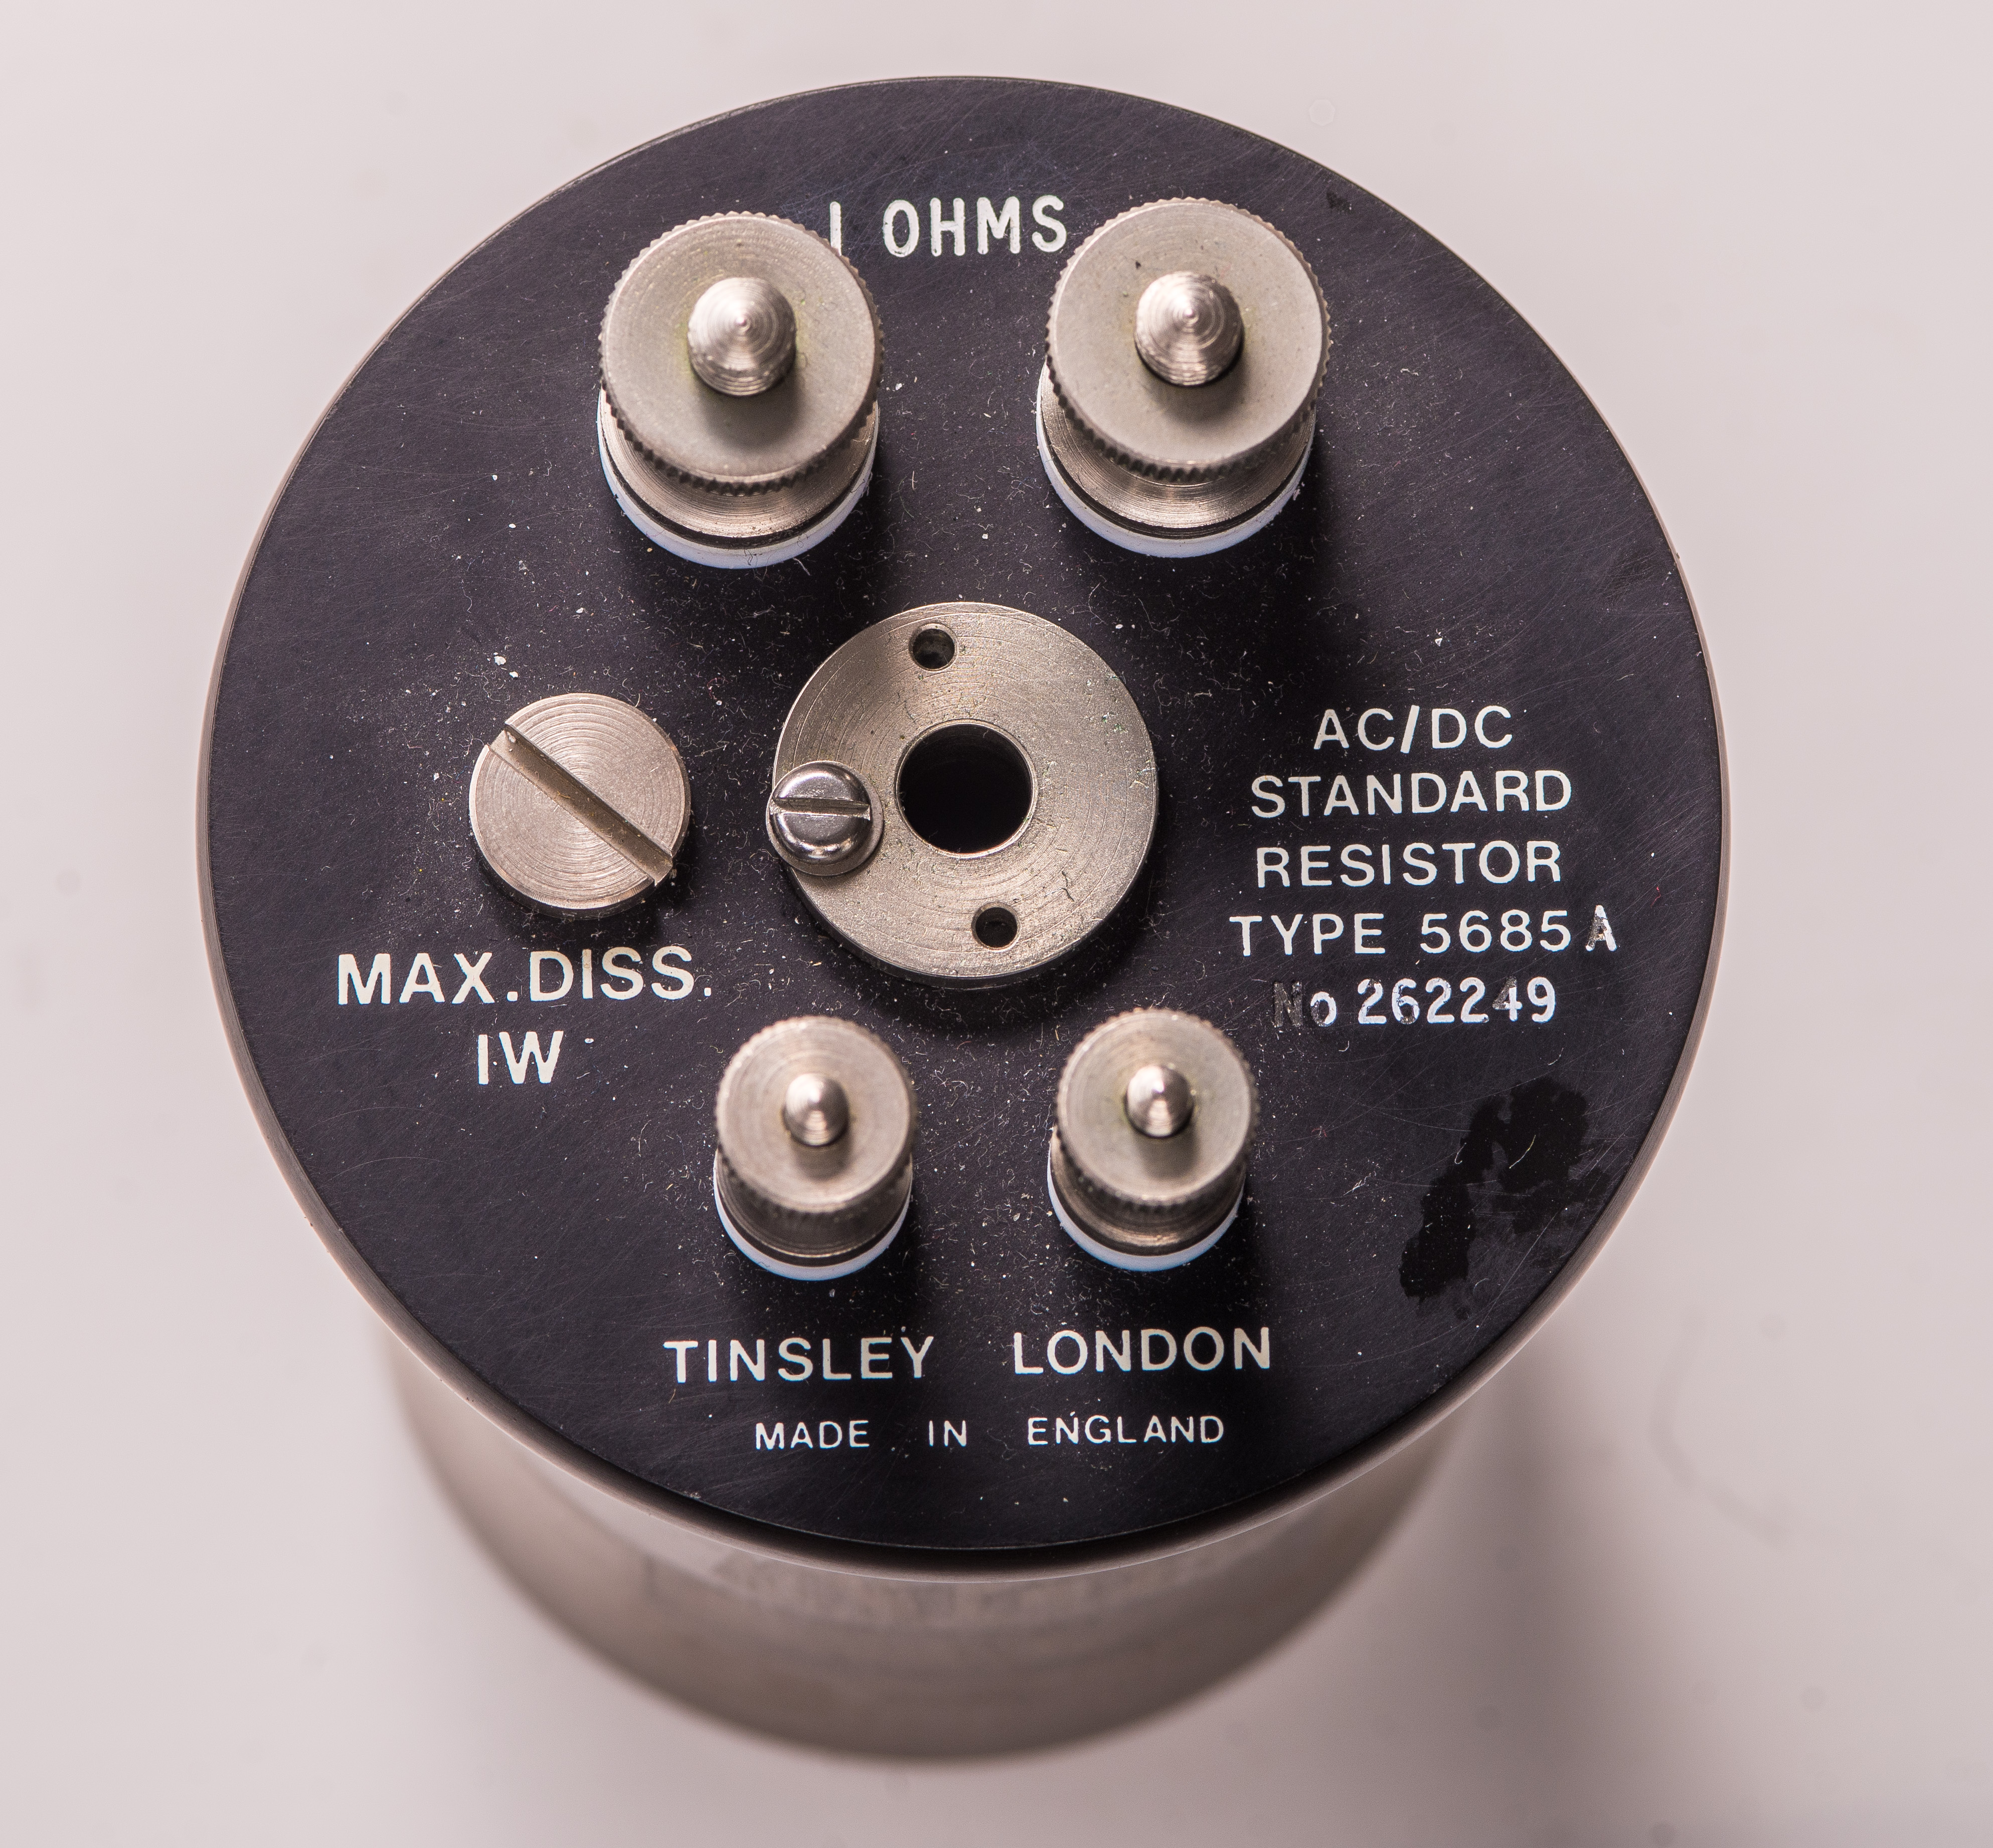
Image 8: 1 Ohm 5685A1 standard top plate
This standard has serial number 262249. Construction and design is exactly same as two other resistance standards.
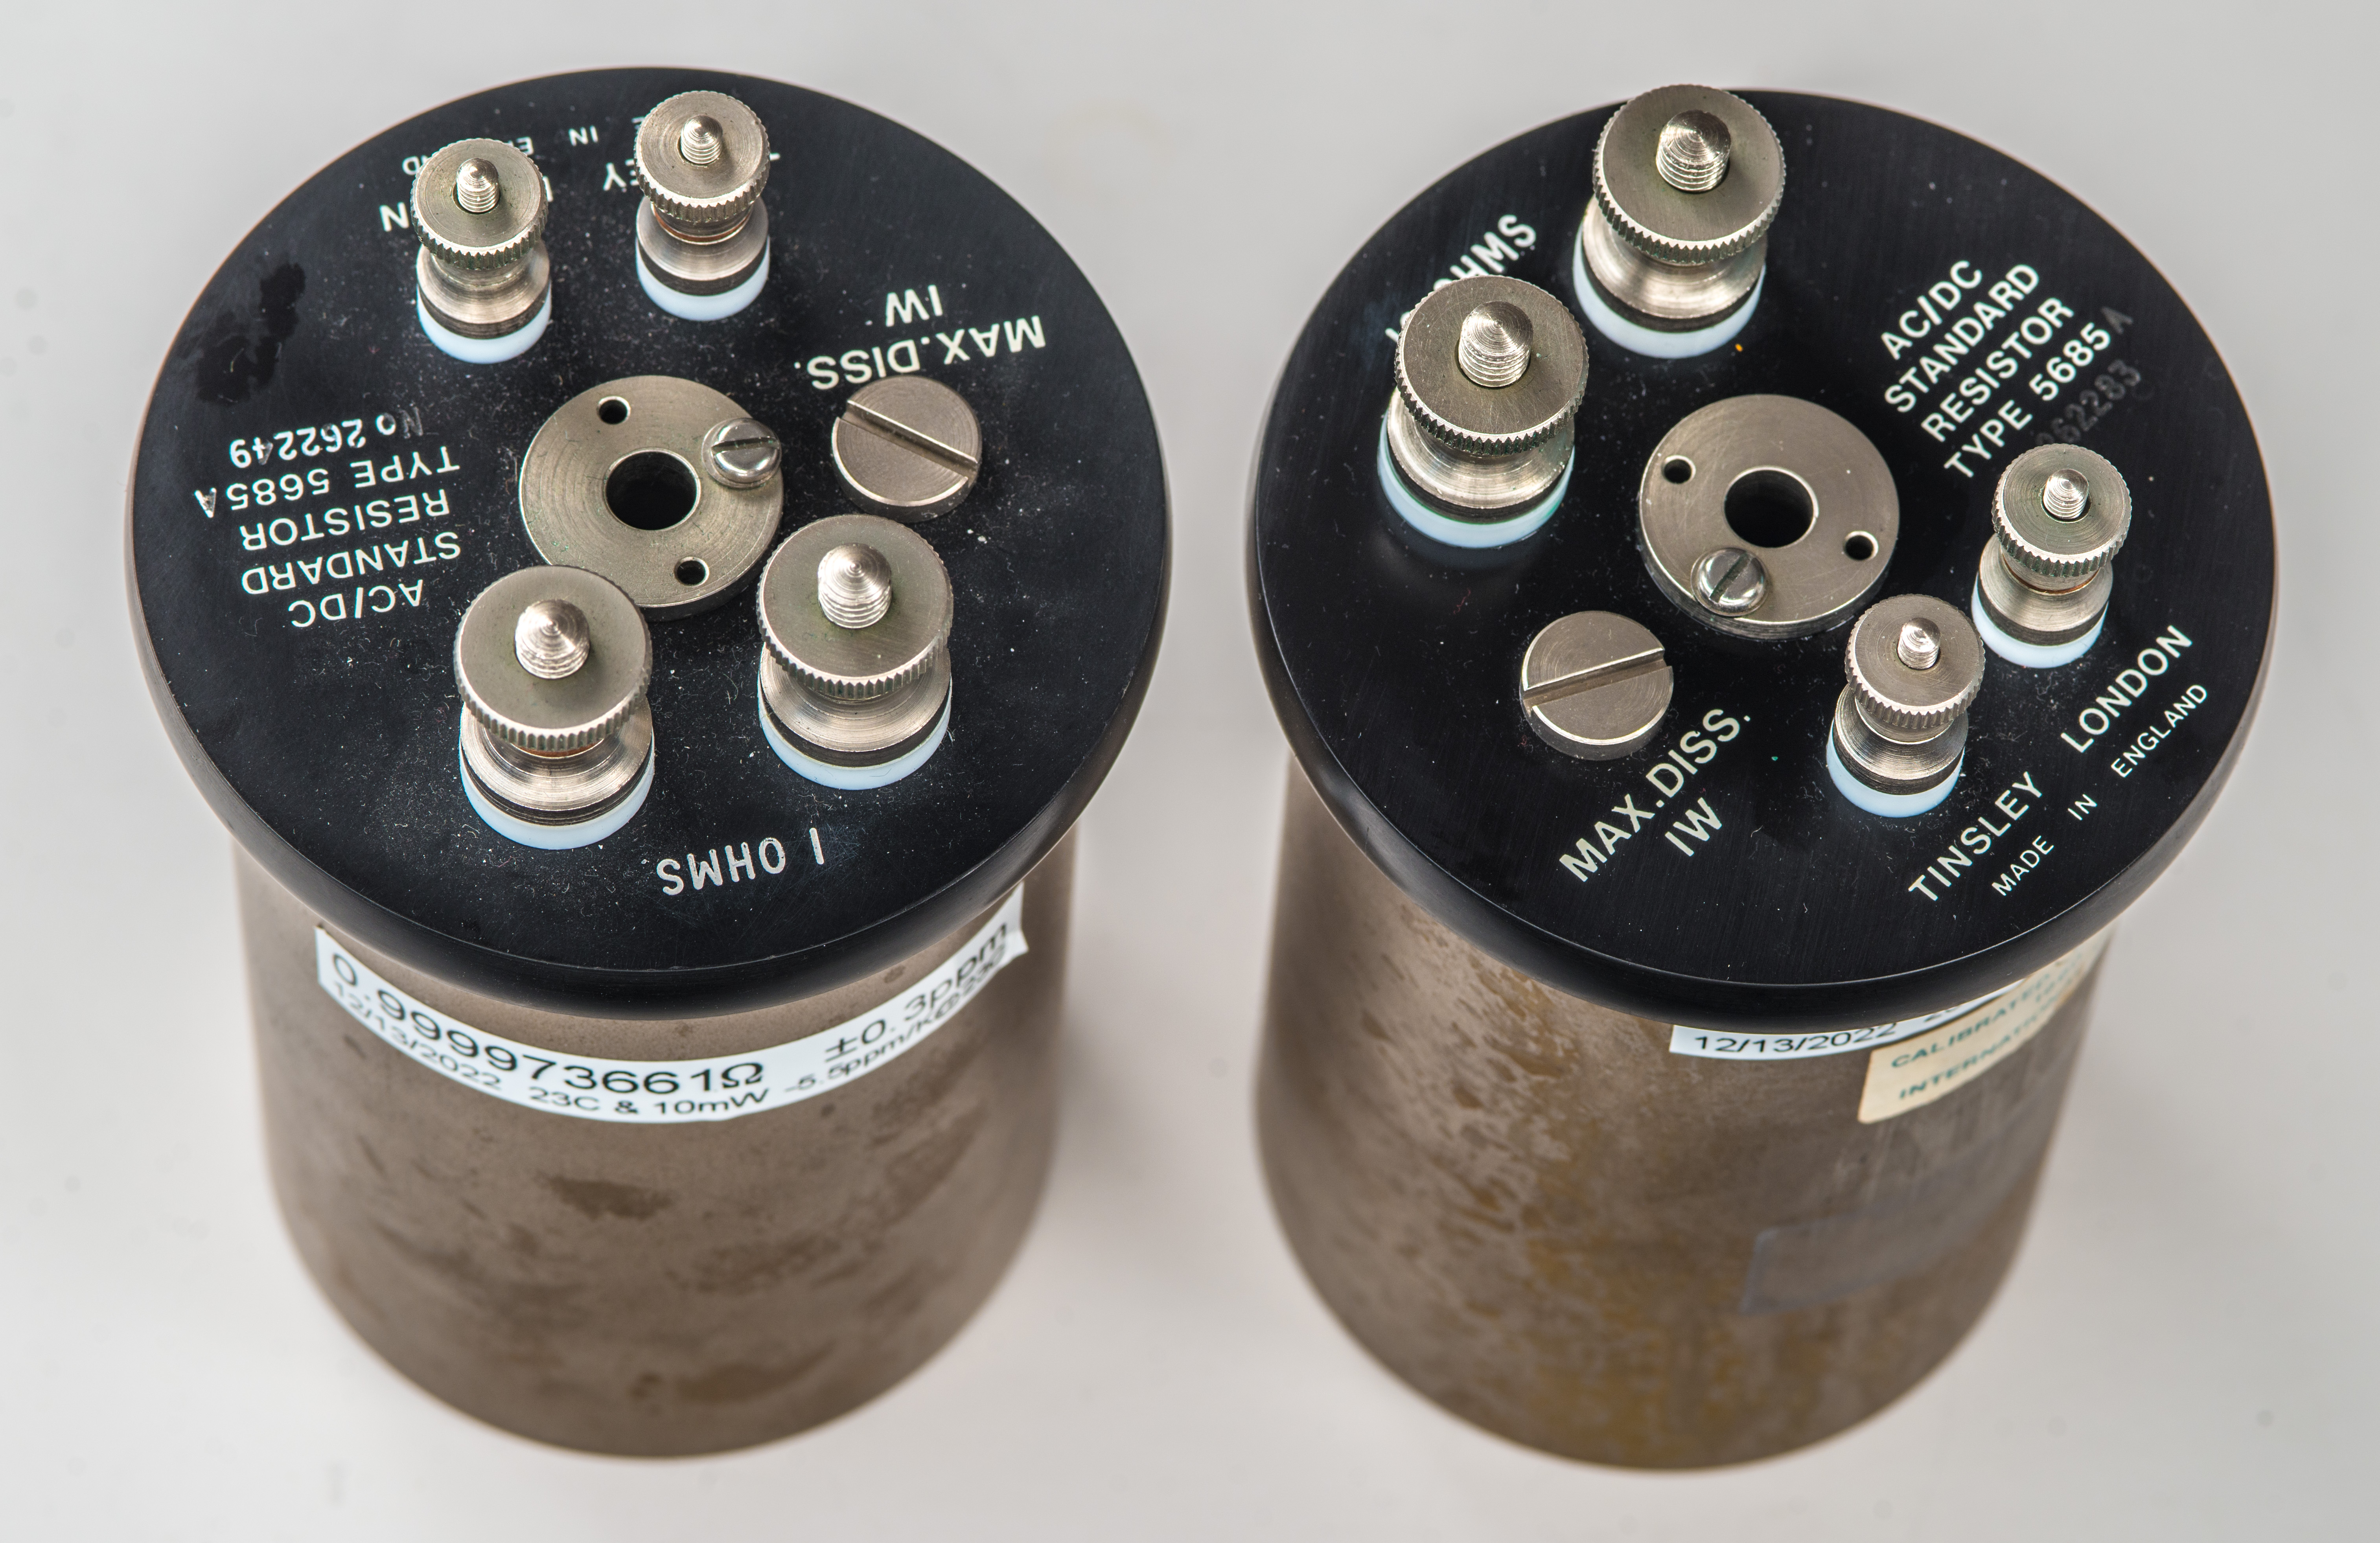
Image 9: 1 and 10 Ω standards together
Tinsley 5685A 10 Ω resistance standard, S/N 262283
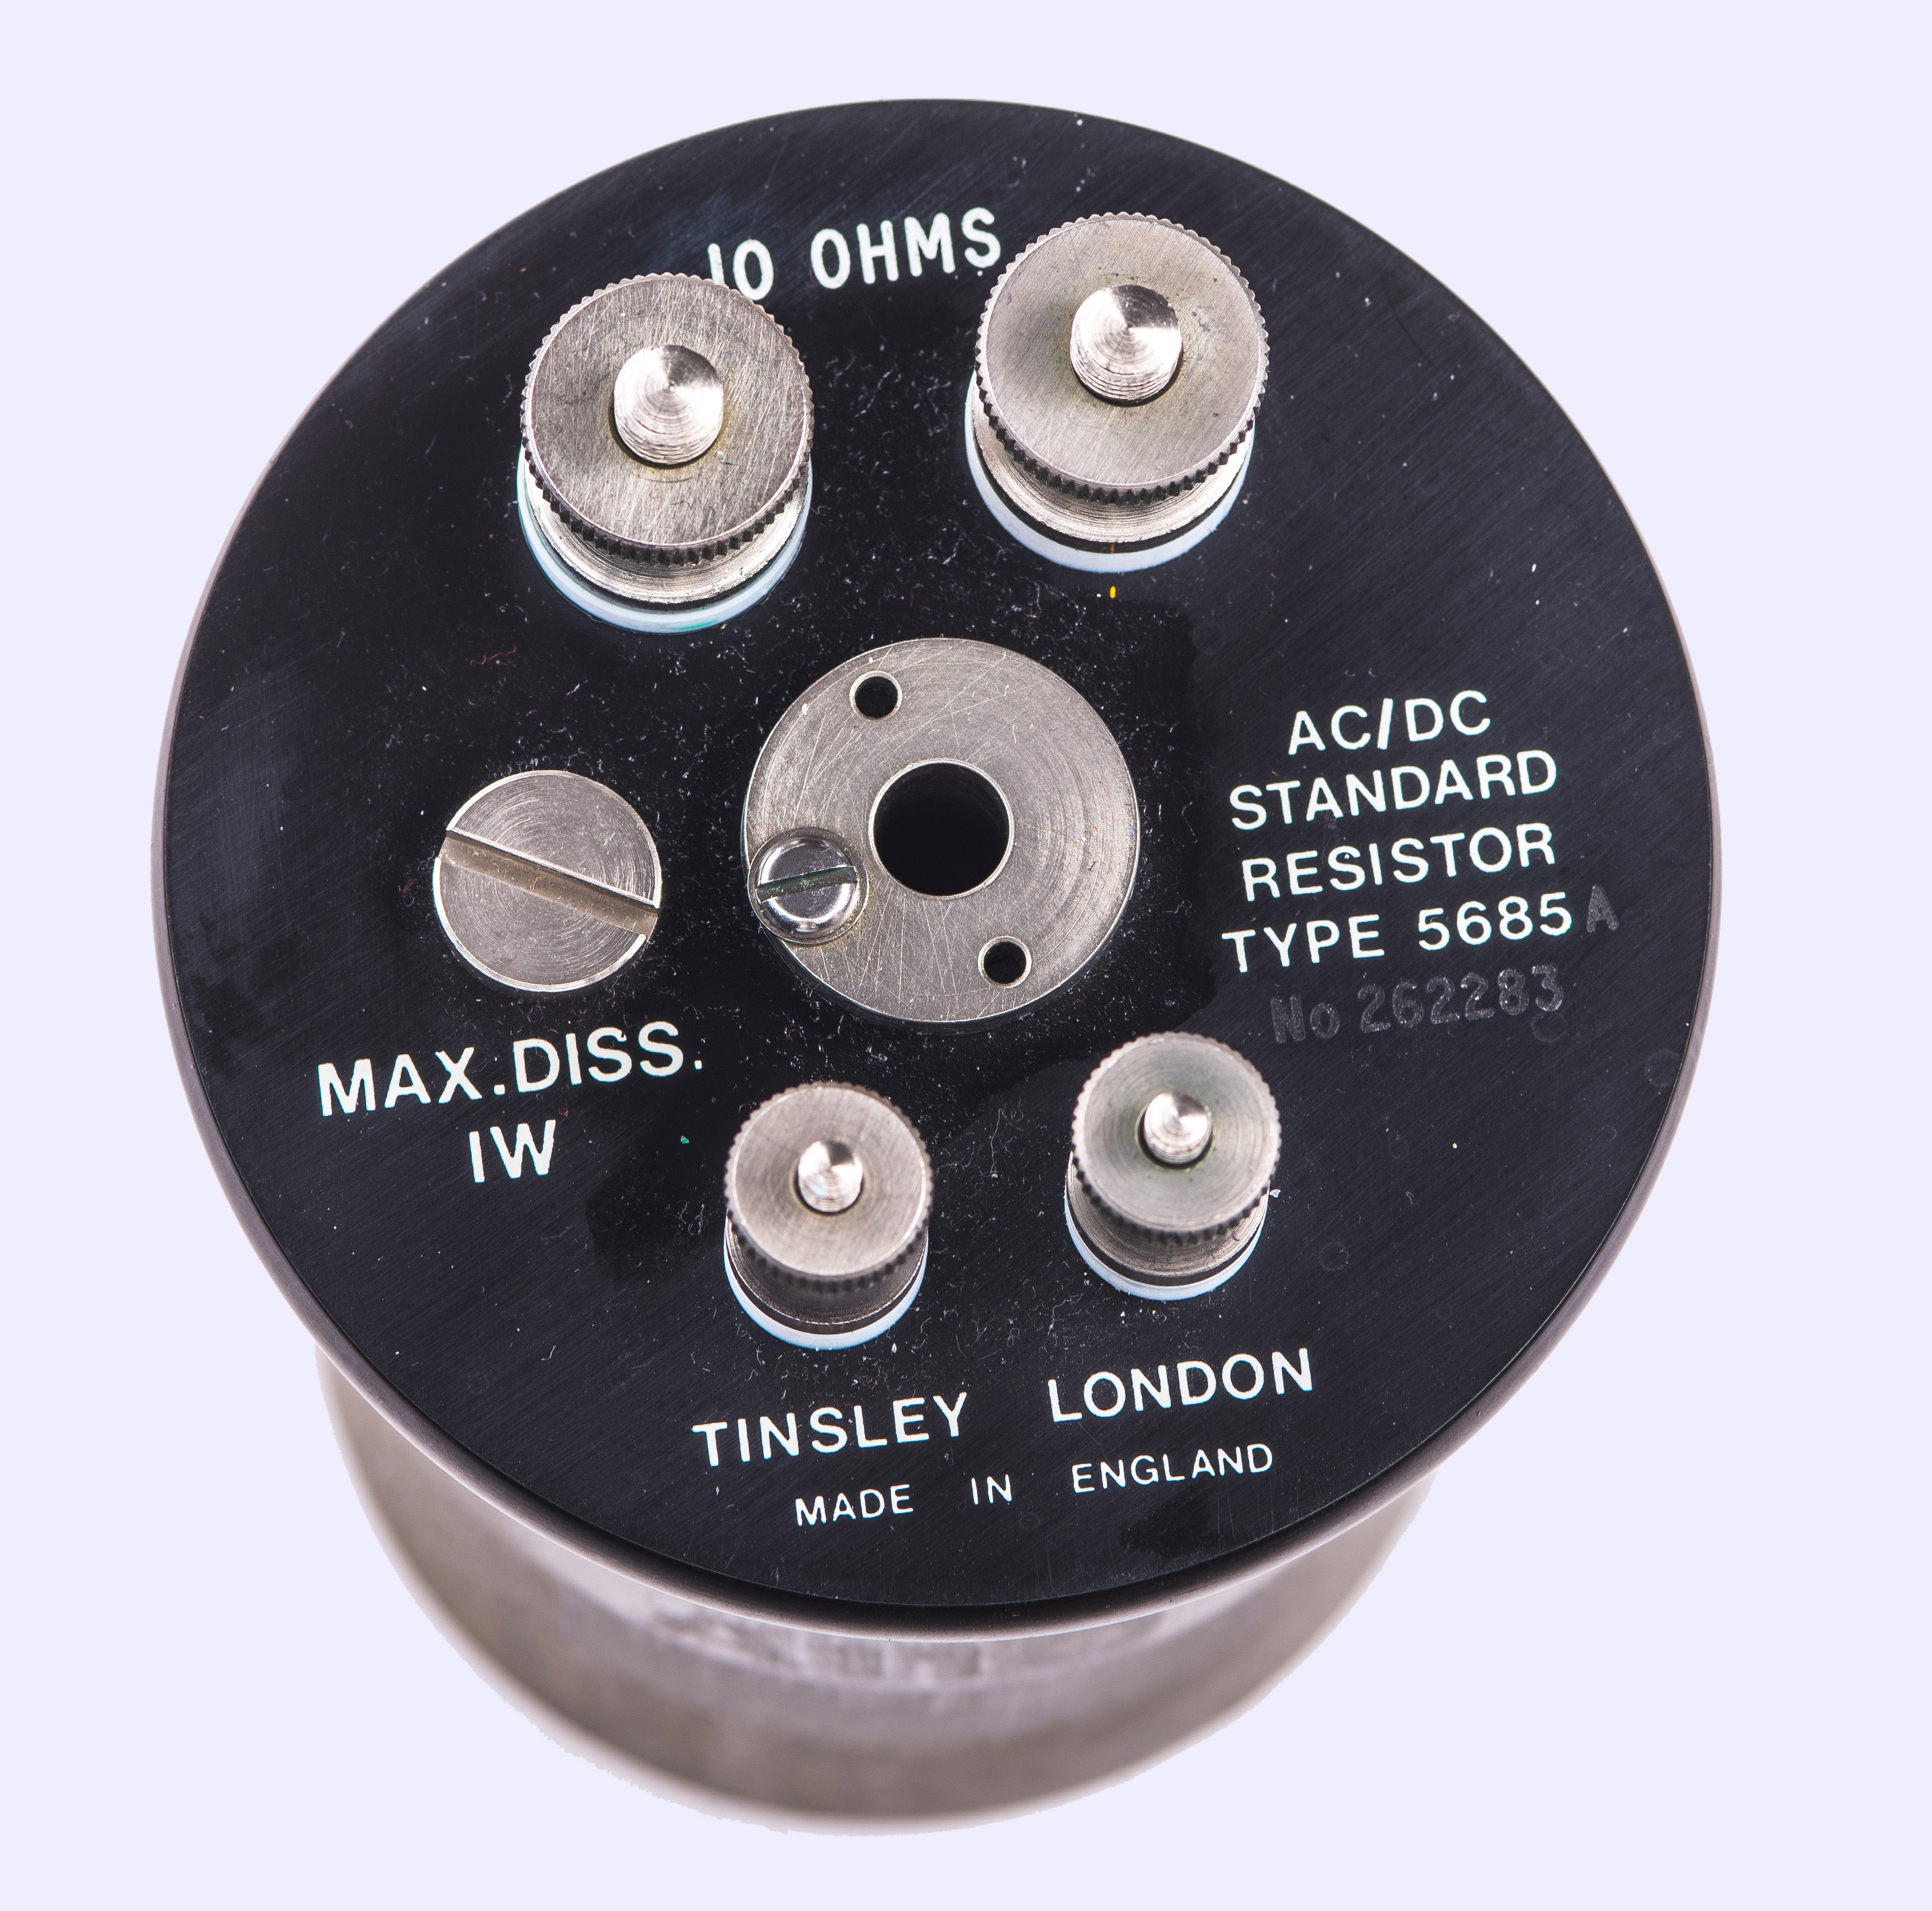
Image 10: xDevs.com’s Tinsley 5685A2 unit
Since this resistor is in xDevs’s ownership now, we can be more proactive to clean it up a bit from decades of dirt. No disassembly though, since it’s still functional unit.
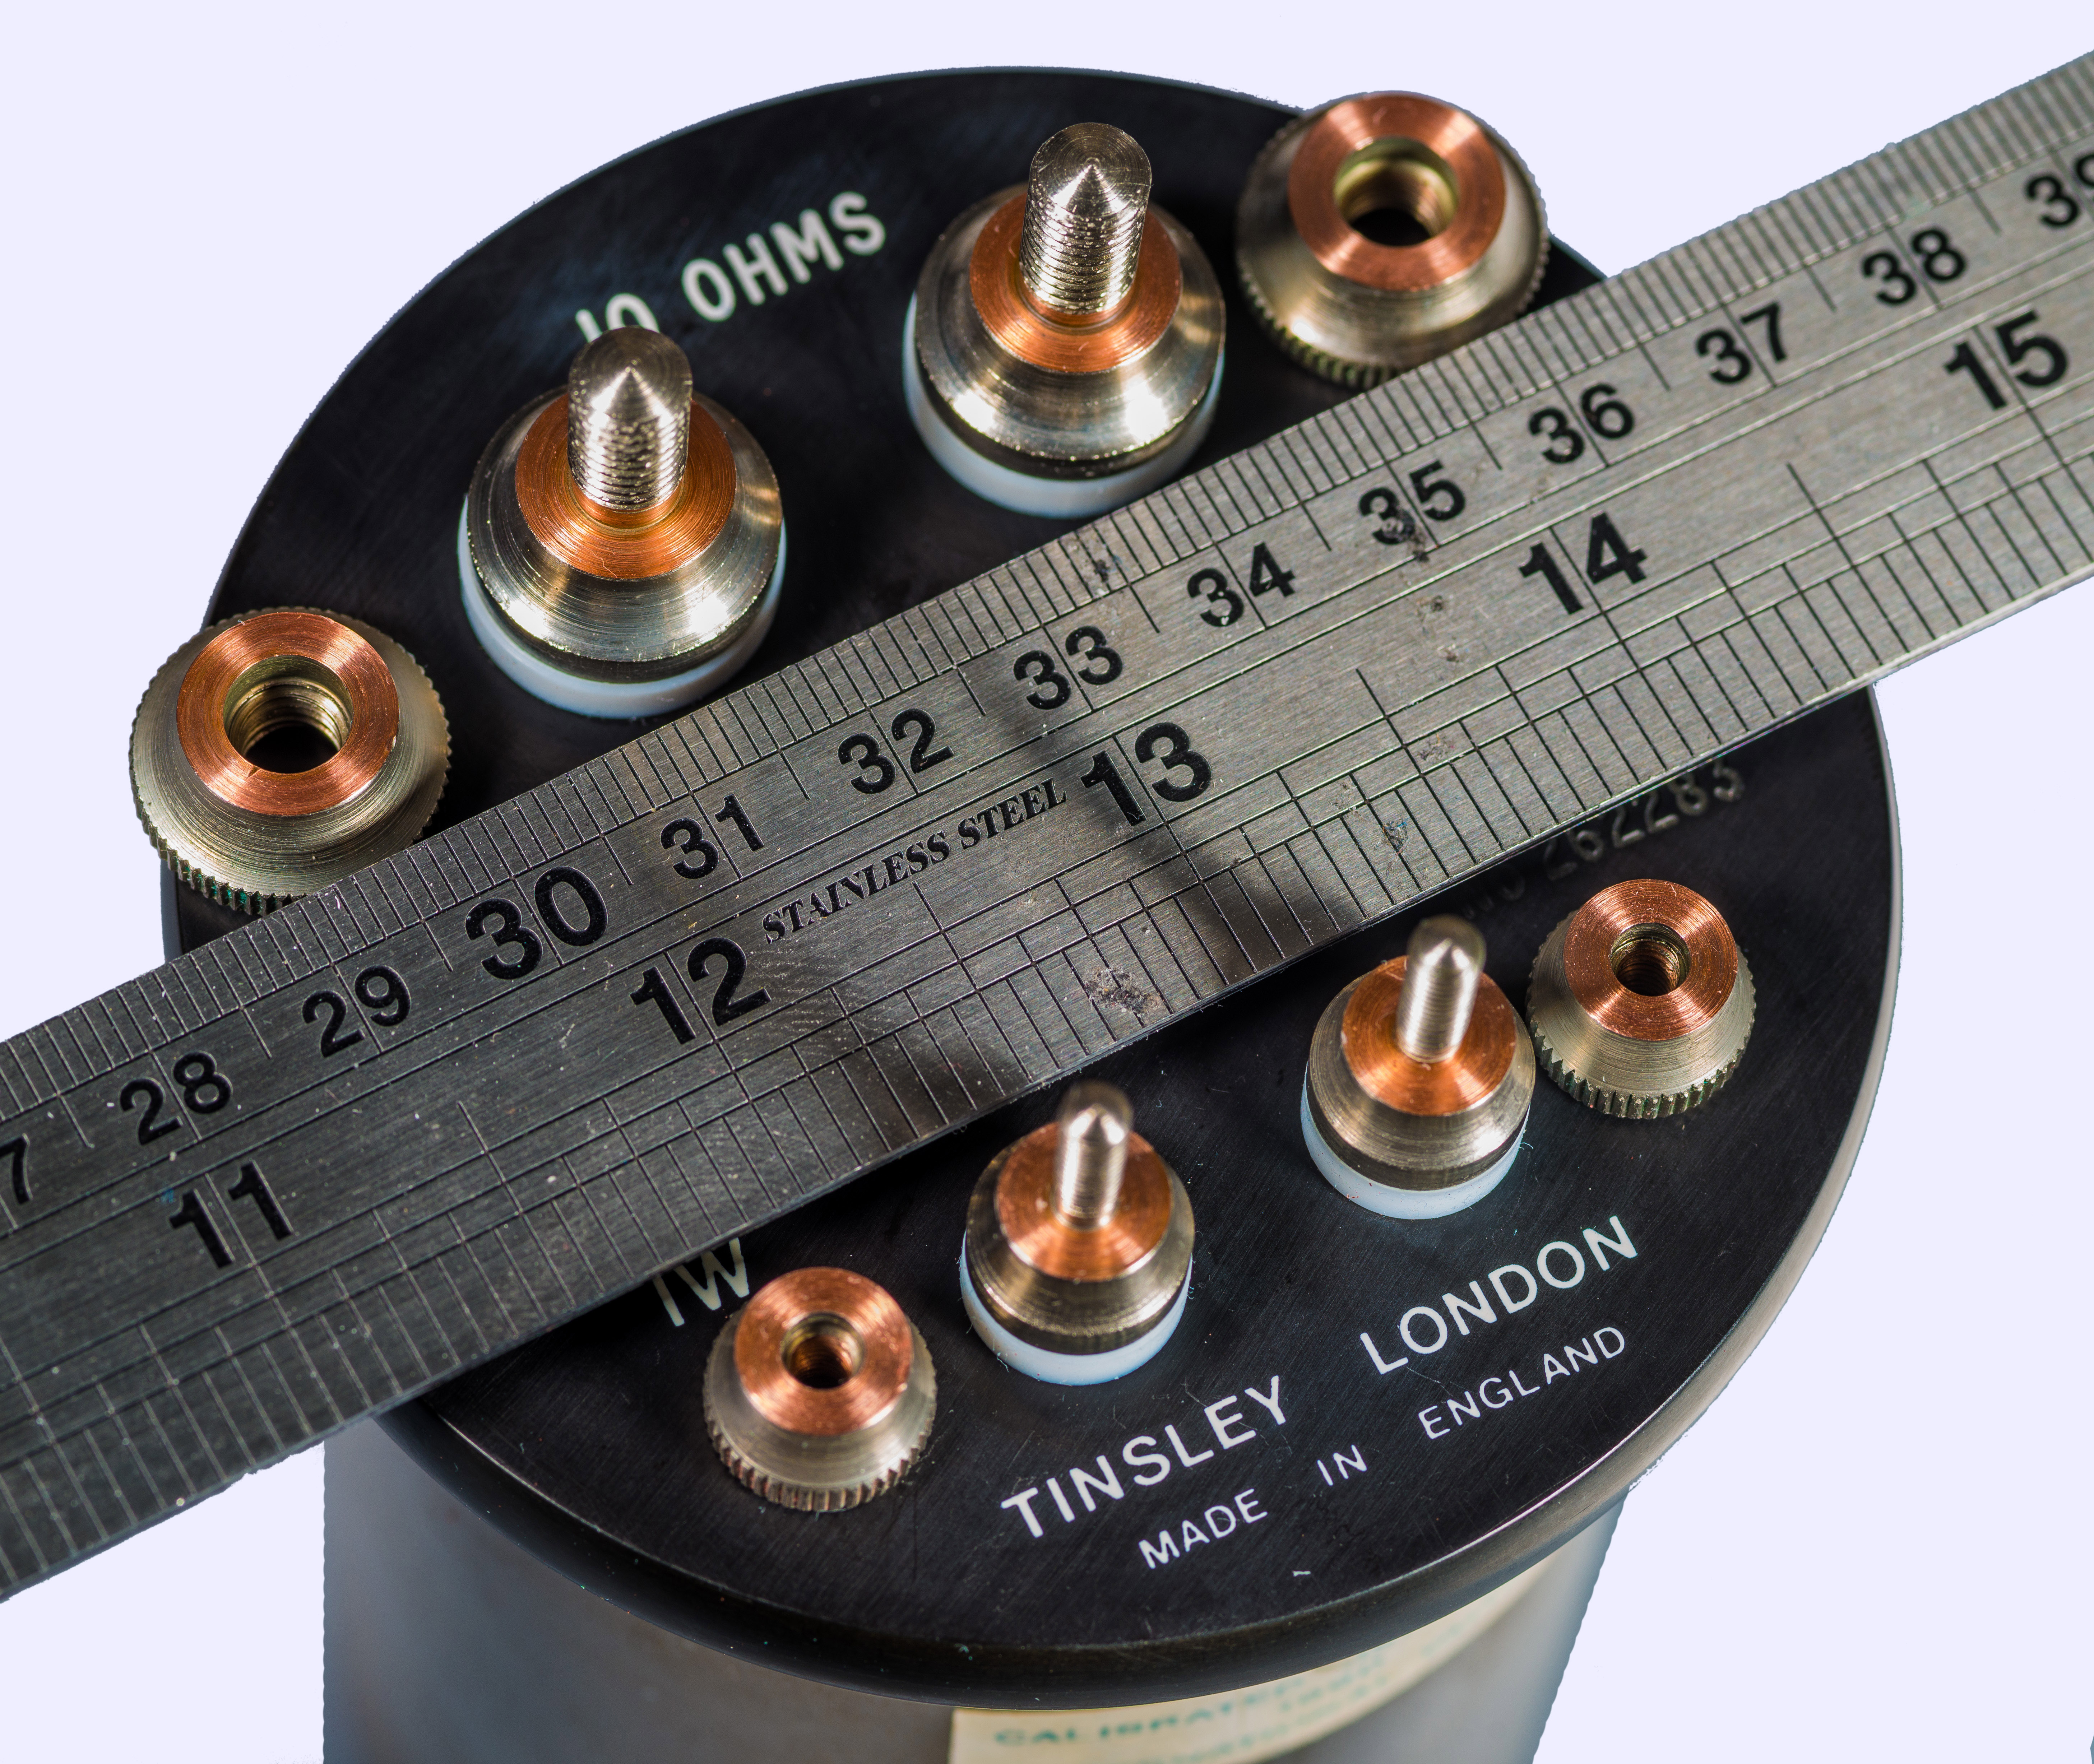
Image 11: Terminal top nuts removed for cleaning
Also removing screw plug next to thermometer well shows rubber O-ring gasket that seals oil fill port. No oil leaking from either of three Tinsley units during this article work.
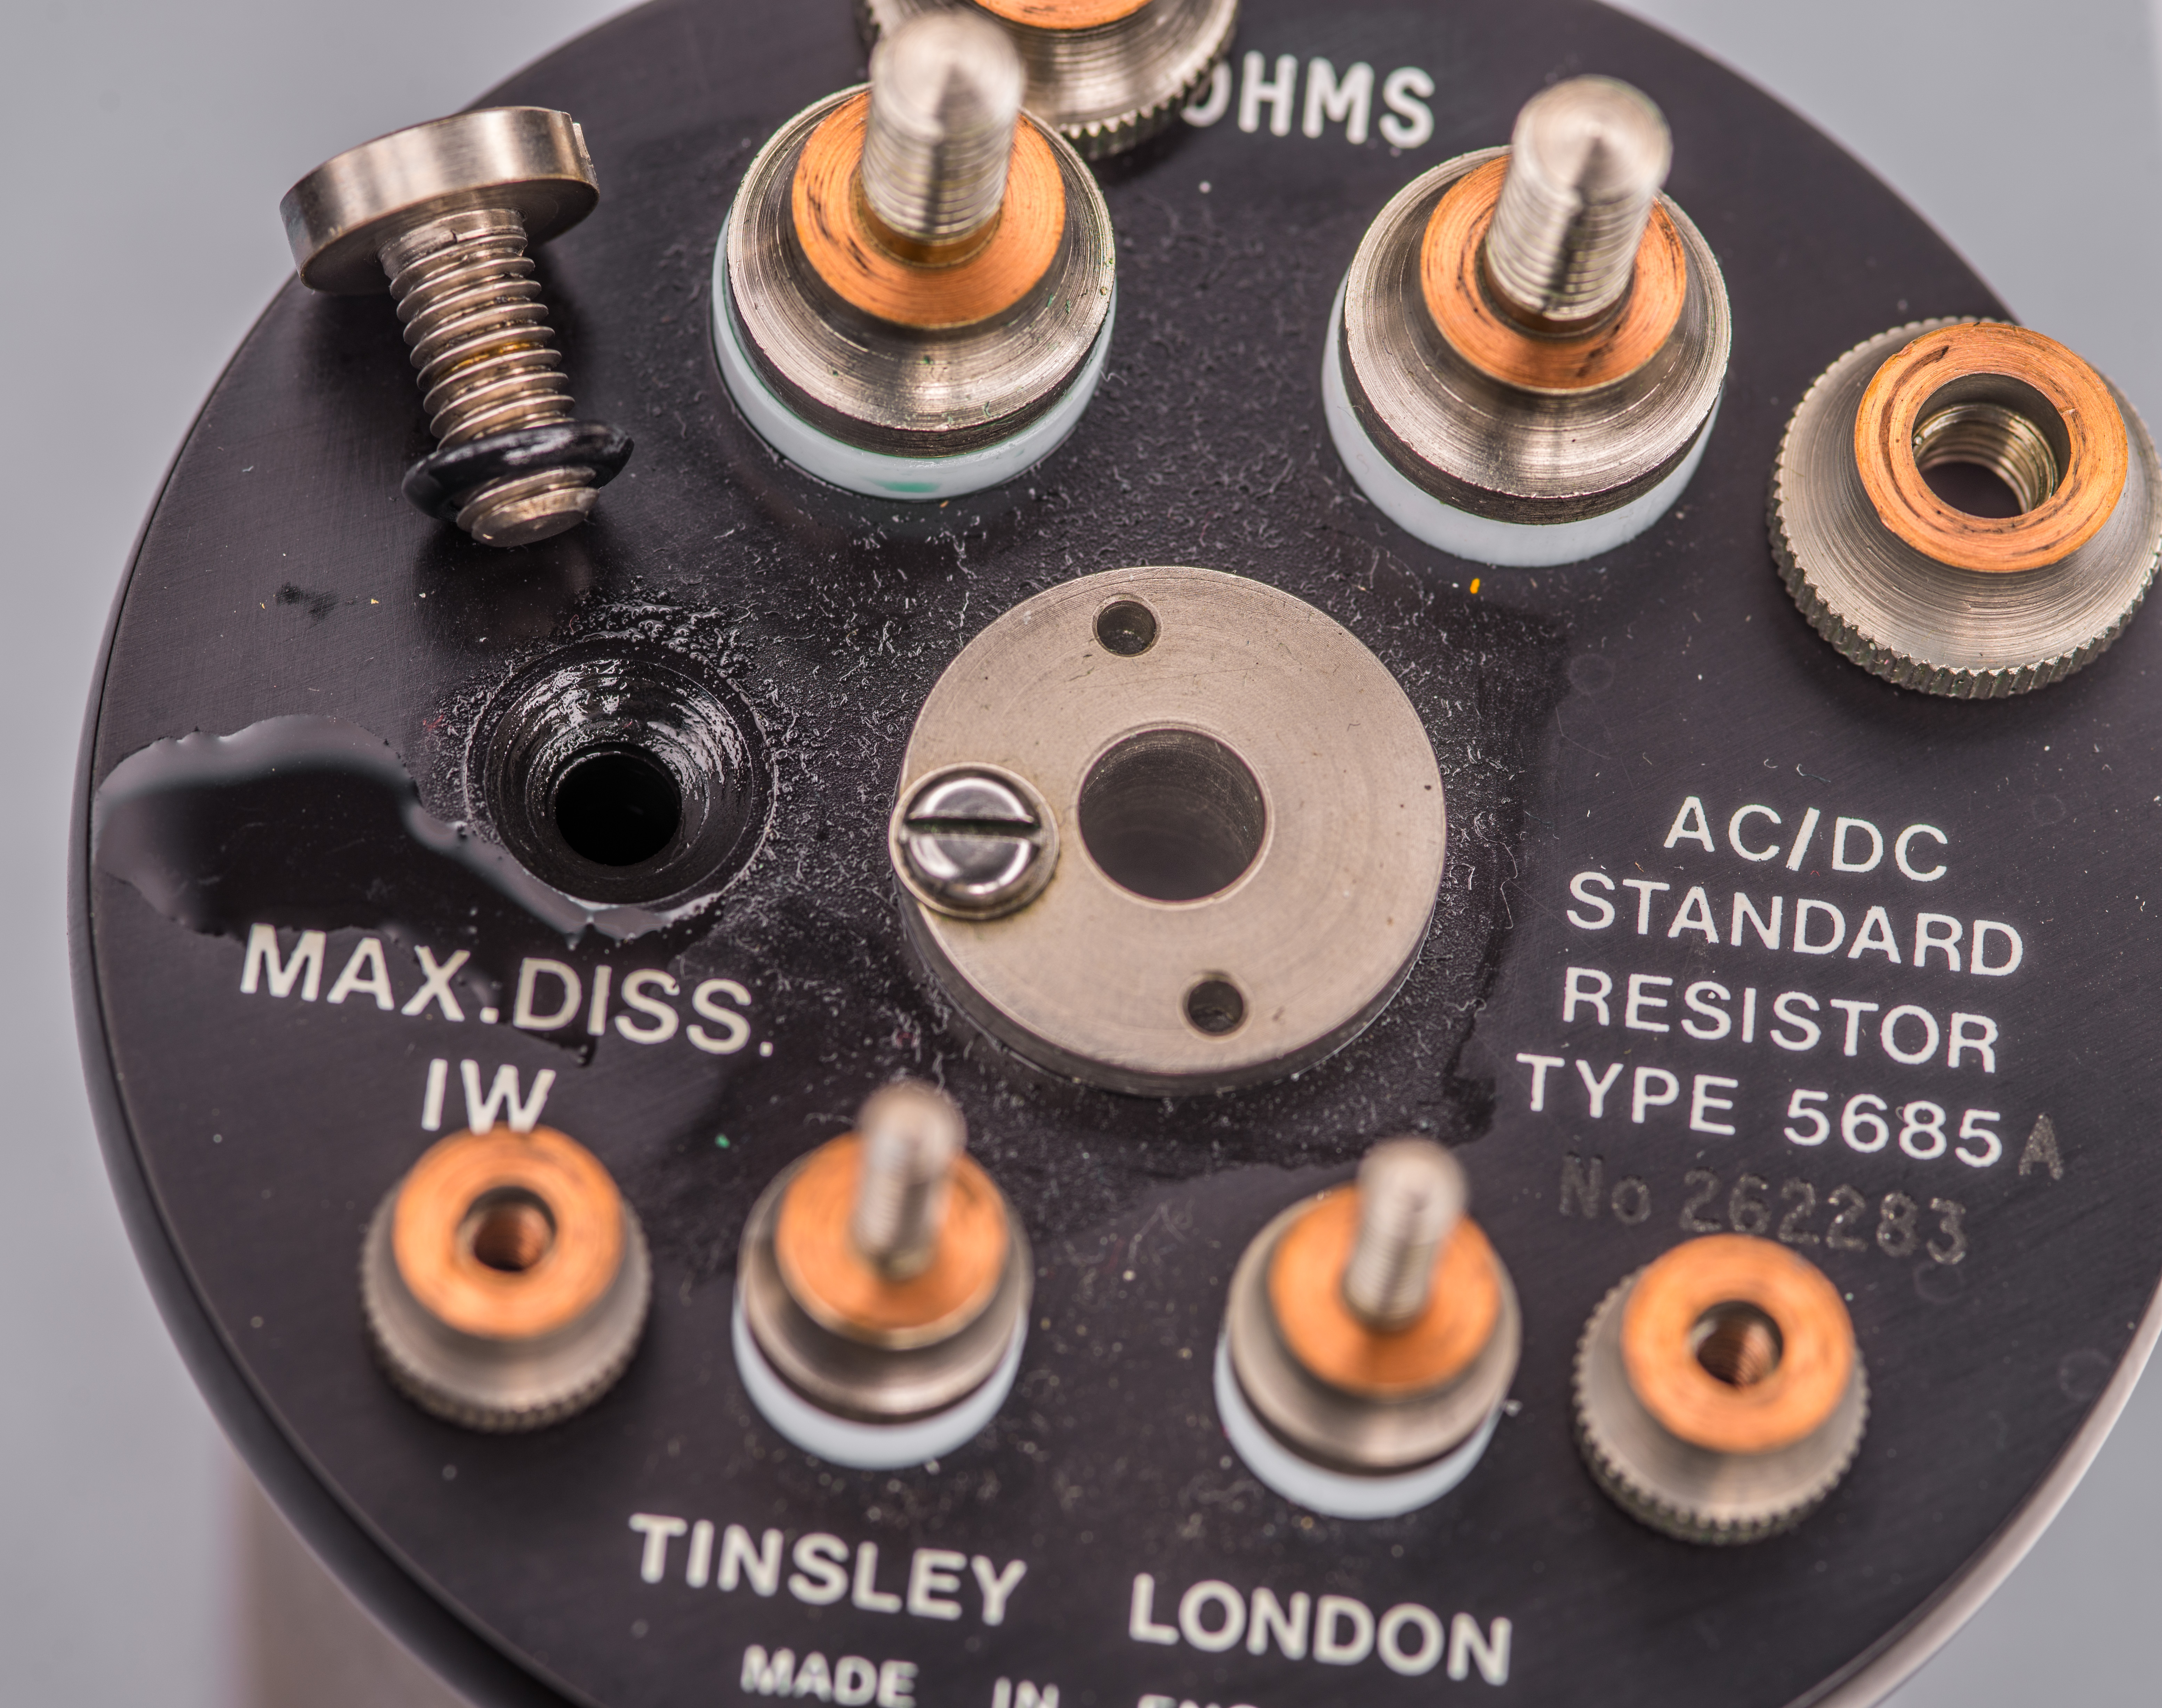
Image 12: Oil plug bolt is removed to check condition of the oil fill
Oil in 10 Ω standard is filled almost all the way up to the fill port. Testing oil with paper reveals good transparent oil with medium viscosity and no color. Oil has faint smell typical for synthetic oils. Based on this evaluation no oil replacement was deemed necessary. With orientation change quiet oil sloshing could be heard in each of standards.
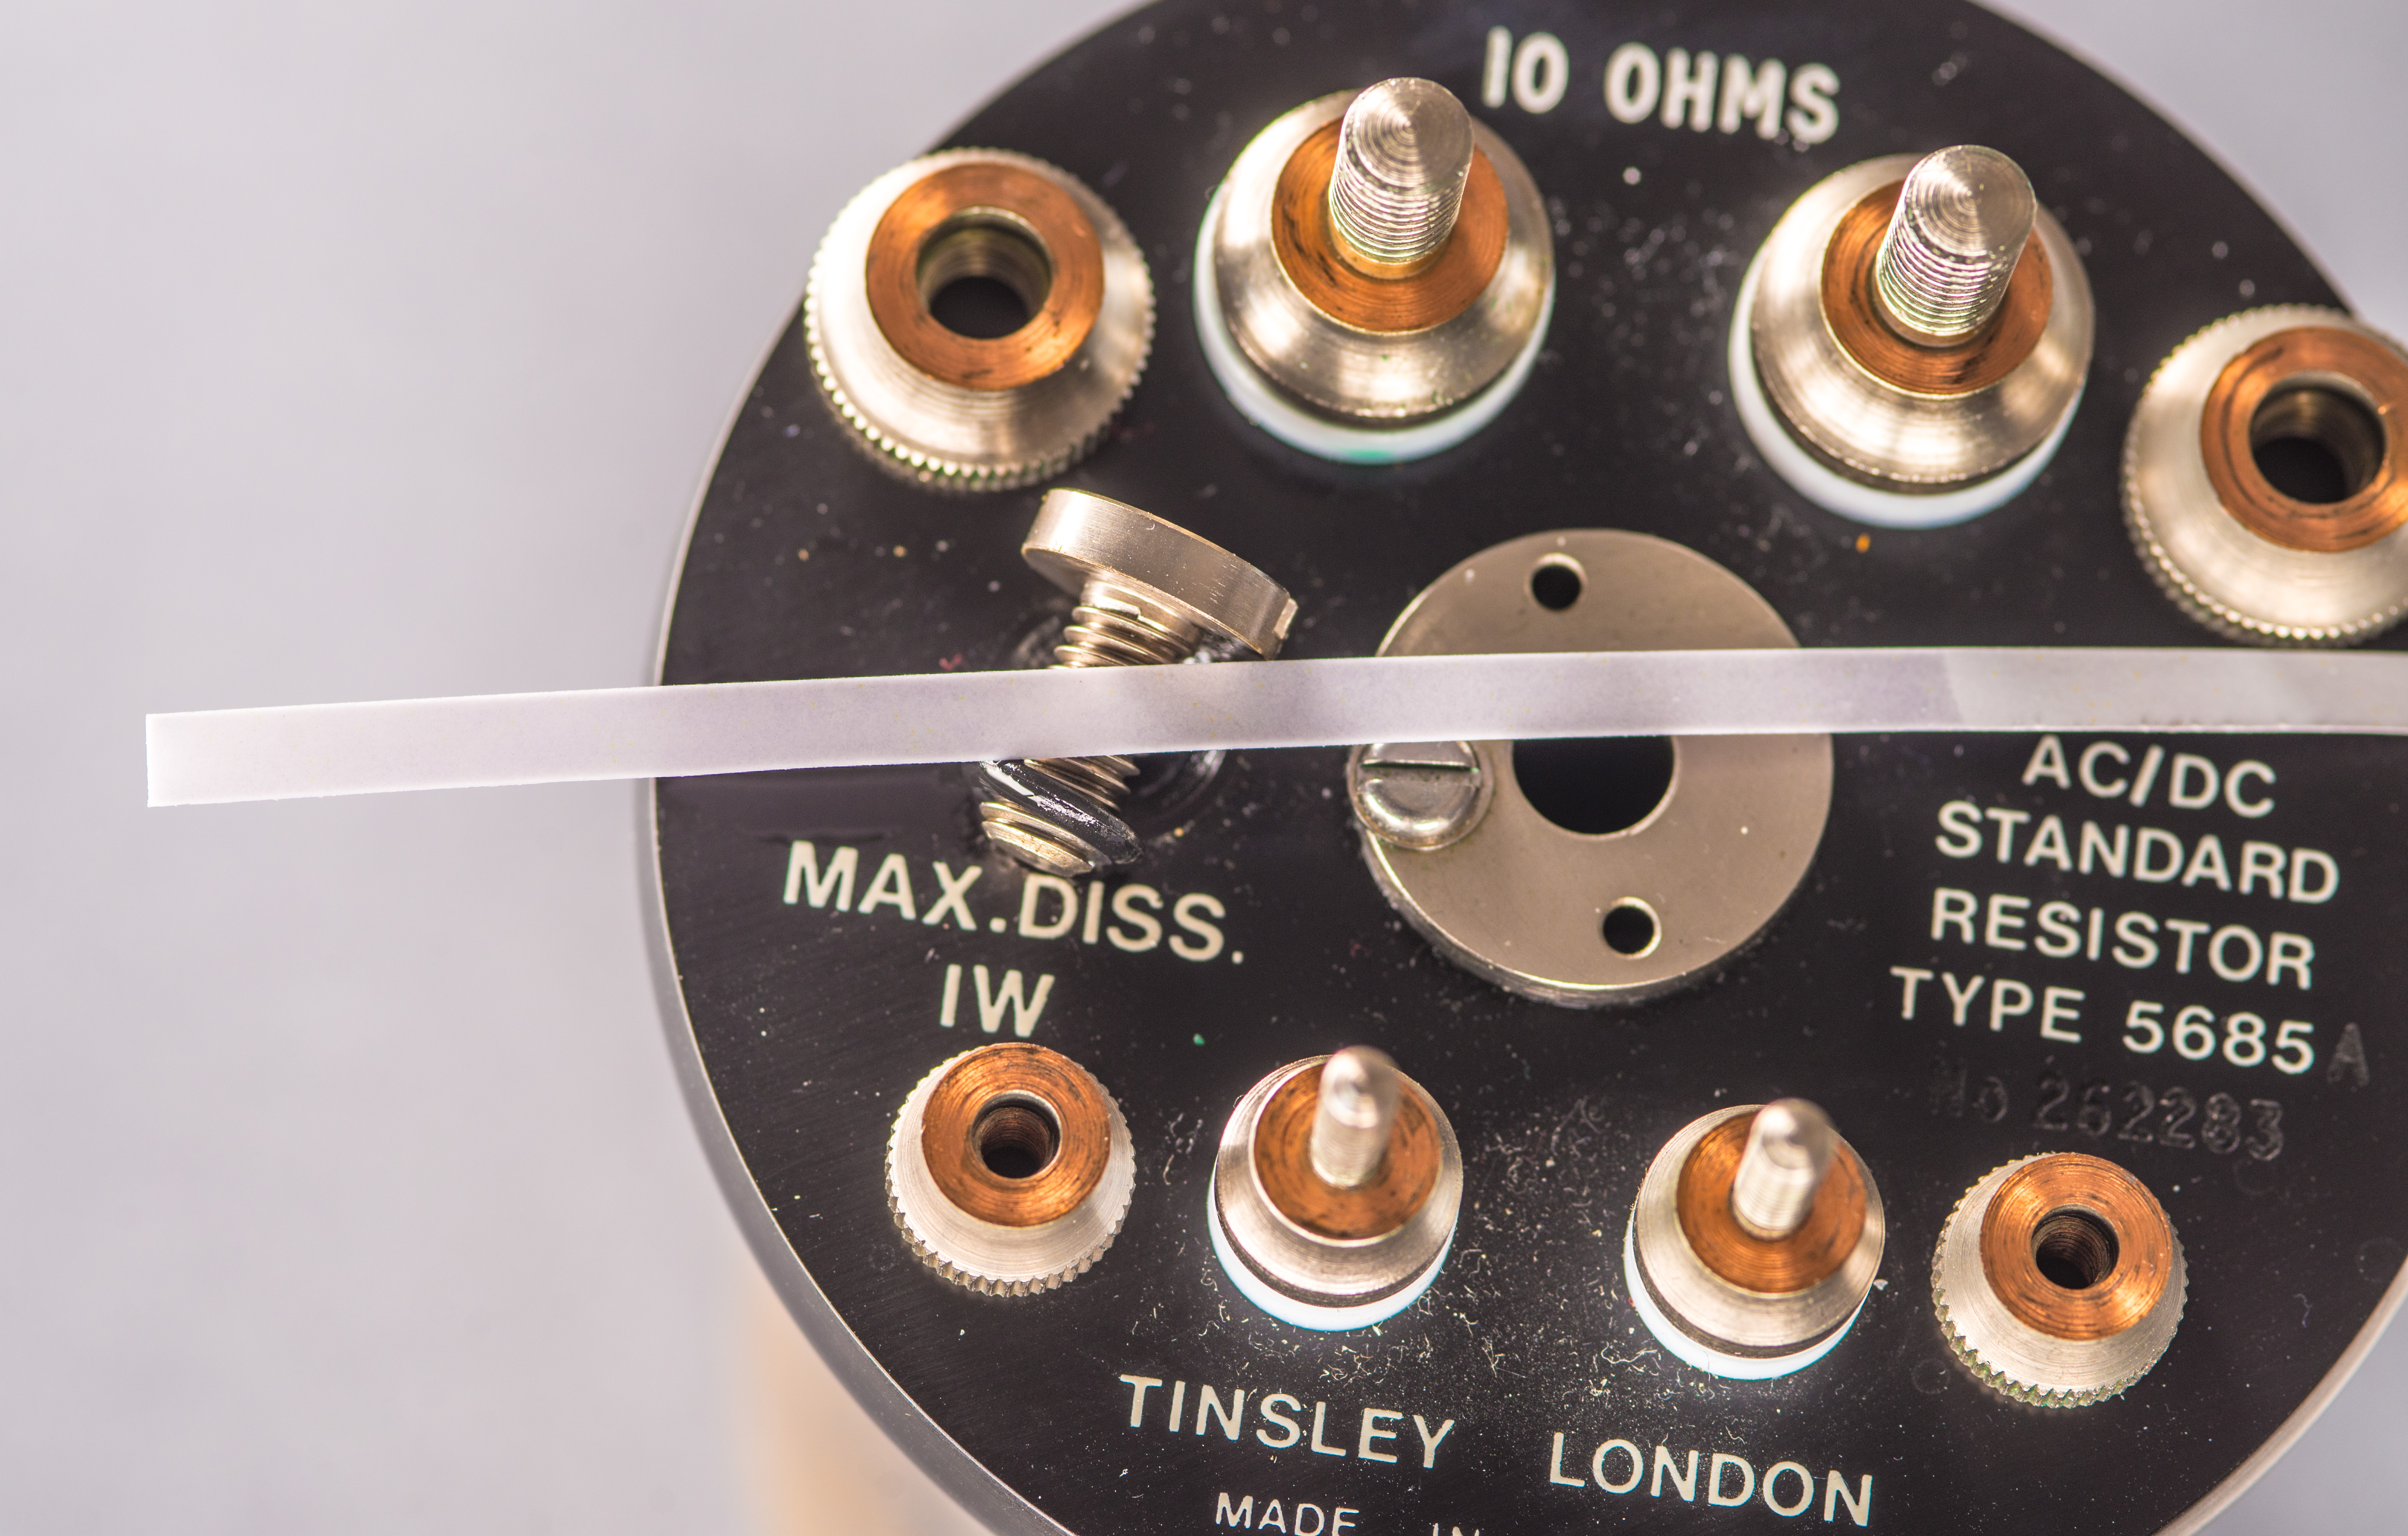
Image 13: Test paper with clean oil on it
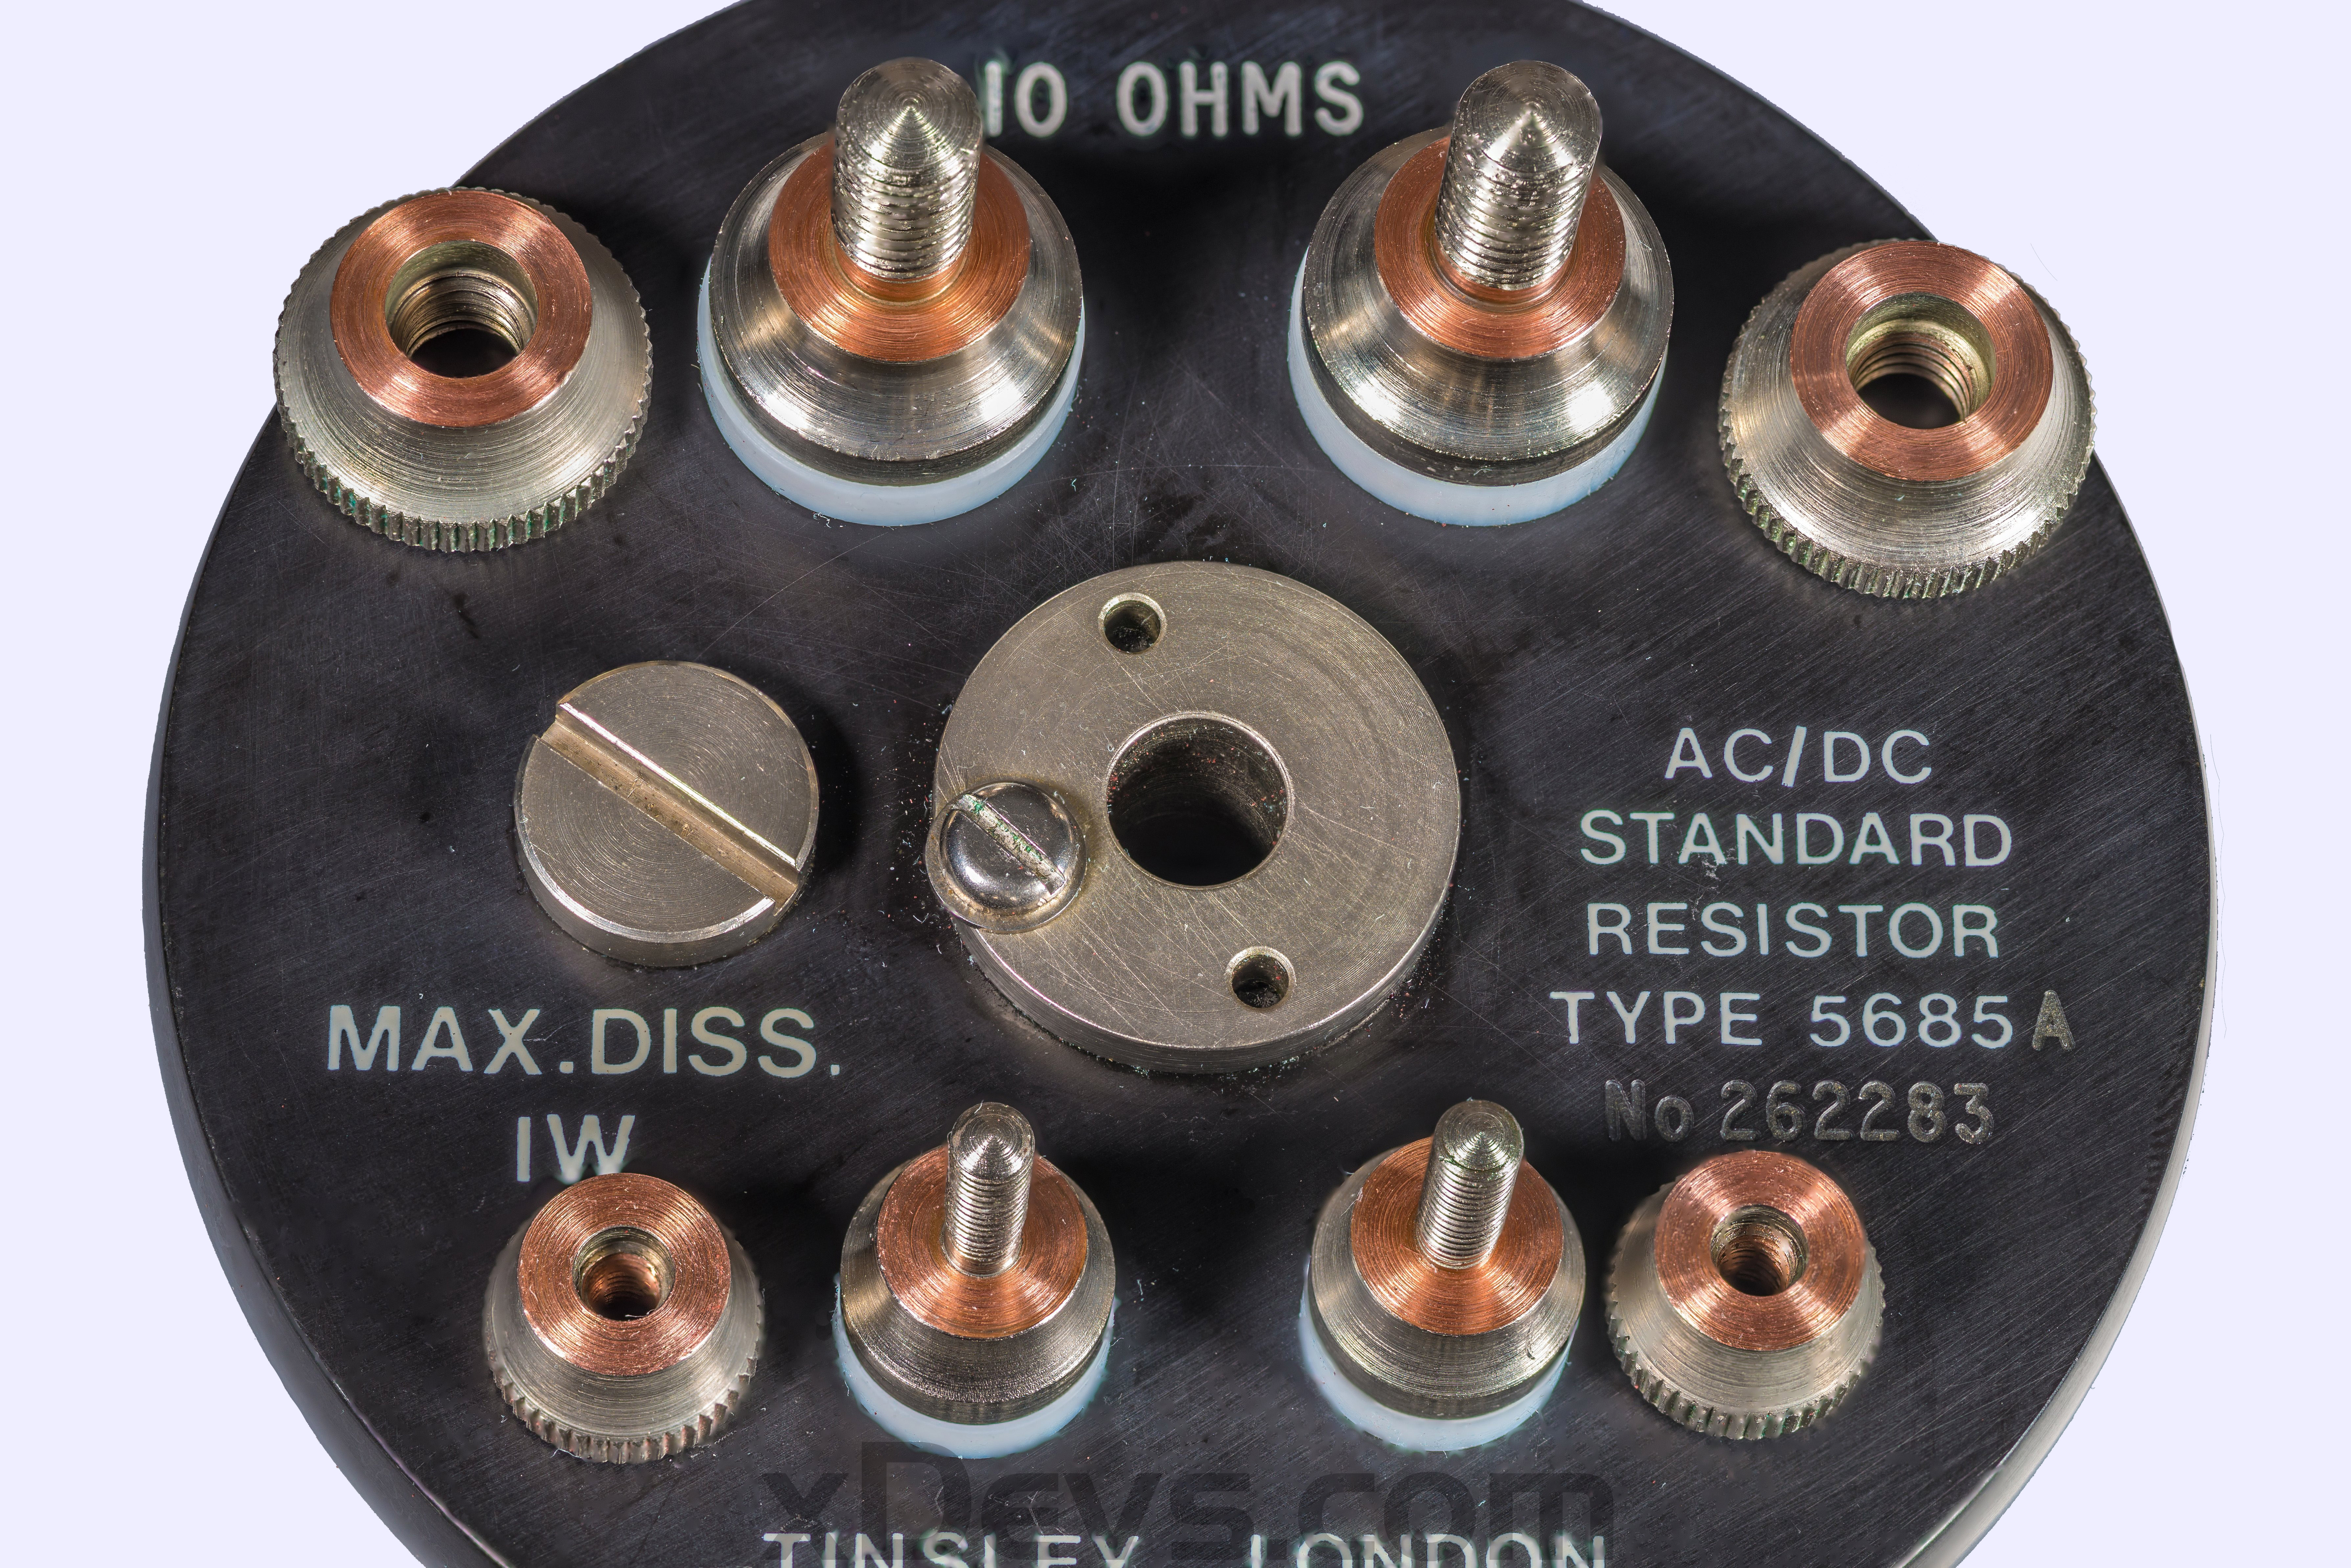
Image 14: Terminals surfaces after mechanical cleaning
Also cleaning thermal well bottom revealed some green liquid, perhaps remaining oil and copper oxides from previous owner. Most of it was cleaned up with calibrated Q-tips. I’m not worried about this much, since inner volume of 5685A is sealed and thermal well is just accessible externally.

Image 15: Goo from the bottom of the thermal well
Temperature coefficient of resistance standards designed primarily for use in oil bath often significant, hence all measurements with these performed in isothermal airbath.
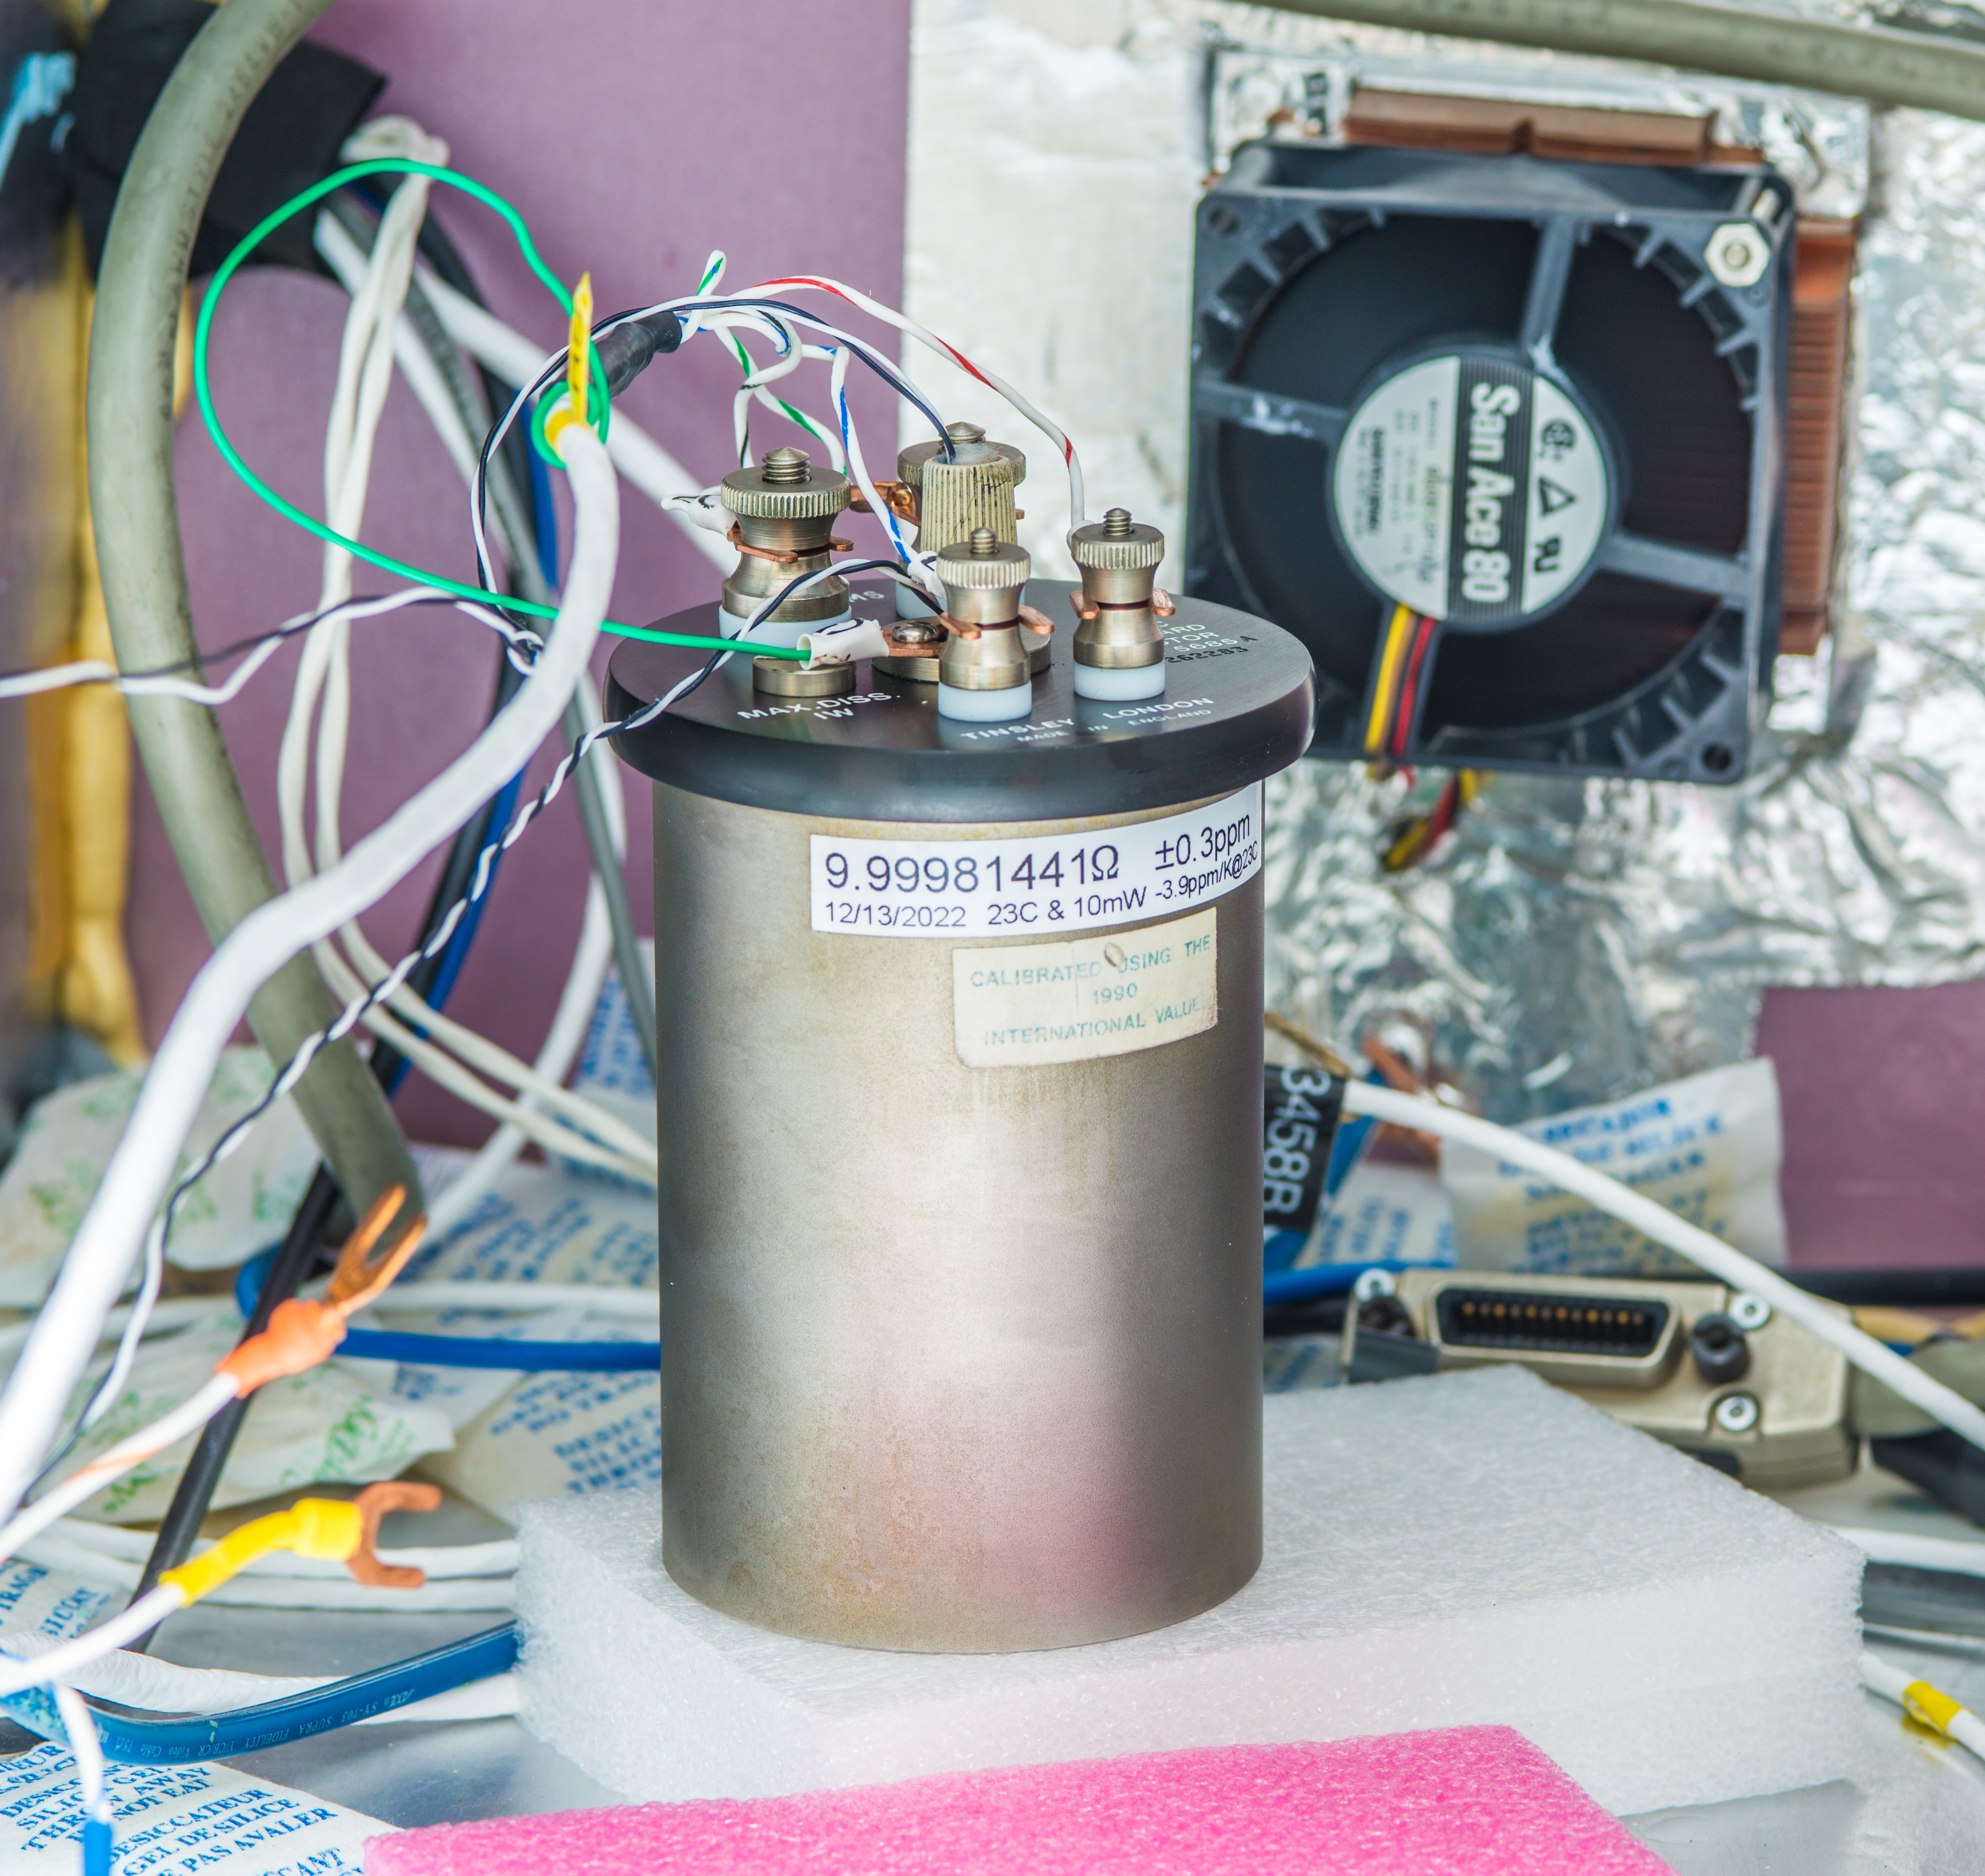
Image 16: Shiny copper terminals surfaces after mechanical cleaning with abrasive pad
Tinsley 5685A 100 Ω resistance standard, S/N 262763
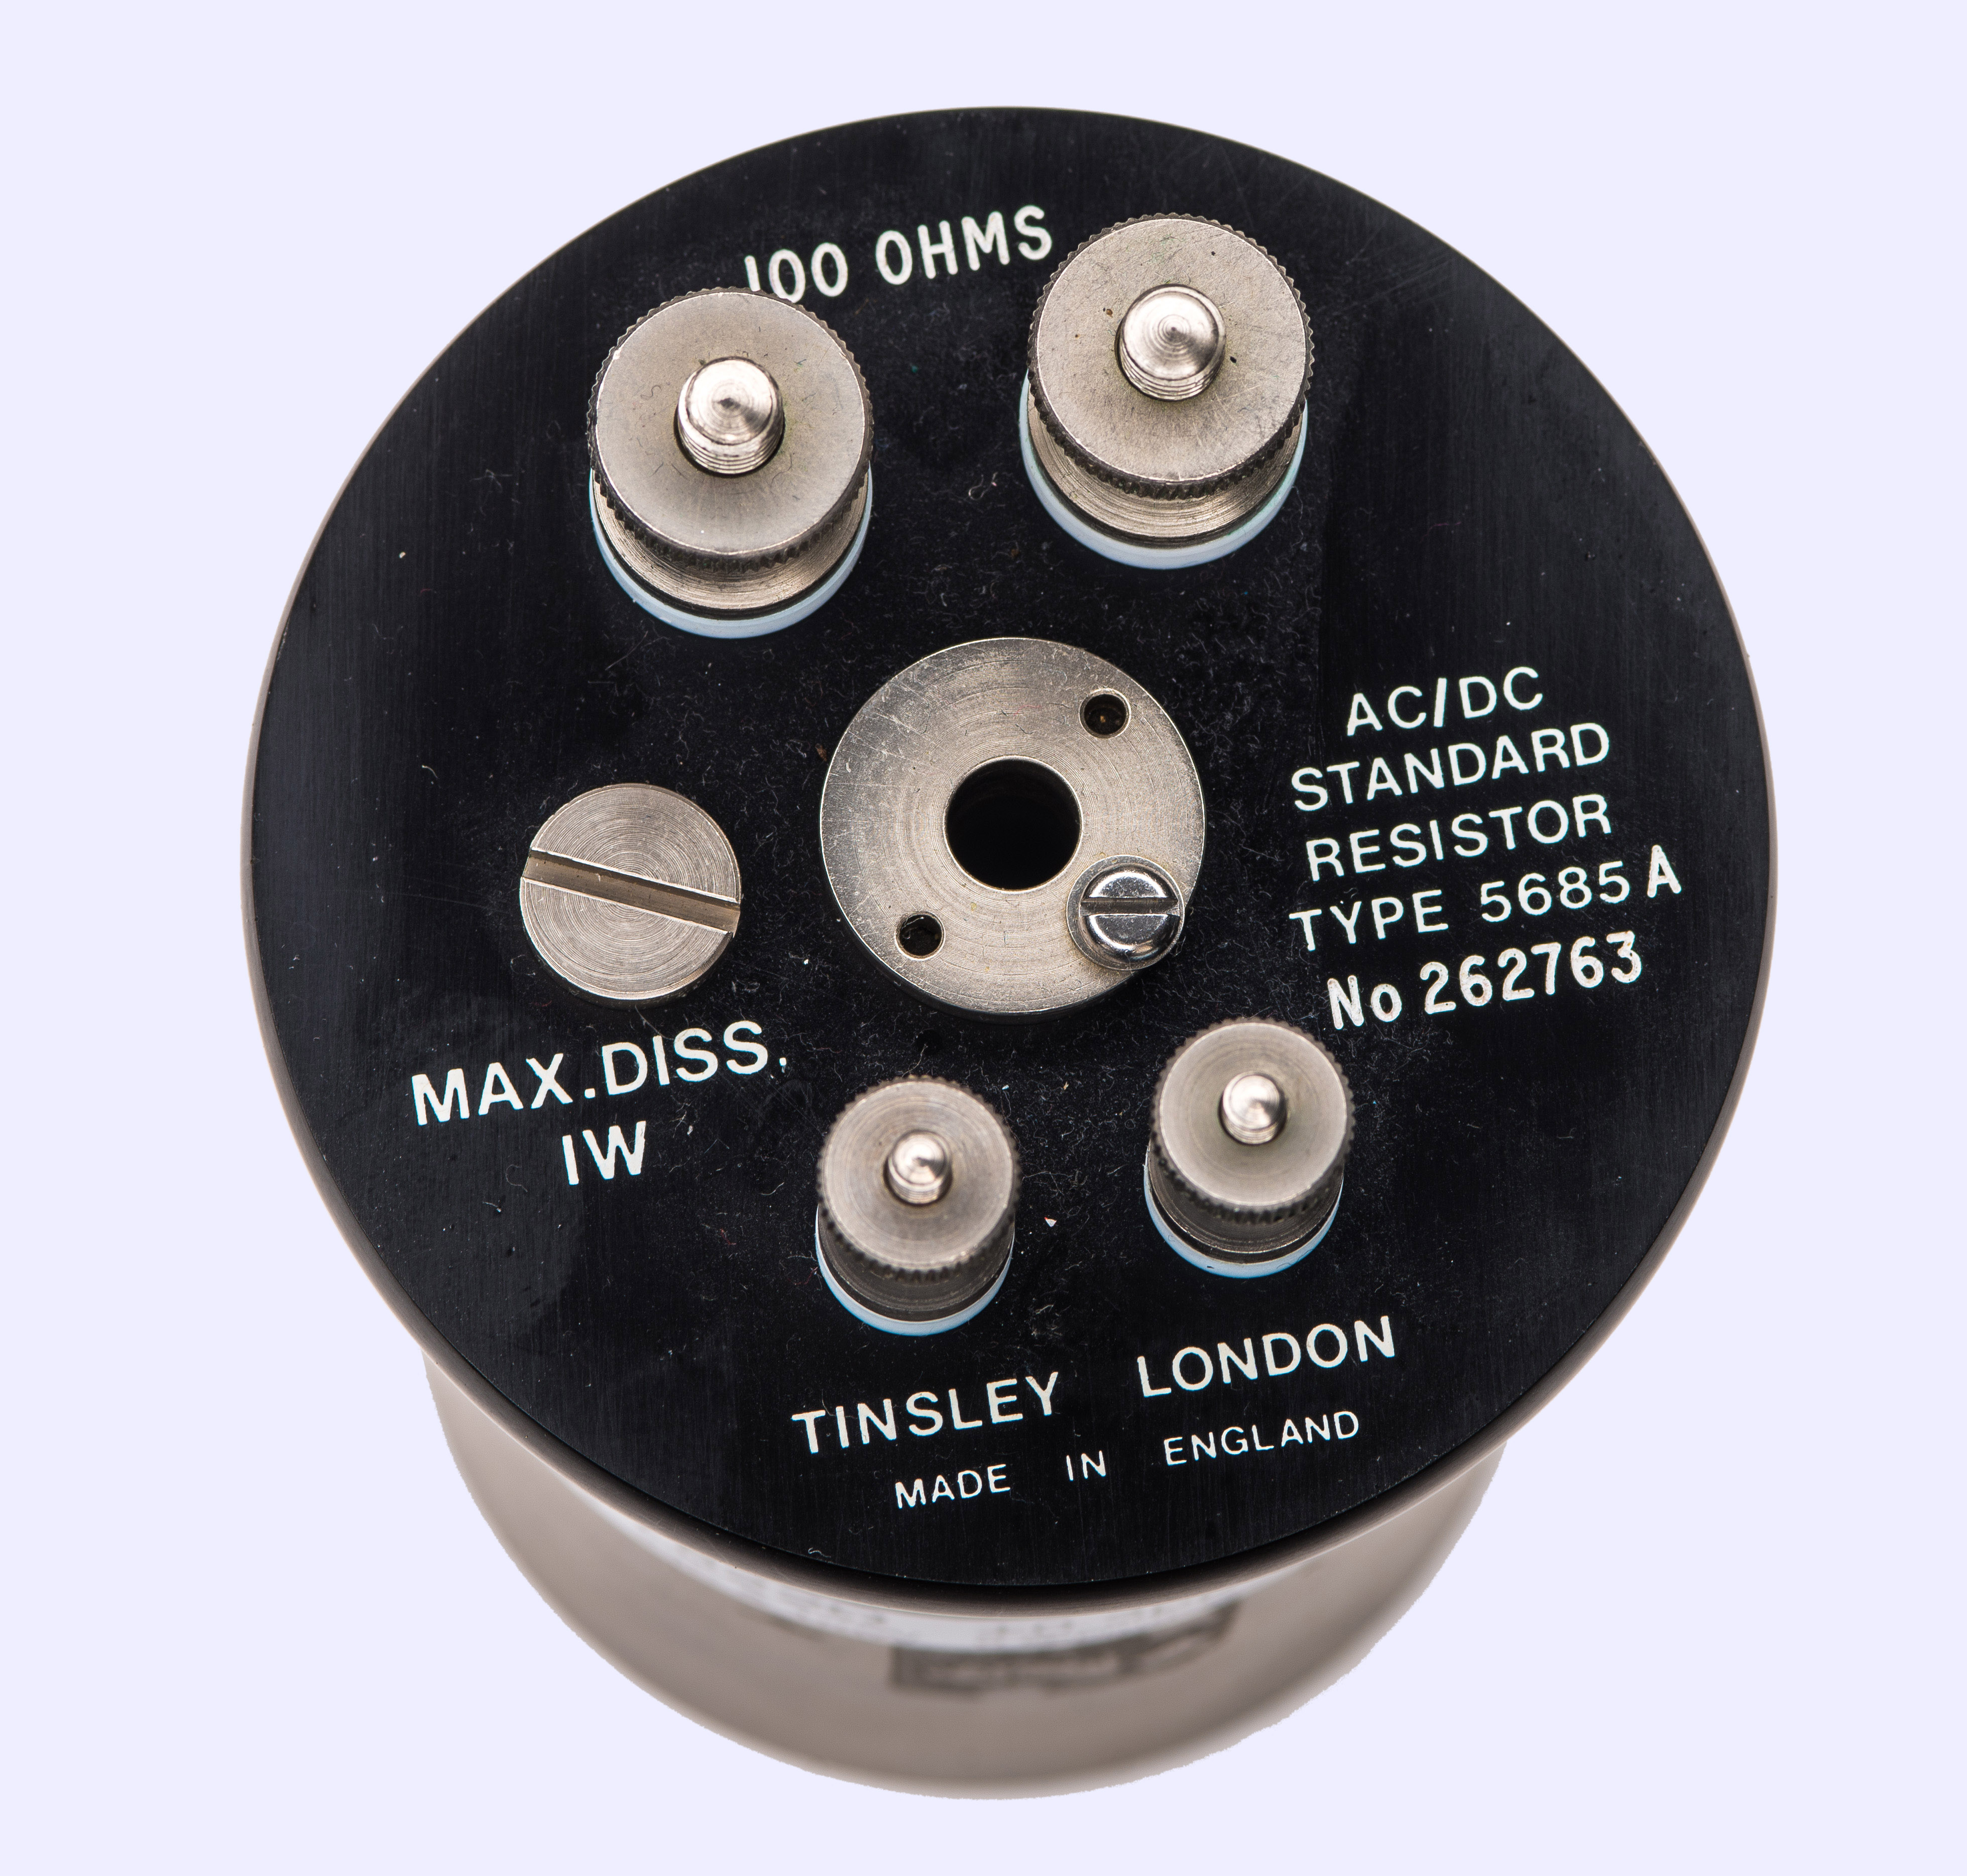
Image 17: Tinsley 5685A4 standard
Other than different resistance element with higher nominal value this 5685A4 is exactly identical to two other standards shown above.
Benchmarks
Multiple benchmarks were performed with these Tinsley standards to determine performance and usability for lab use. Key parameters include temperature stability, hysteresis from various temperature excursions and long-term drift. Without history or previous data we cannot estimate long-term drift without actually waiting multiple years to perform measurements, but we can start with temperature tests.
Temperature coefficient verification
DIY air bath was used to perform temperature sweep on these Tinsley devices available in this dedicated article . Accurate temperature of DUT and reference standards was obtained from Honeywell HEL-705 Pt1000 and Omega RTDCAP Pt1000 sensors attached mechanically in thermal wells or grounding post. Fluke 1529 Chub-E4 used to collect temperature data.
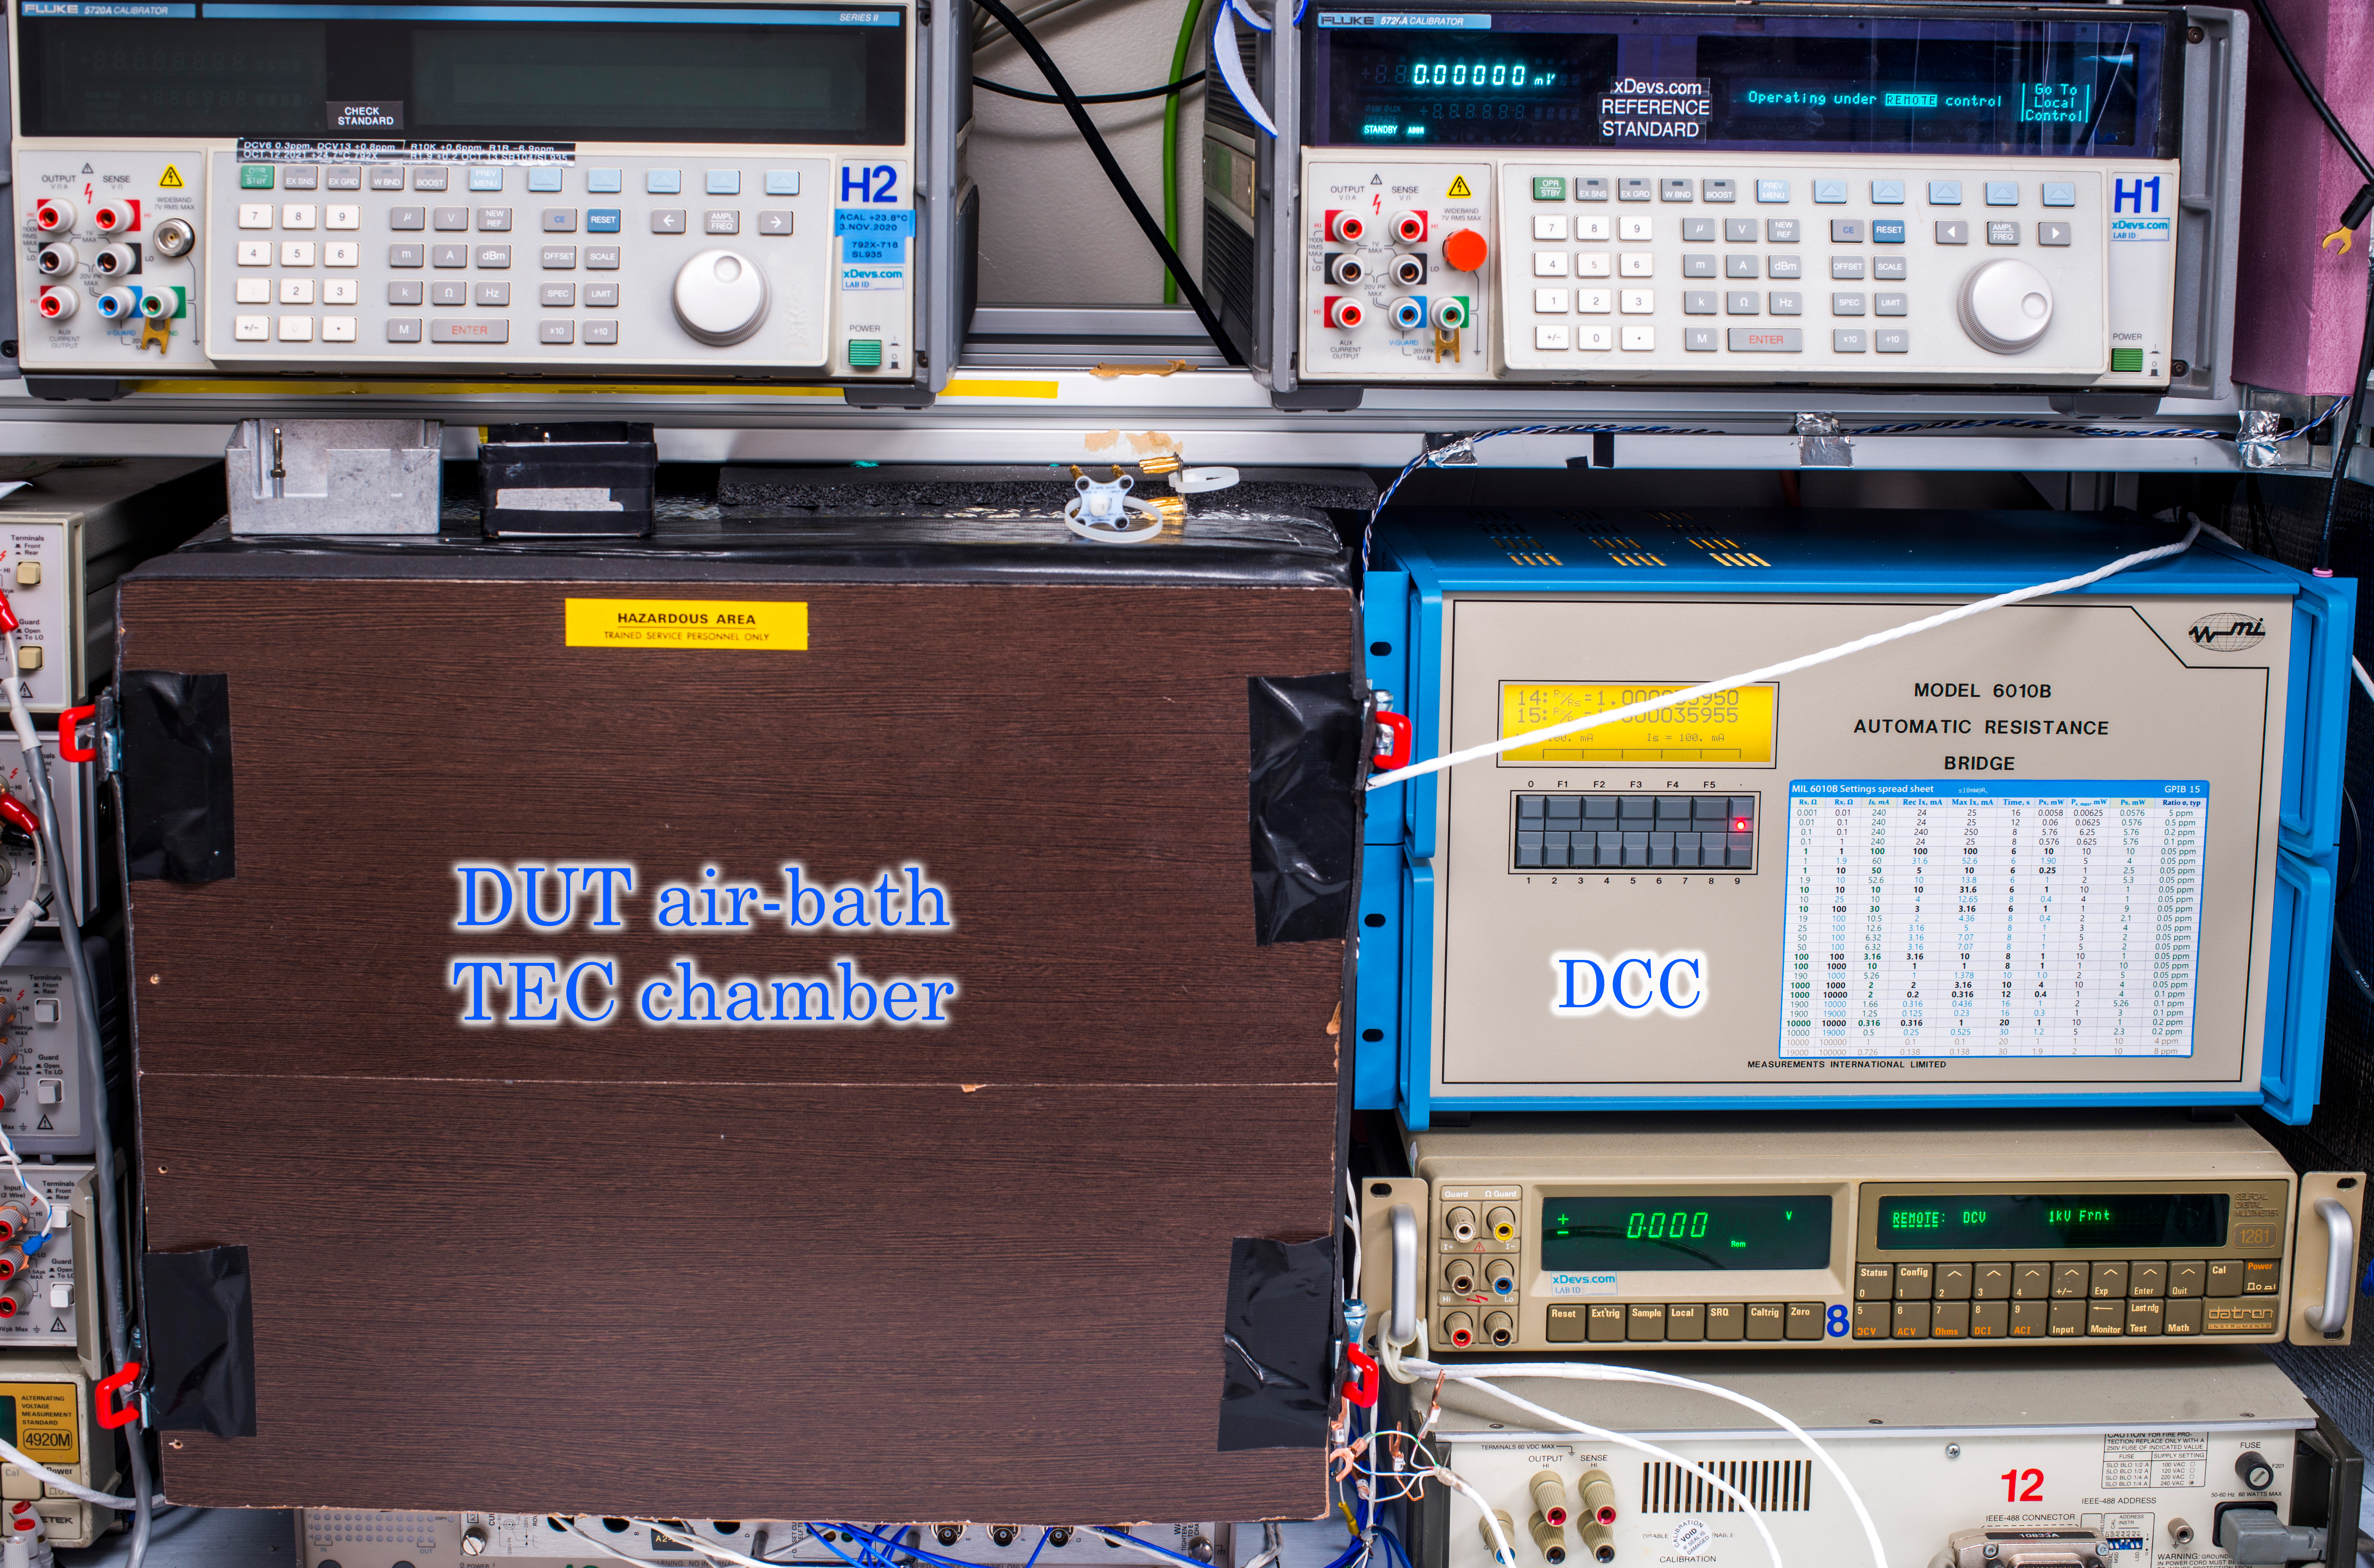
Image 18 Programmable xDevs.com TEC Air-bath and measurement DCC used for TCR testing
Resistance measurements then performed with 9½-digit Measurements International 6010 DCC bridge. For this test two separate air bath chambers were used, one at fixed +23.00 °C temperature with reference resistor. Temperature in second air bath with DUT Tinsley resistor was slowly changed from +18 °C to +28 °C over duration of 36+ hours. Ramp up and ramp down temperatures were equal in duration, with ΔT speed 0.013 °C/minute.
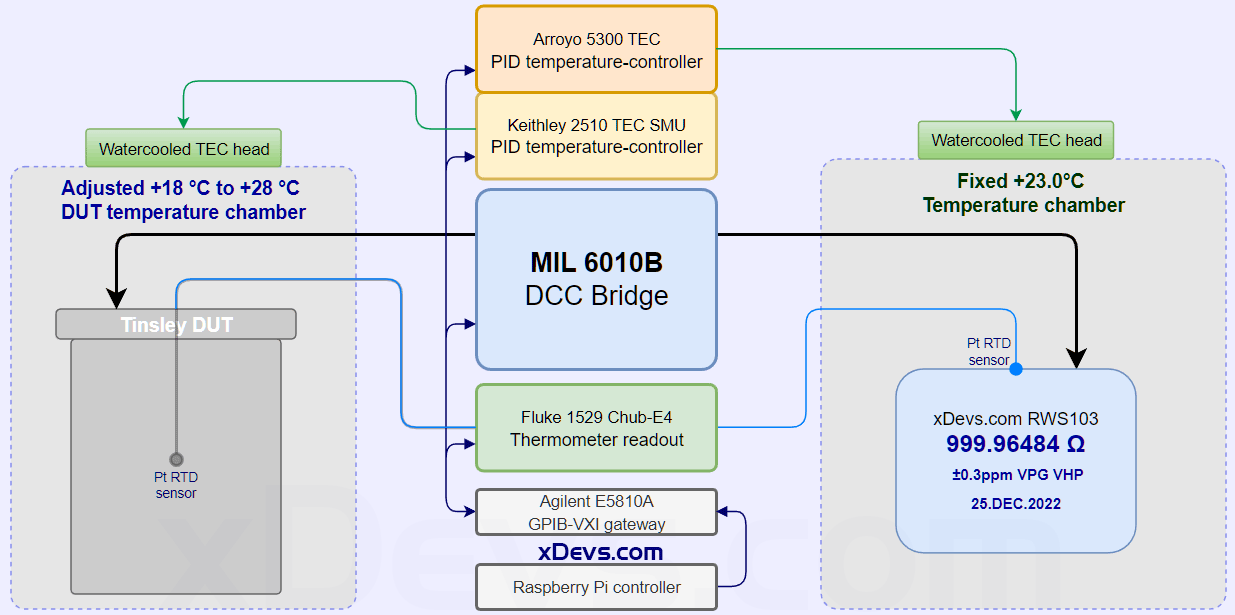
Image 19: Block diagram of used equipment for TCR tests
It is also important to measure time delay τ, in addition to traditional α and β temperature coefficients. The tau (τ) time delay is a measure of the time it takes for device to respond to a change in its parameter, such as temperature in this case. The temperature of the resistance standard element can have a significant effect on the final resistance value measurement result, so it is important to maintain the temperature as stable as possible.
Time delay will give information on how long it takes for the internal resistance element temperature to reach steady-state in response to a change in the exterior ambient temperature. While it is impossible to measure temperature of resistive wire inside enclosed sealed standard, we can at least estimate practical τ by measuring time it takes for resistance values to settle at stable plateau when temperature in standards thermal well probe is fixed constant value after previous temperature change.
Short time delay (less than 30 minutes) means that resistance standard will settle to ambient temperature changes faster, making it more sensitive to ambient environment. Long time delay in multiple hours would mean very slow response to ambient temperature variations, acting as a filter. There are benefits and drawbacks of each type so preferred type depends on practical application. For resistance metrology with uncertainty levels below 0.3 ppm resistors with very long τ often more useful to filter out any short-term temperature variations in environment. In extreme cases large programmable oil baths are used to essentially ensure nearly constant temperature of resistive element even under applied power, since it is difficult to heat 100 liters of oil in short time.
100 Ω standard results
Resistance and temperature measurements then were collected during programmed temperature sweep and stored in RAW datafile. Data analyzed shown in time-scale below, with RAW-file available by clicking on plot and following link with RAW DSV-data. Ratio is in light violet color and calculated absolute resistance is in dark blue plot color on graph. Absolute resistance is calculated by simple formula R = Rx/Rs where Rx is transfer standard xDevs.com RWS-1kΩ based on VPG VHP203 element. Transfer standard was calibrated and checked recently against primary ESI SR104 10000 Ω standard.
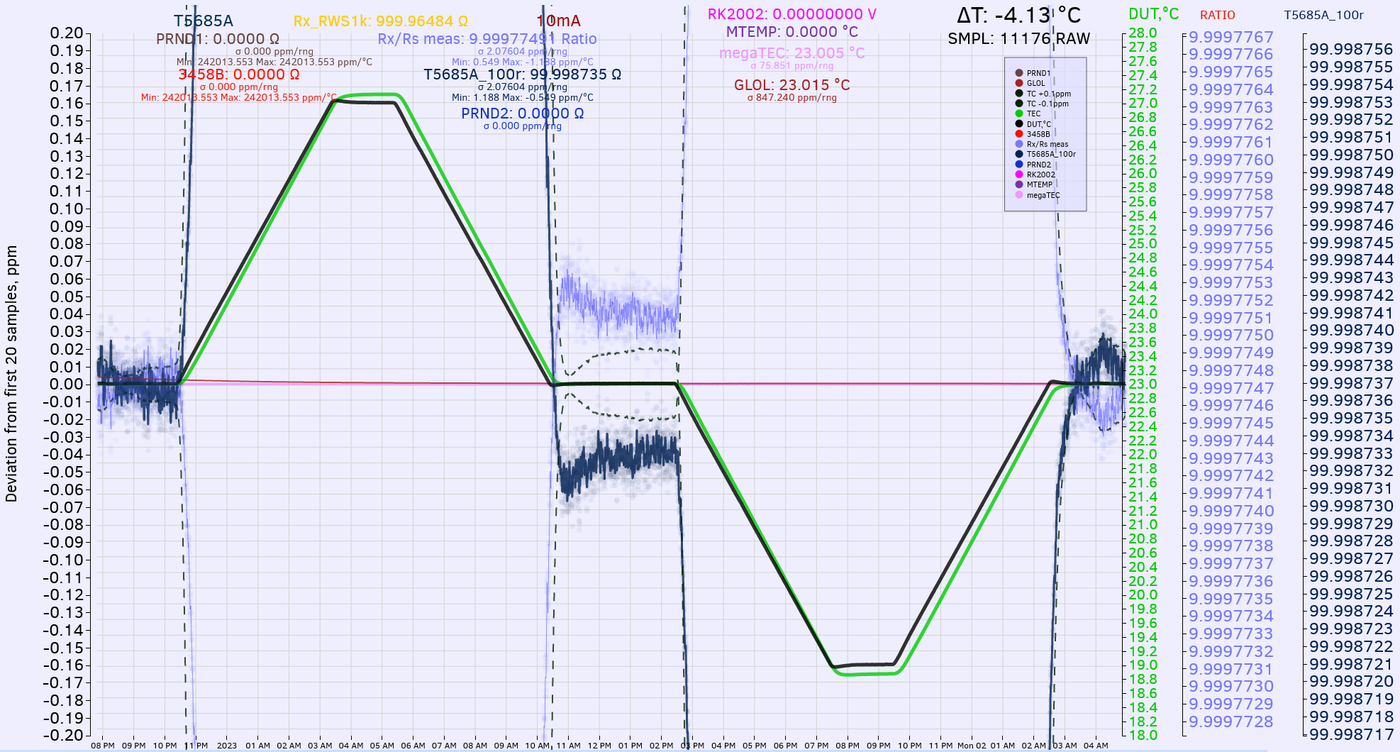
Image 20: Hysteresis data plot close-up during TCR sweep
Tinsley 5685A-100 demonstrated impressive <0.05 ppm retrace after full excursion from standard +23 °C to +27 °C and final +19 °C temperature sweep during TCR test. Many resistance standards have some hysteresis and take some time to recover to previous values after such temperature sweeps, but 5685A 100 Ω demonstrated excellent performance here.
Time delay for this element is also quite small, thanks to good thermal conductivity of oil medium between outer metal can case and inner resistive element assembly. Based on measurement τ is less than 1 hour. Compared to Fluke 742A this is more than 5 times faster.
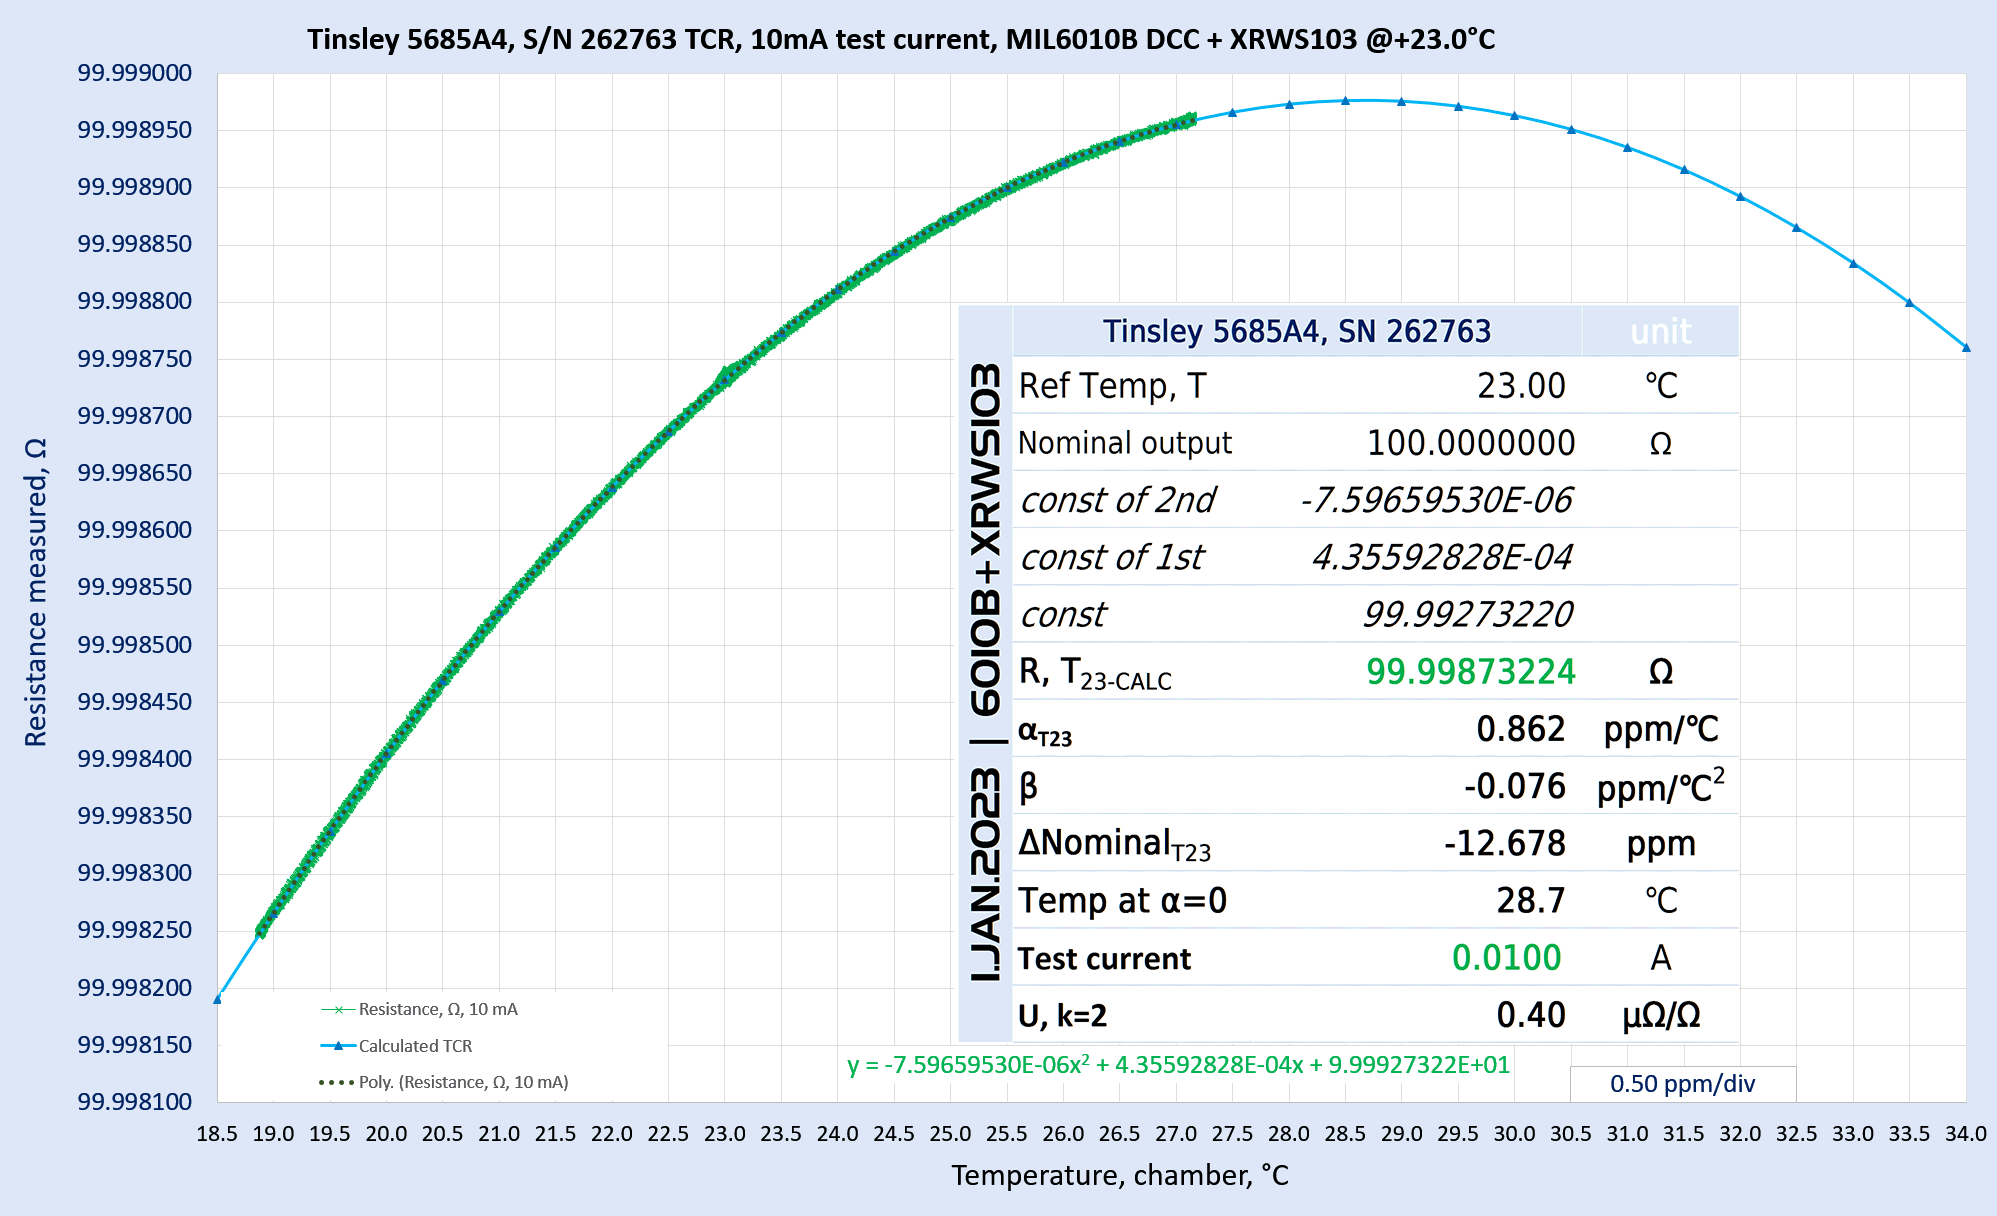
Image 21: Final TCR measurement scatter plot with analysis result
Changing timescale plot to X-Y plot with measured resistance data against Tinsley 5685A DUT thermal well Pt1000 temperature sensor readout we can observe smooth temperature coefficient measurement result. Actual measurement points are marked in green and mathematically calculated second order polynomial points are in blue curve with triangle markers. Because of very small hysteresis this standard measured points essentially perfectly match calculated theoretical curve determined for range +16 °C to +34 °C.
Based on this calculation we can obtain α = +0.862 ppm/°C and β = -0.076 ppm/°C2. This TCR is well within expected factory specification for 5685A standards. Calculated resistance at cardinal +23.0 °C point differs from expected assigned value by +0.0566 ppm, which is well below uncertainty of the measurement. Reversal of TCR curve calculated to be at +28.7 °C, suggesting optimal temperature for this standard. Offset from nominal is -12.68 ppm, which is still well within factory specifications provided by Tinsley for NEW 5685A standards.
Out of curiosity additional test of TCR sweep was performed on this Tinsley 100 Ω with using HP 3458A instead of high resolution DCC bridge. This plot also reveals impressive difference in measurement noise of 100 Ω range between DMM and DCC, even accounting for 10 times less current for case with DMM. HP3458A noise could be lower if I’d use NPLC 100 or even slower, but not that much more. Notice different scale on TCR chart with DMM data at 1 ppm/div versus 0.5ppm/div for DCC only chart on Image 21.
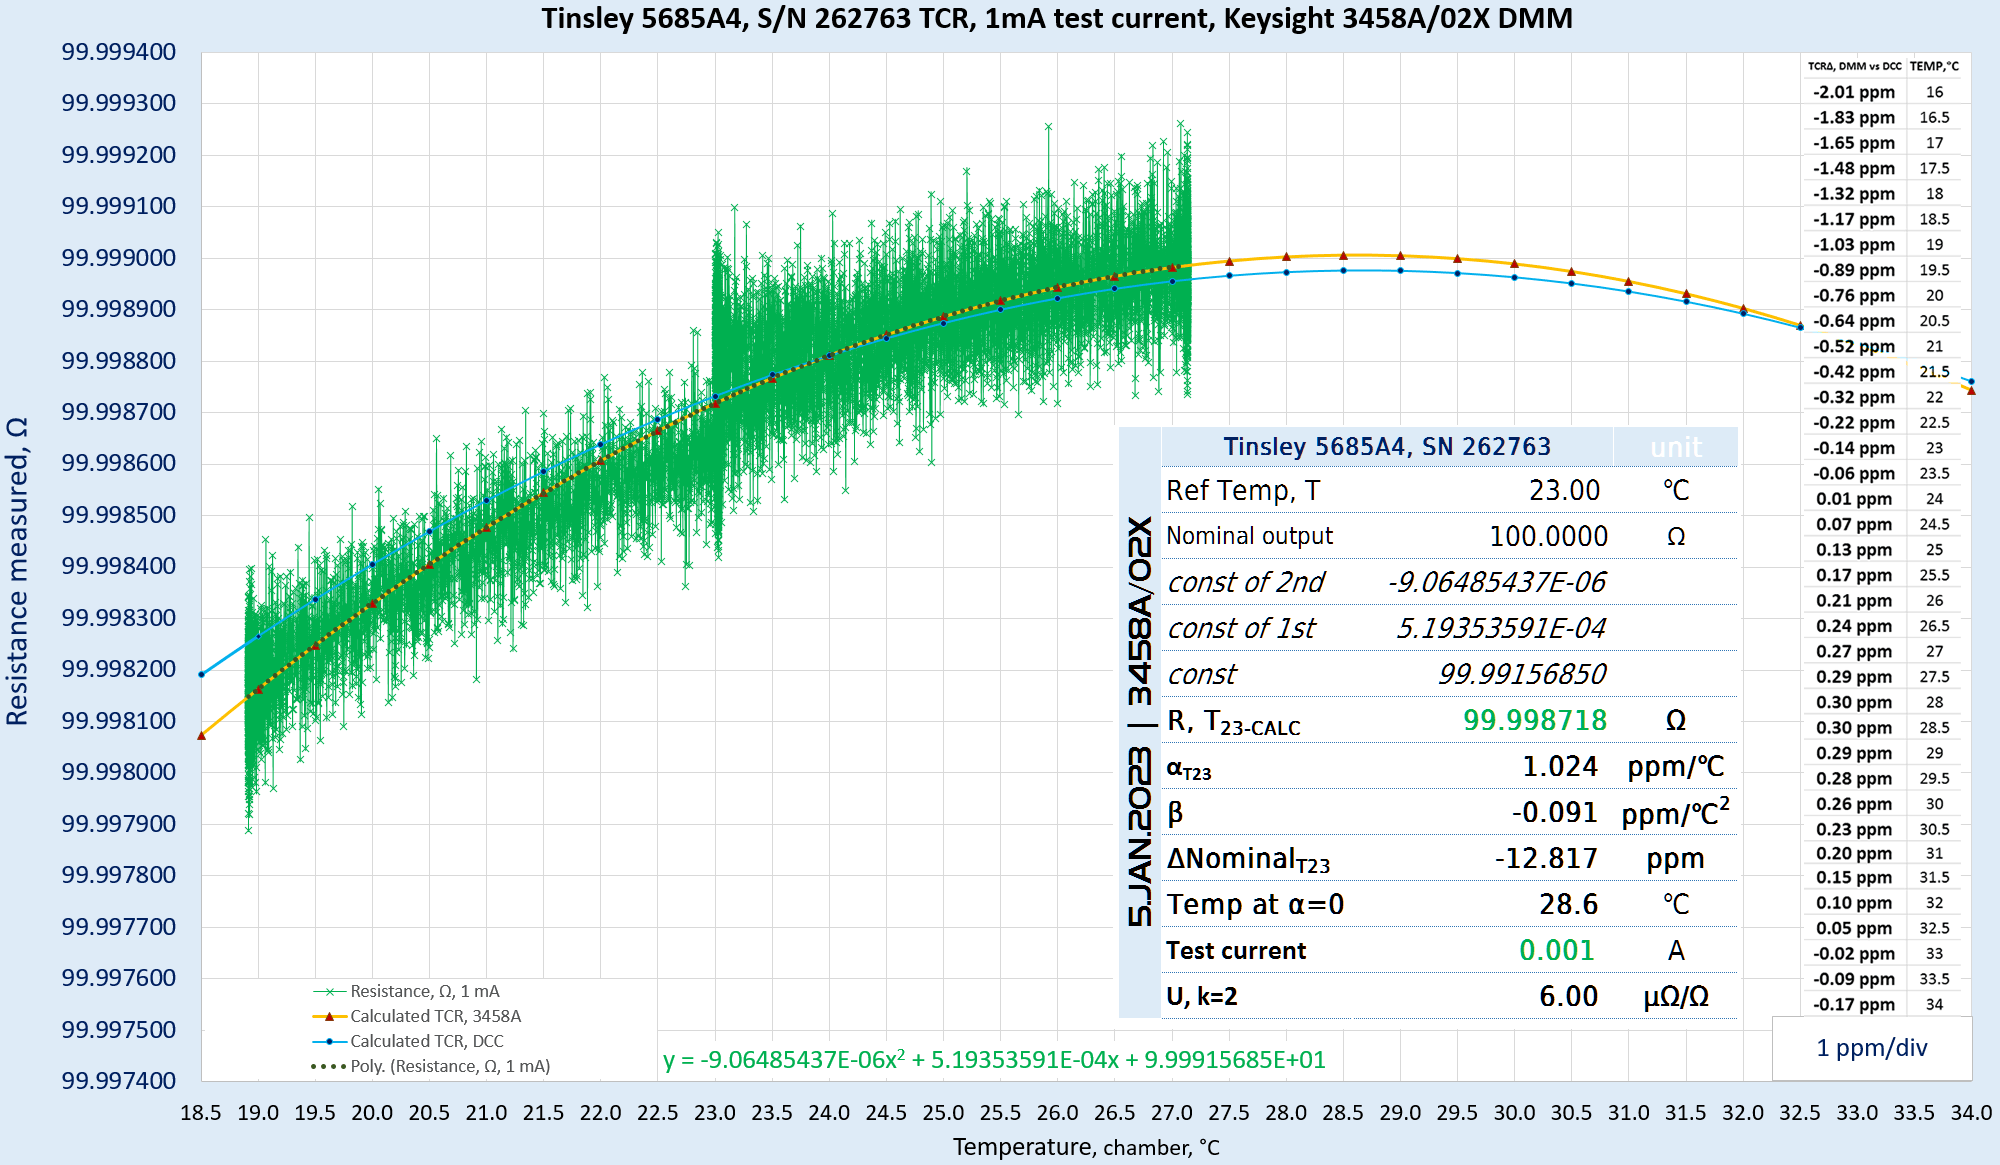
Image 22: Repeated TCR measurement scatter plot with DMM method
This measurement despite some additional noise from DVM resulted in α = +1.024 ppm/°C and β = -0.091 ppm/°C2 with sweet spot temperature +28.6 °C, which is very close to what reference data from DCC bridge provided. Test current was also smaller, because HP 3458A use 1 mA source on this range, compared to 10 mA from DCC. Table on chart shows difference in calculated resistance between data from DCC and DMM, with typical value under 1 ppm for T > +19°C. These results provide very good confidence in high performance that our HP3458A offers for experiments such as resistance temperature coefficient measurement. DMM was used on 100 Ω range with next settings:
def configure_inst(self):
    # Setup HP 3458A
    dmm.clear()
    dmm.write("PRESET NORM")
    dmm.write("OFORMAT ASCII")
    dmm.write("OHMF 100")
    dmm.write("TARM HOLD")
    dmm.write("TRIG AUTO")
    dmm.write("NPLC 50")
    dmm.write("AZERO ON")
    dmm.write("OCOMP ON")
    dmm.write("NRDGS 1,AUTO")
    dmm.write("MEM OFF")
    dmm.write("END ALWAYS")
    dmm.write("NDIG 9")
    dmm.write("DELAY 0.1")
10 Ω standard results
Same measurements were repeated for 5685A2 10 Ω standard.

Image 23: Hysteresis data plot close-up during TCR sweep on 10 Ω standard
Tinsley 5685A2 10 Ω demonstrated even better <0.03 ppm retrace after full excursion from +23 °C to +27 °C and final +19 °C temperature sweep during 37 hour long TCR test. Many resistance standards have some hysteresis and take some time to recover to previous values after such temperature sweeps. Perhaps it is due to stability of resistance wire element and loose design of the standard that allows relatively free expansion and contraction of the resistor coil at temperature changes. In fact at fixed +23.0 °C temperature sometimes I get exactly same ratios measurement result between two samples. Comparisons of resistance standards had 8 seconds reversal time, with 31.6 mA applied to 10 Ω unit under test and 3.16 mA applied to 100 Ω reference standard.
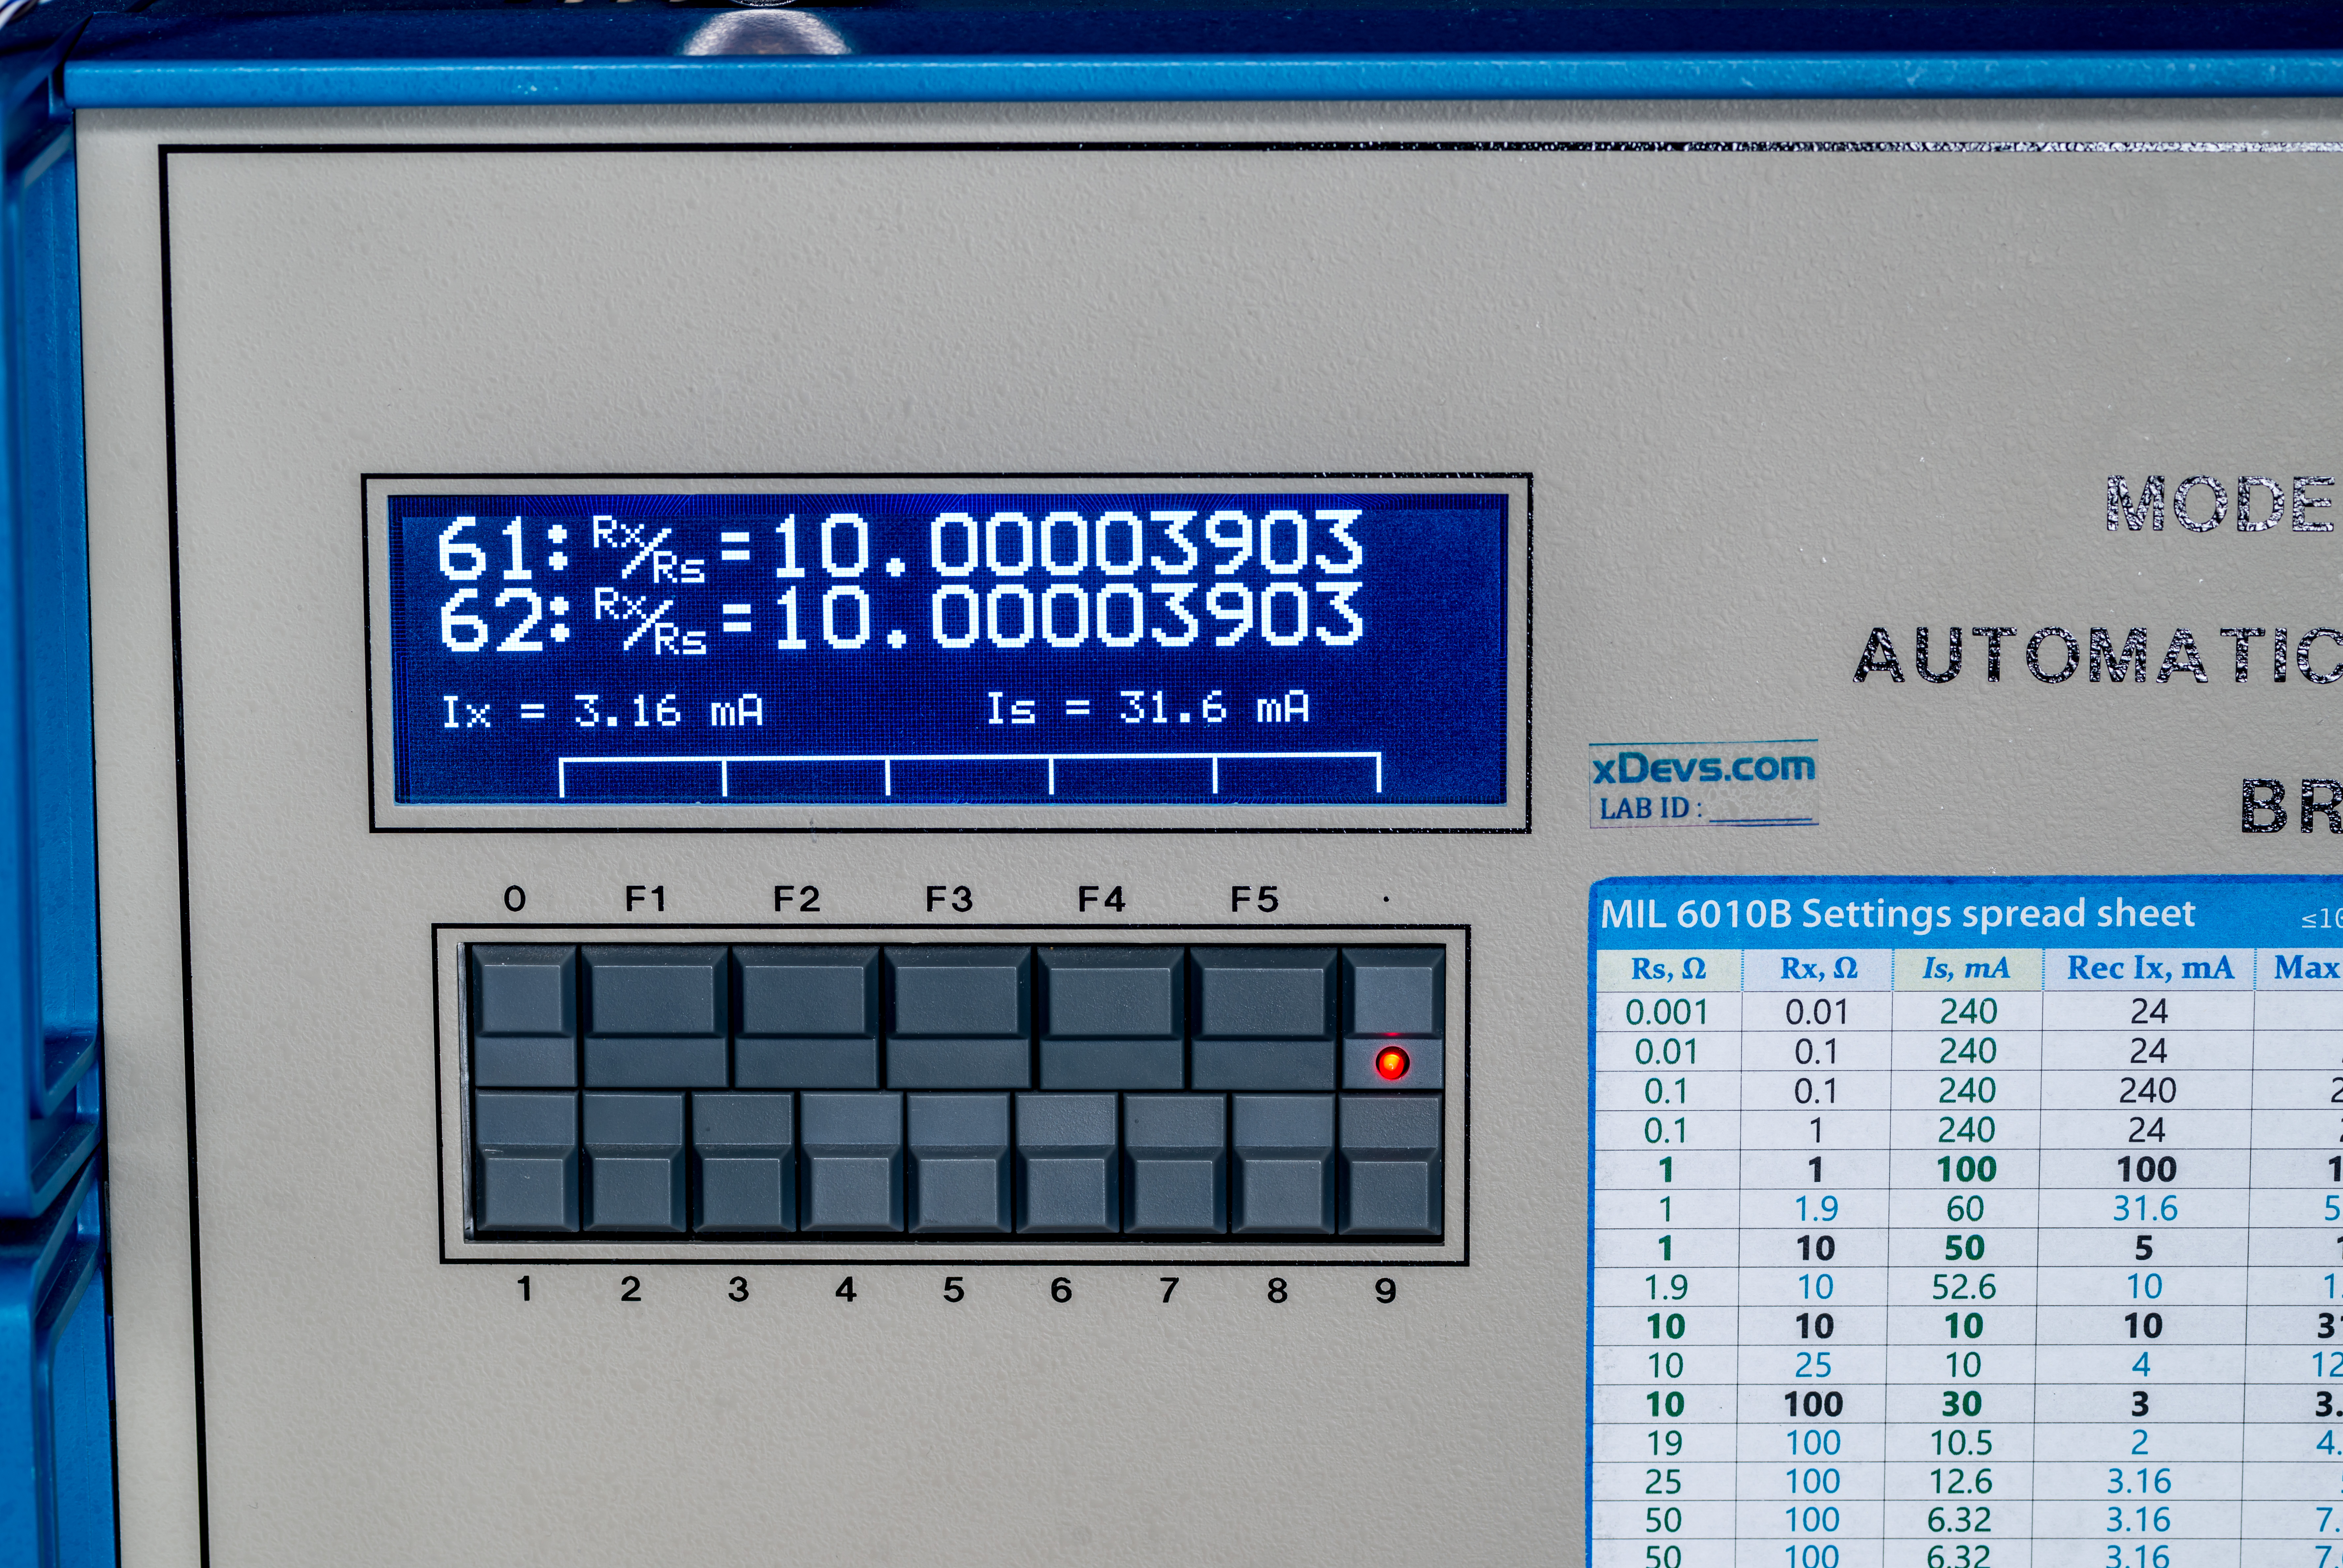
Image 24: Same ratio samples acquired by Measurements International 6010B between Tinsley standards
But if we zoom out and look at overall TCR plot with full range of sweep picture here is not that peachy anymore:
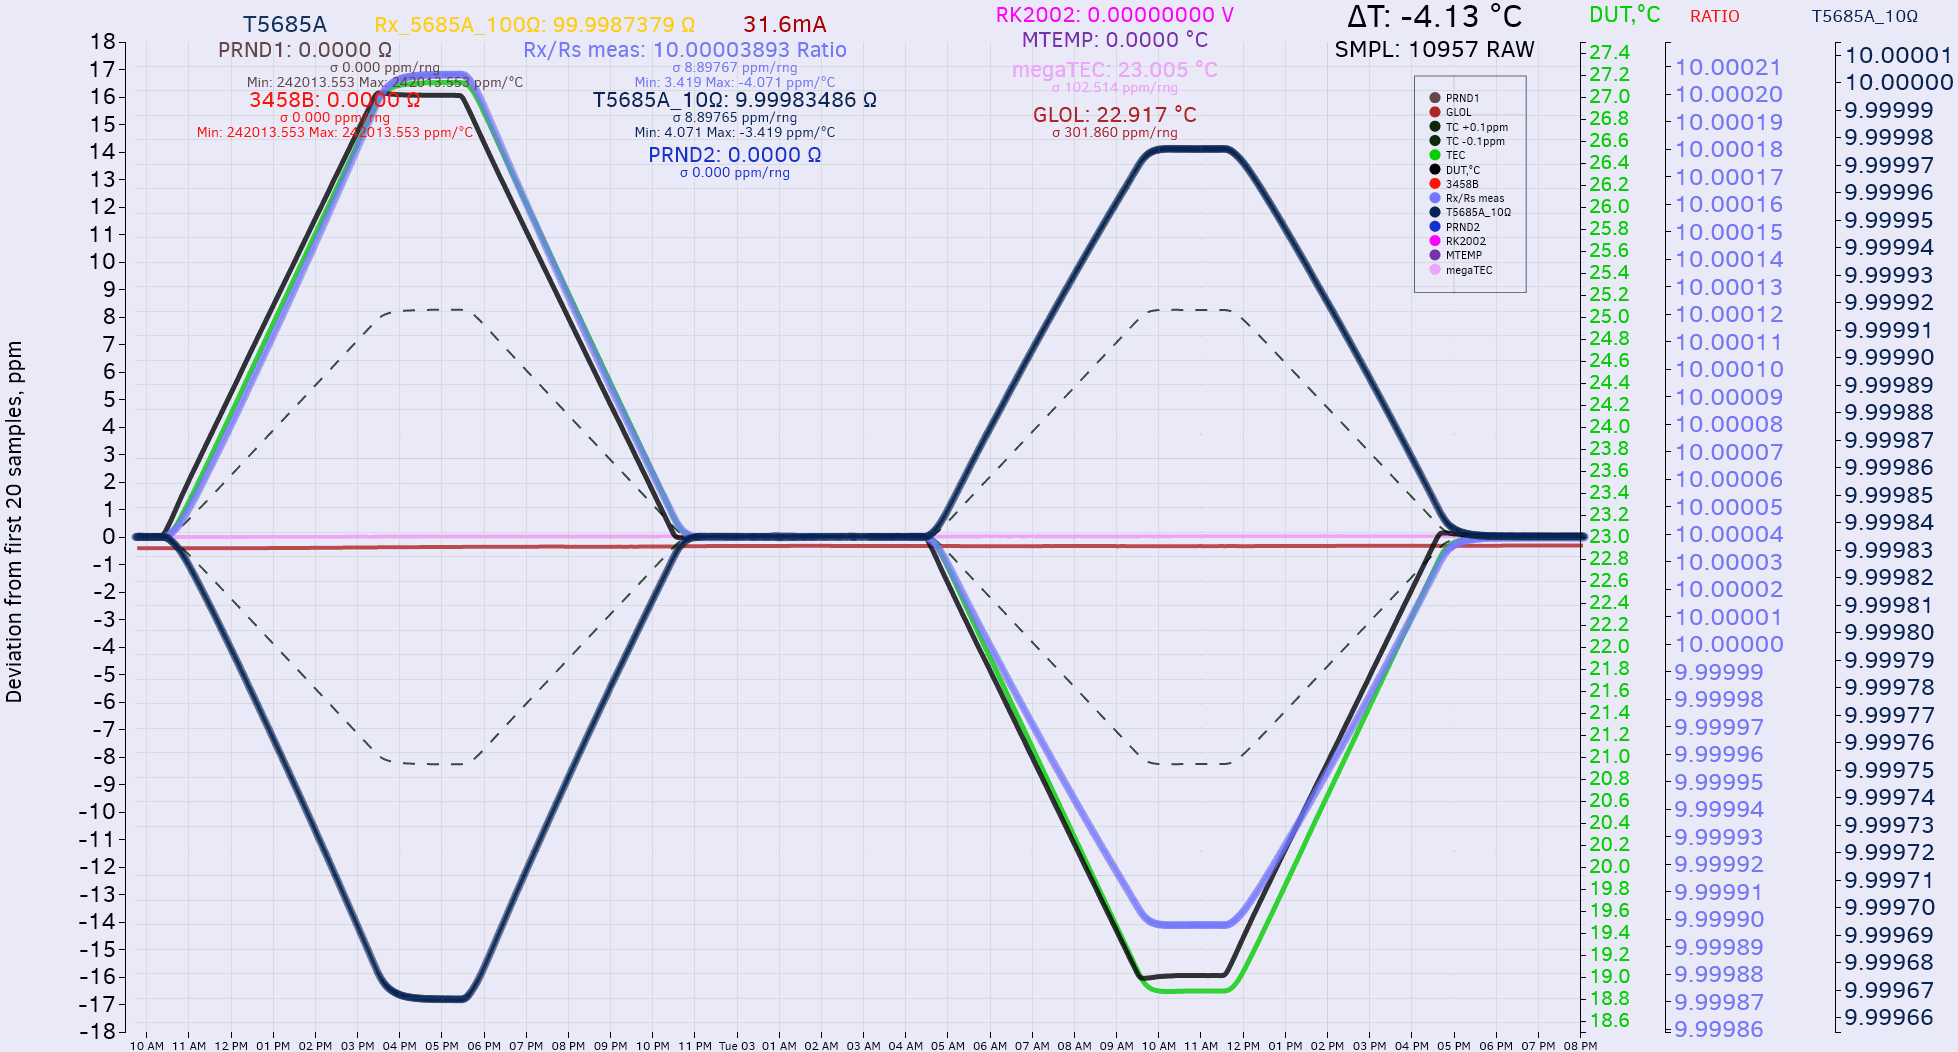
Image 25: TCR data over time scale chart
Reformatting data into temperature scale scatter X-Y plot and alpha/beta calculation reveals excessive temperature coefficient compared to factory specification.
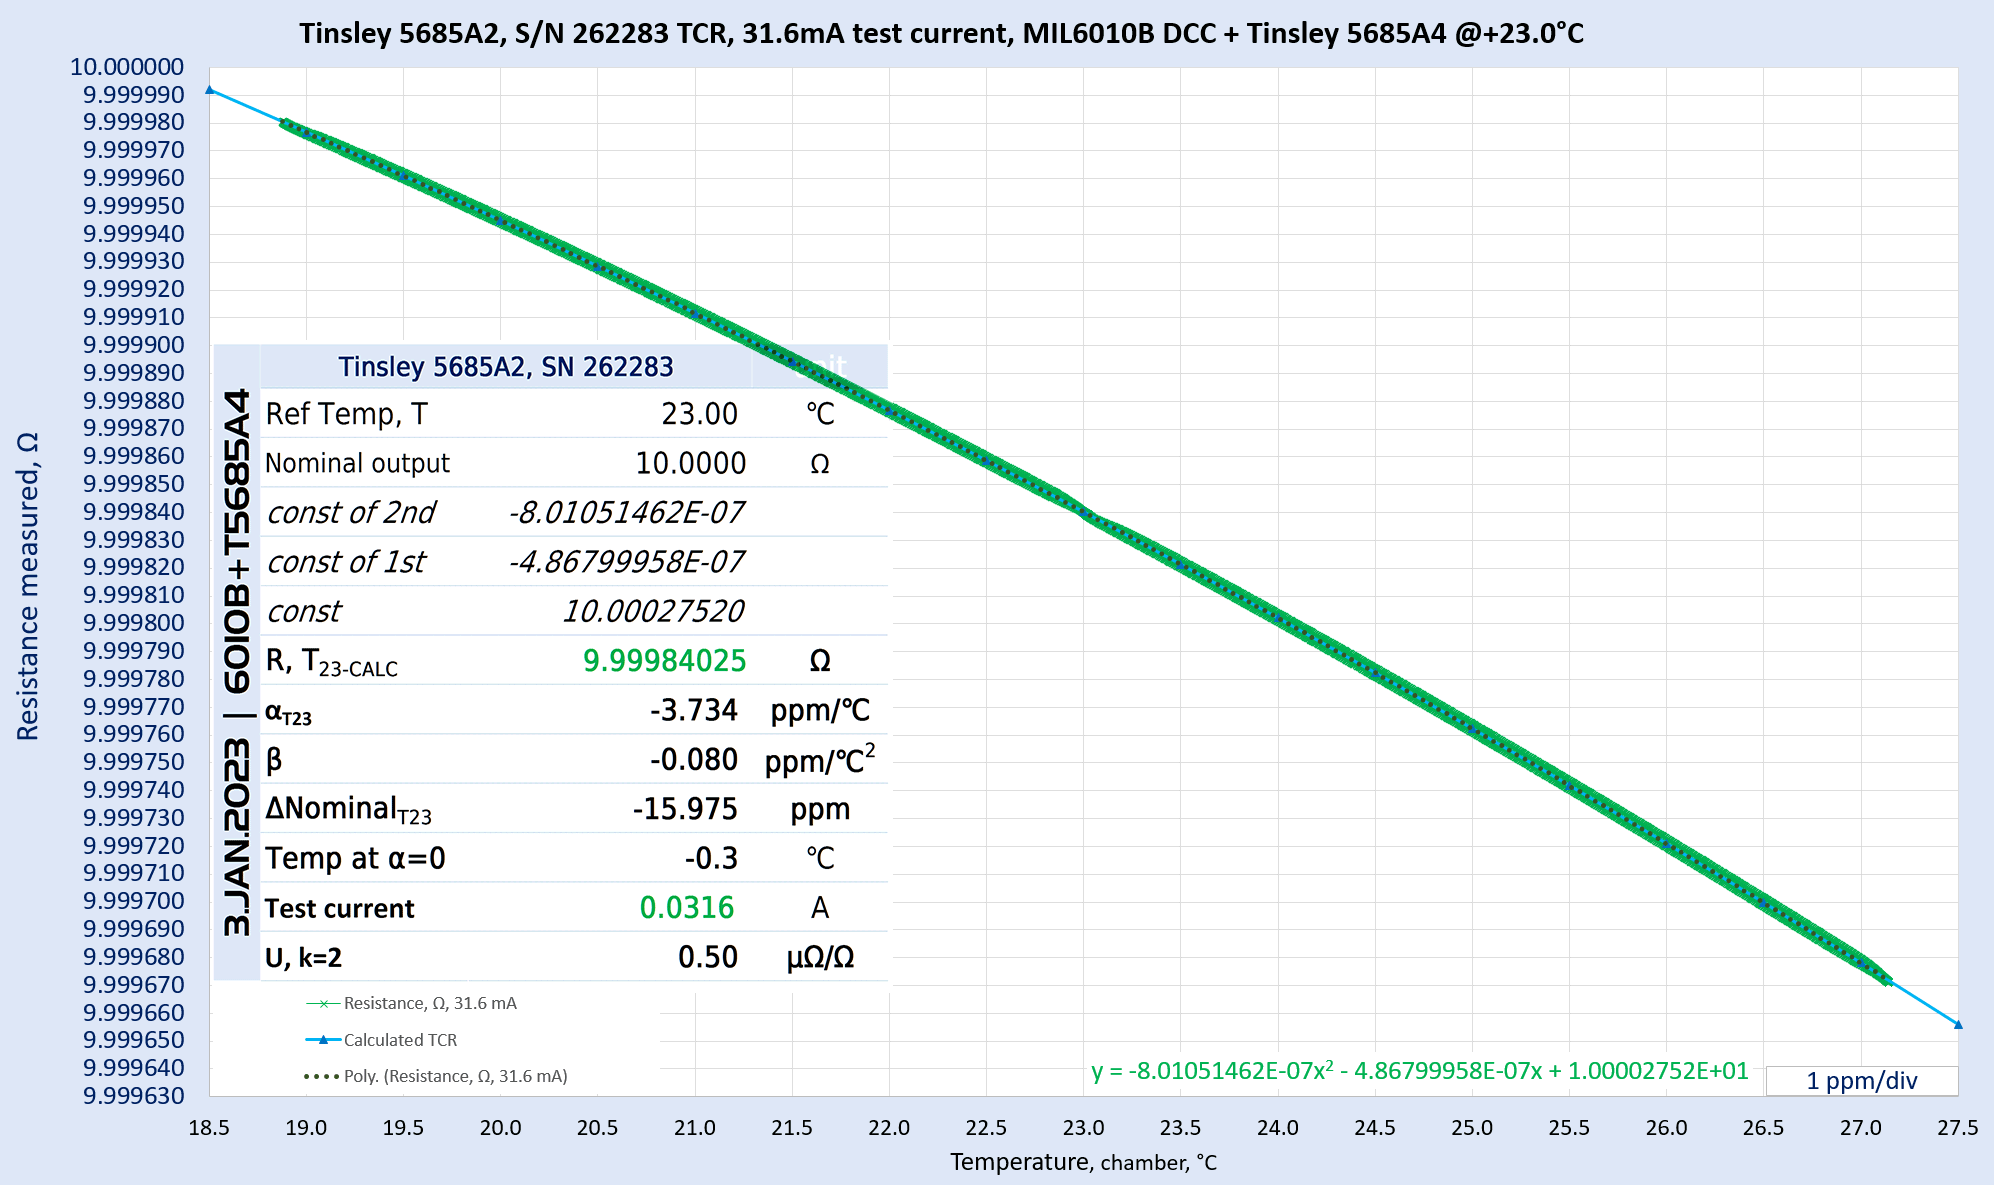
Image 26: Final 10 Ω standard TCR measurement scatter plot with analysis result
Resistance value at +23.0 °C is -16 ppm off nominal 10 Ω, but α is -3.734 ppm/°C and β = -0.080 ppm/°C2. Factory specification is ±2.0 ppm/°C for standard model 5685A2 units, so we are quite a bit off. Also calculated optimal temperature is negative 0.3 °C for this unit, also hinting at some issue together with abnormally high α.
Calculated absolute resistance at cardinal +23.0 °C point differs from expected assigned value by -2.584 ppm. Previous assigned value was obtained by another Measurements International 6010T bridge system from different reference standard. All three Tinsley 5685A2 standards were hand-carried between xDevs.com and second lab 20 km away well protected in foamed hard-cases, so such large deviation cannot be explained by transportation issue. Reconnecting cable from DCC to resistance standard, tightening posts and gentle shaking of the standard did not change measured value by more than 0.2ppm and even that was mostly due to changing temperature from handling.
This -2.6ppm discrepancy will be further investigated later on and this section will be updated with new comparison results.
Re-calibration on January 2025
Tempco measurement and retest was performed with 50 hour sweep between +18 °C and +28 °C. This experiment generated DSV-file with raw data points . Measurement was performed on two DUTs in same chamber, Tinsley 5685A2 with Measurements International 6010B DCC bridge versus Guildline 9330-100 S/N 40707 and ESI SR1010-100 R2 measured by separate Keysight 3458A. Analysis of the data was done with help of Python script linked below.
Plot/analytics script for Python 3 / matplotlib
Script generated a set of charts, showcasing the performance and key parameters such as alpha/beta temperature coefficients on both DUTs, linear trend/hysteresis after temperature cycling experiment and absolute value calculated for +23.0 °C point. Uncertainty of this calibration was estimated at about 0.4 µΩ/Ω. Click on the image for higher resolution plot.

TC values calculated from this experiment are in a good agreement with previous data.
1 Ω standard results
Tinsley 5685A1 1 Ω demonstrated very good <0.08 ppm retrace after full excursion from +23 °C to +27 °C and final +19 °C temperature sweep during 36 hour long TCR test. Comparisons of resistance standards had 6 seconds reversal time, with test current 50 mA applied to 1 Ω unit under test and 5 mA applied to 10 Ω reference standard. Measured τ of 5685A1 1 Ω is longer, around 3 hours. Perhaps this is due to higher applied current and higher sensitivity to thermal EMF on contacts.
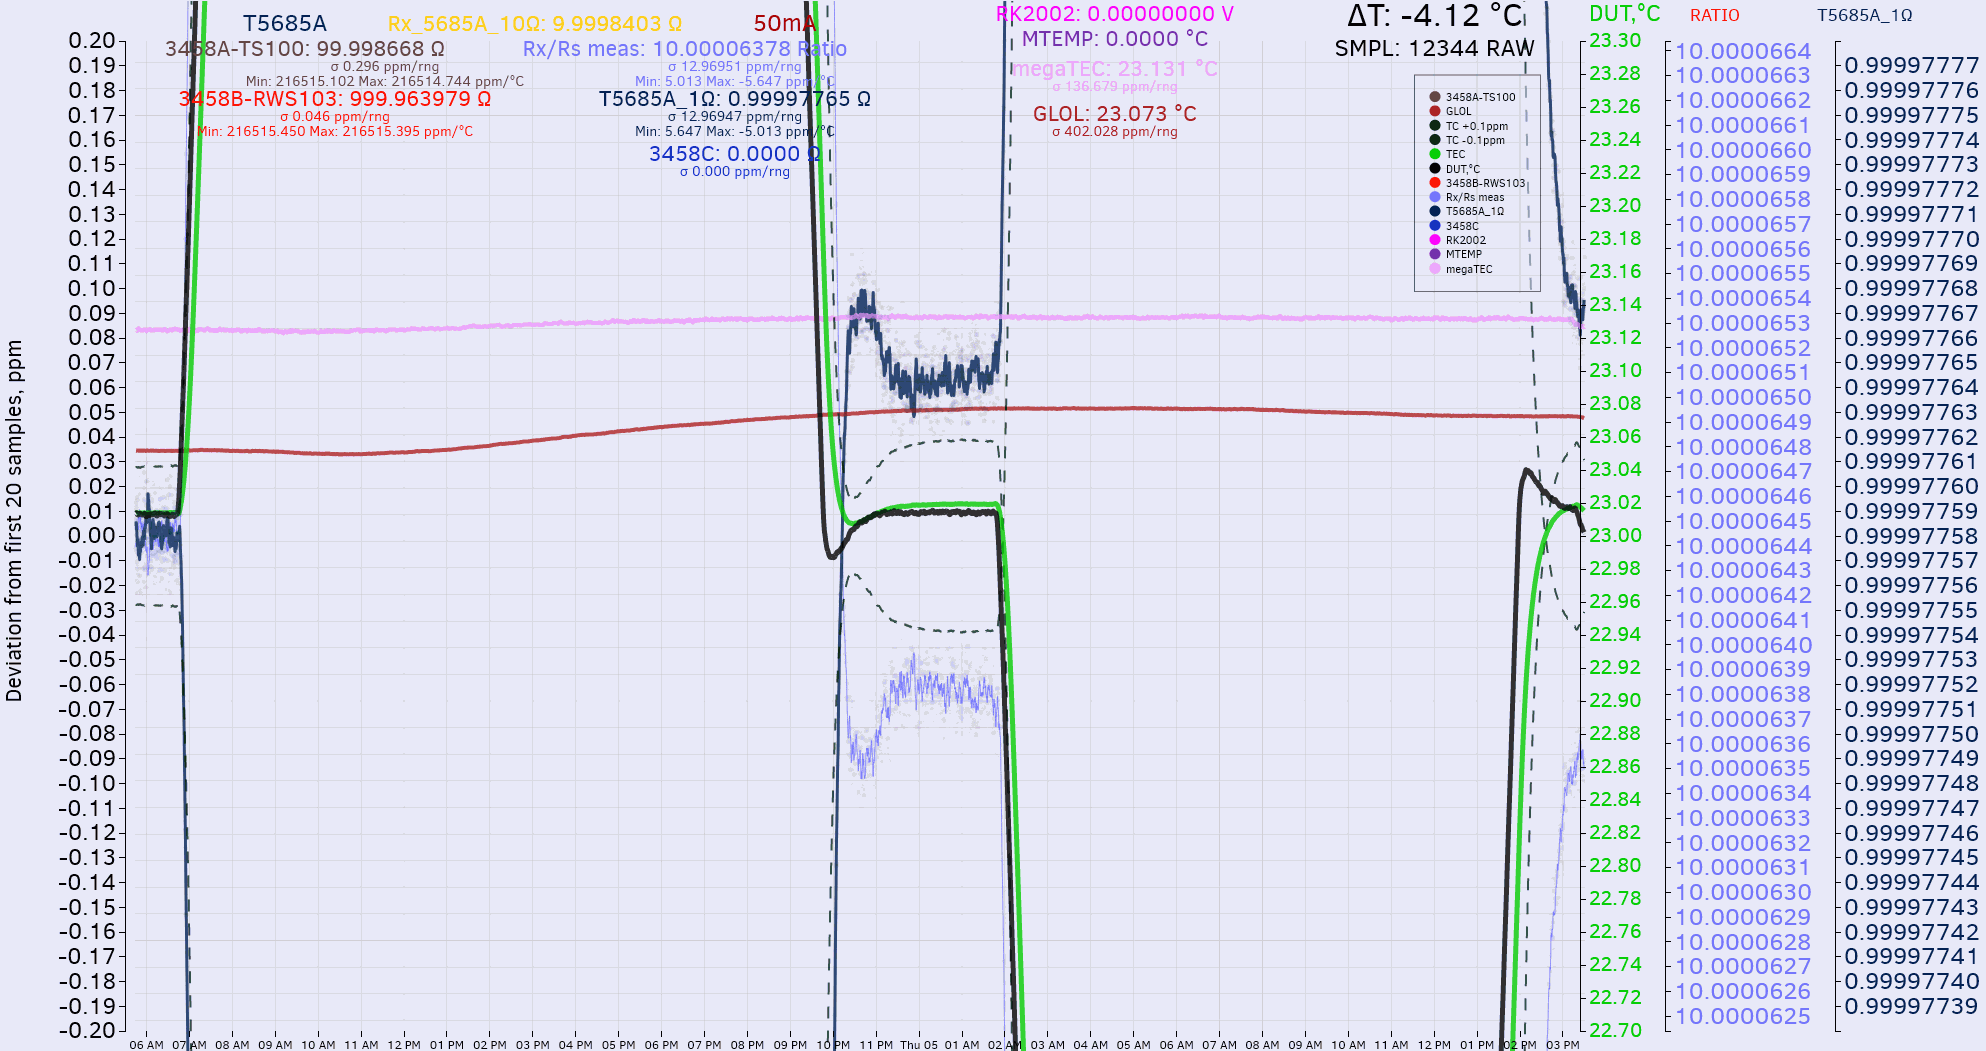
Image 27: Retrace close-up on data for Tinsley 5685A1 resistance standard
Temperature coefficients measured with DCC bridge for this standard are α : -5.334 ppm/°C and β = -0.080 ppm/°C2. This TCR is quote a bit outside expected factory specification ±2.0 ppm/°C for 5685A standards. Reversal of TCR curve calculated to be at -10.1 °C, quite is bit off desired nominal +20.0 °C. Offset from nominal at +23.0 °C is -22.2 ppm.
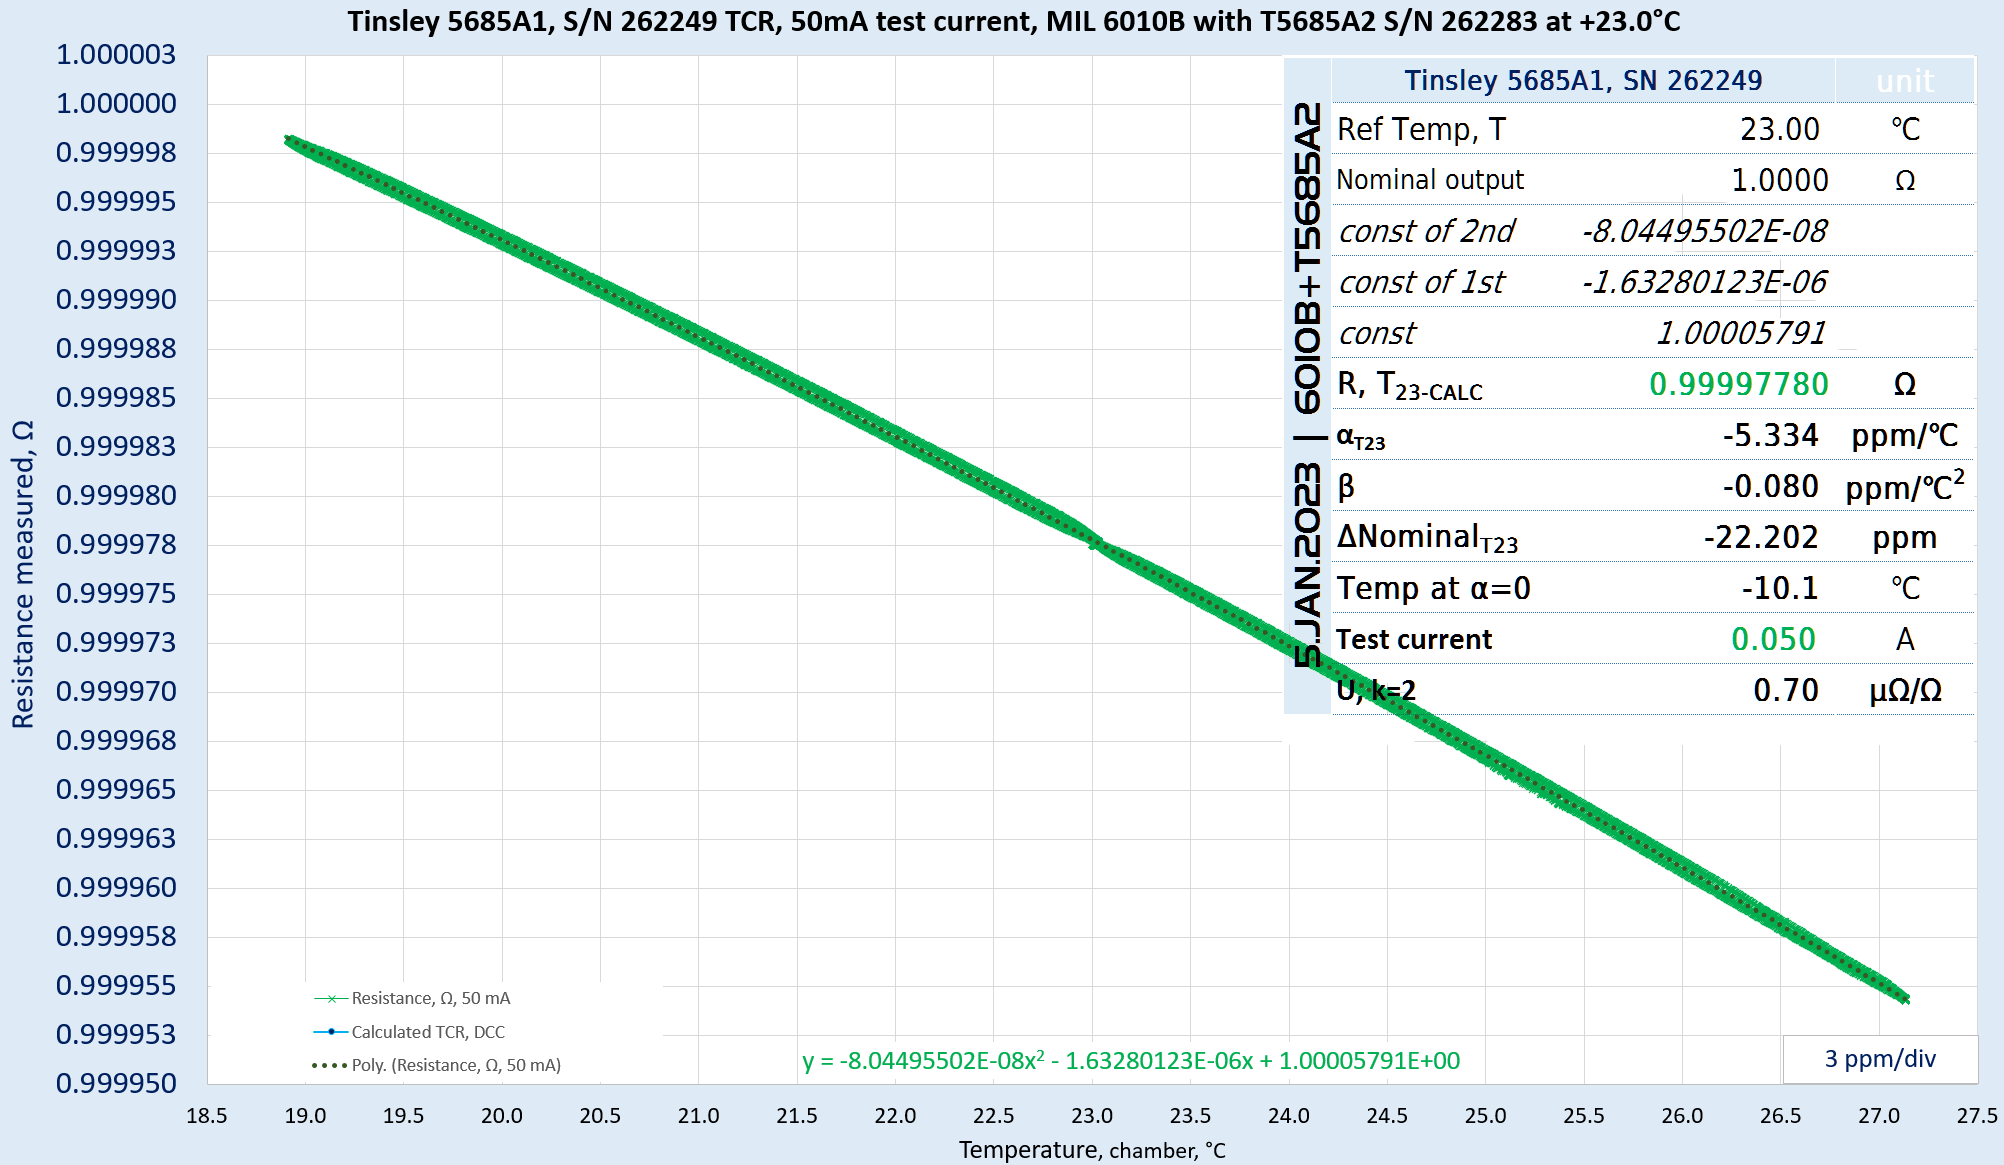
Image 28: Final 1 Ω standard TCR measurement scatter plot with analysis result
This standard was also retested with different reference standard and lower 31.6 mA test current. Reference standard in this test was Fluke 742A-1, calibrated previously against accredited 1 Ω resistance reference on April 9, 2022.
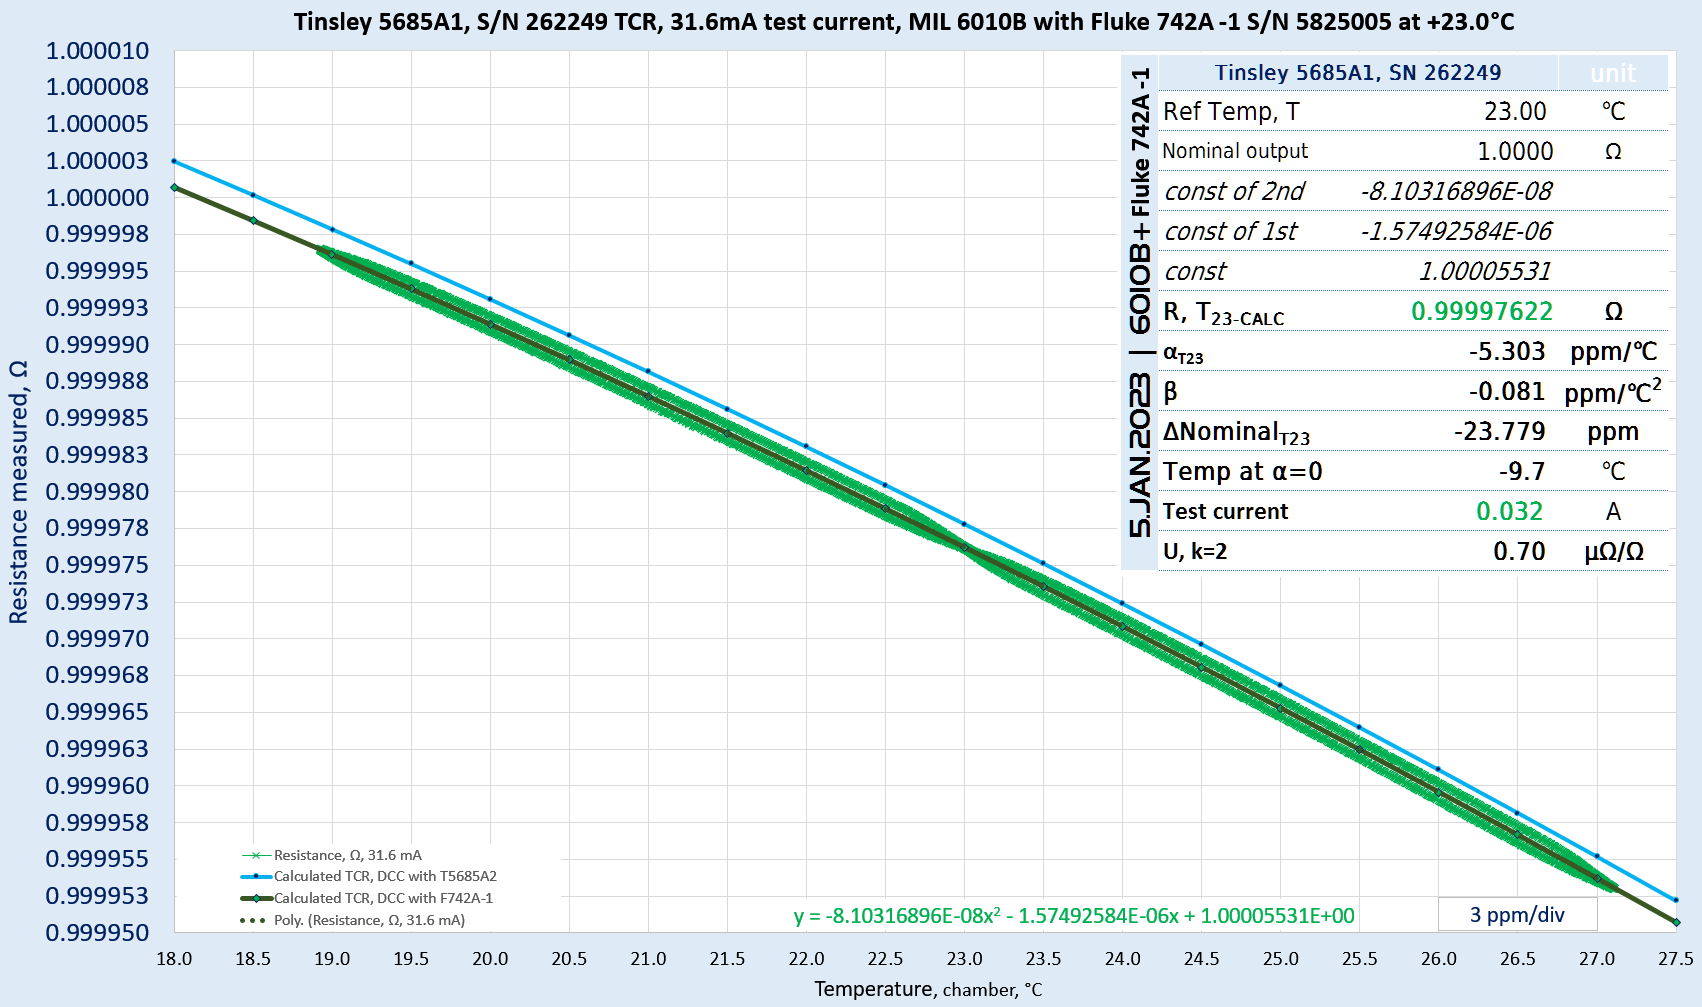
Image 29: 1 Ω standard TCR measurement obtained with alternate Fluke 742A-1 reference
Measurement data provided nearly identical α and β coefficients result with residual under ±0.2 ppm in range from +18 °C to well over +30 °C. However there is -1.6 ppm difference in absolute measurement calculation at +23.0 °C. Difference between 31.6 mA and 50.0 mA test current against same Fluke 742A-1 standard was measured to be +0.08 ppm, so this error is well below transfer uncertainty.
| DUT Temperature, °C | Calculated Ω / 5685A2 STD | Calculated Ω / 742A-1 | Resistance Δ | Residual |
|---|---|---|---|---|
| 16.0 | 1.00001122 | 1.00000937 | -1.85 ppm | -0.27 ppm |
| 16.5 | 1.00000909 | 1.00000727 | -1.82 ppm | -0.24 ppm |
| 17.0 | 1.00000692 | 1.00000512 | -1.80 ppm | -0.22 ppm |
| 17.5 | 1.00000471 | 1.00000294 | -1.77 ppm | -0.19 ppm |
| 18.0 | 1.00000247 | 1.00000071 | -1.76 ppm | -0.18 ppm |
| 18.5 | 1.00000018 | 0.99999844 | -1.74 ppm | -0.16 ppm |
| 19.0 | 0.99999785 | 0.99999614 | -1.71 ppm | -0.13 ppm |
| 19.5 | 0.99999549 | 0.99999379 | -1.70 ppm | -0.12 ppm |
| 20.0 | 0.99999308 | 0.99999140 | -1.68 ppm | -0.10 ppm |
| 20.5 | 0.99999063 | 0.99998897 | -1.66 ppm | -0.08 ppm |
| 21.0 | 0.99998815 | 0.99998650 | -1.65 ppm | -0.07 ppm |
| 21.5 | 0.99998562 | 0.99998399 | -1.63 ppm | -0.05 ppm |
| 22.0 | 0.99998305 | 0.99998144 | -1.61 ppm | -0.03 ppm |
| 22.5 | 0.99998045 | 0.99997885 | -1.60 ppm | -0.02 ppm |
| 23.0 | 0.99997780 | 0.99997622 | -1.58 ppm | 0.00 ppm |
| 23.5 | 0.99997511 | 0.99997355 | -1.56 ppm | 0.02 ppm |
| 24.0 | 0.99997238 | 0.99997084 | -1.54 ppm | 0.04 ppm |
| 24.5 | 0.99996962 | 0.99996808 | -1.54 ppm | 0.04 ppm |
| 25.0 | 0.99996681 | 0.99996529 | -1.52 ppm | 0.06 ppm |
| 25.5 | 0.99996396 | 0.99996246 | -1.50 ppm | 0.08 ppm |
| 26.0 | 0.99996108 | 0.99995958 | -1.50 ppm | 0.08 ppm |
| 26.5 | 0.99995815 | 0.99995667 | -1.48 ppm | 0.10 ppm |
| 27.0 | 0.99995518 | 0.99995371 | -1.47 ppm | 0.11 ppm |
| 27.5 | 0.99995217 | 0.99995072 | -1.45 ppm | 0.13 ppm |
| 28.0 | 0.99994913 | 0.99994768 | -1.45 ppm | 0.13 ppm |
| 28.5 | 0.99994604 | 0.99994460 | -1.44 ppm | 0.14 ppm |
| 29.0 | 0.99994291 | 0.99994149 | -1.42 ppm | 0.16 ppm |
| 29.5 | 0.99993975 | 0.99993833 | -1.42 ppm | 0.16 ppm |
| 30.0 | 0.99993654 | 0.99993513 | -1.41 ppm | 0.17 ppm |
| 30.5 | 0.99993329 | 0.99993189 | -1.40 ppm | 0.18 ppm |
| 31.0 | 0.99993001 | 0.99992861 | -1.40 ppm | 0.18 ppm |
| 31.5 | 0.99992668 | 0.99992529 | -1.39 ppm | 0.19 ppm |
| 32.0 | 0.99992331 | 0.99992193 | -1.38 ppm | 0.20 ppm |
| 32.5 | 0.99991991 | 0.99991853 | -1.38 ppm | 0.20 ppm |
| 33.0 | 0.99991646 | 0.99991509 | -1.37 ppm | 0.21 ppm |
| 33.5 | 0.99991297 | 0.99991161 | -1.36 ppm | 0.22 ppm |
| 34.0 | 0.99990944 | 0.99990809 | -1.35 ppm | 0.23 ppm |
| 34.5 | 0.99990588 | 0.99990452 | -1.36 ppm | 0.22 ppm |
| 35.0 | 0.99990227 | 0.99990092 | -1.35 ppm | 0.23 ppm |
| 35.5 | 0.99989862 | 0.99989728 | -1.34 ppm | 0.24 ppm |
| 36.0 | 0.99989494 | 0.99989359 | -1.35 ppm | 0.23 ppm |
Table 3: Difference between two reference standards TCR calculation for Tinsley 5685A1
Power coefficient verification
TBD.
Time stability
In progress, come back later.
Measurement Type A uncertainty analysis
Metrology science dictates that no measurement is valid without assigned uncertainty. There are multiple ways to evaluate uncertainty of the measurement. BIPM published The Guide to the Expression of Uncertainty in Measurement which is an international standard that provides a general framework for evaluating and expressing measurement uncertainty.
According to the GUM, measurement uncertainty is a quantitative expression of the dispersion of values that could reasonably be attributed to a measurement. The GUM provides a systematic approach for evaluating and expressing measurement uncertainty that is based on statistical analysis of the data. It can cover both random and systematic errors, and allows for the inclusion of various sources of uncertainty such as the accuracy of reference standards and the influence of environmental conditions on the measurement. However due to time constrains in this review only statistical Type A uncertainty is calculated.
Full uncertainty analysis and calculation can be quite complex, especially when all errors and factors of the measurement need to be accounted. For this time only statistical Type A measurement uncertainty calculated on datasets obtained from Measurements International 6010B DCC bridge ratios data and uncertainty assigned to our accredited reference standards. All uncertainty numbers are provided with 95% confidence interval. To aid with calculation Sandia Primary Standards Lab Suncal suite was used. It is powerful tool and openly available on GitHub.
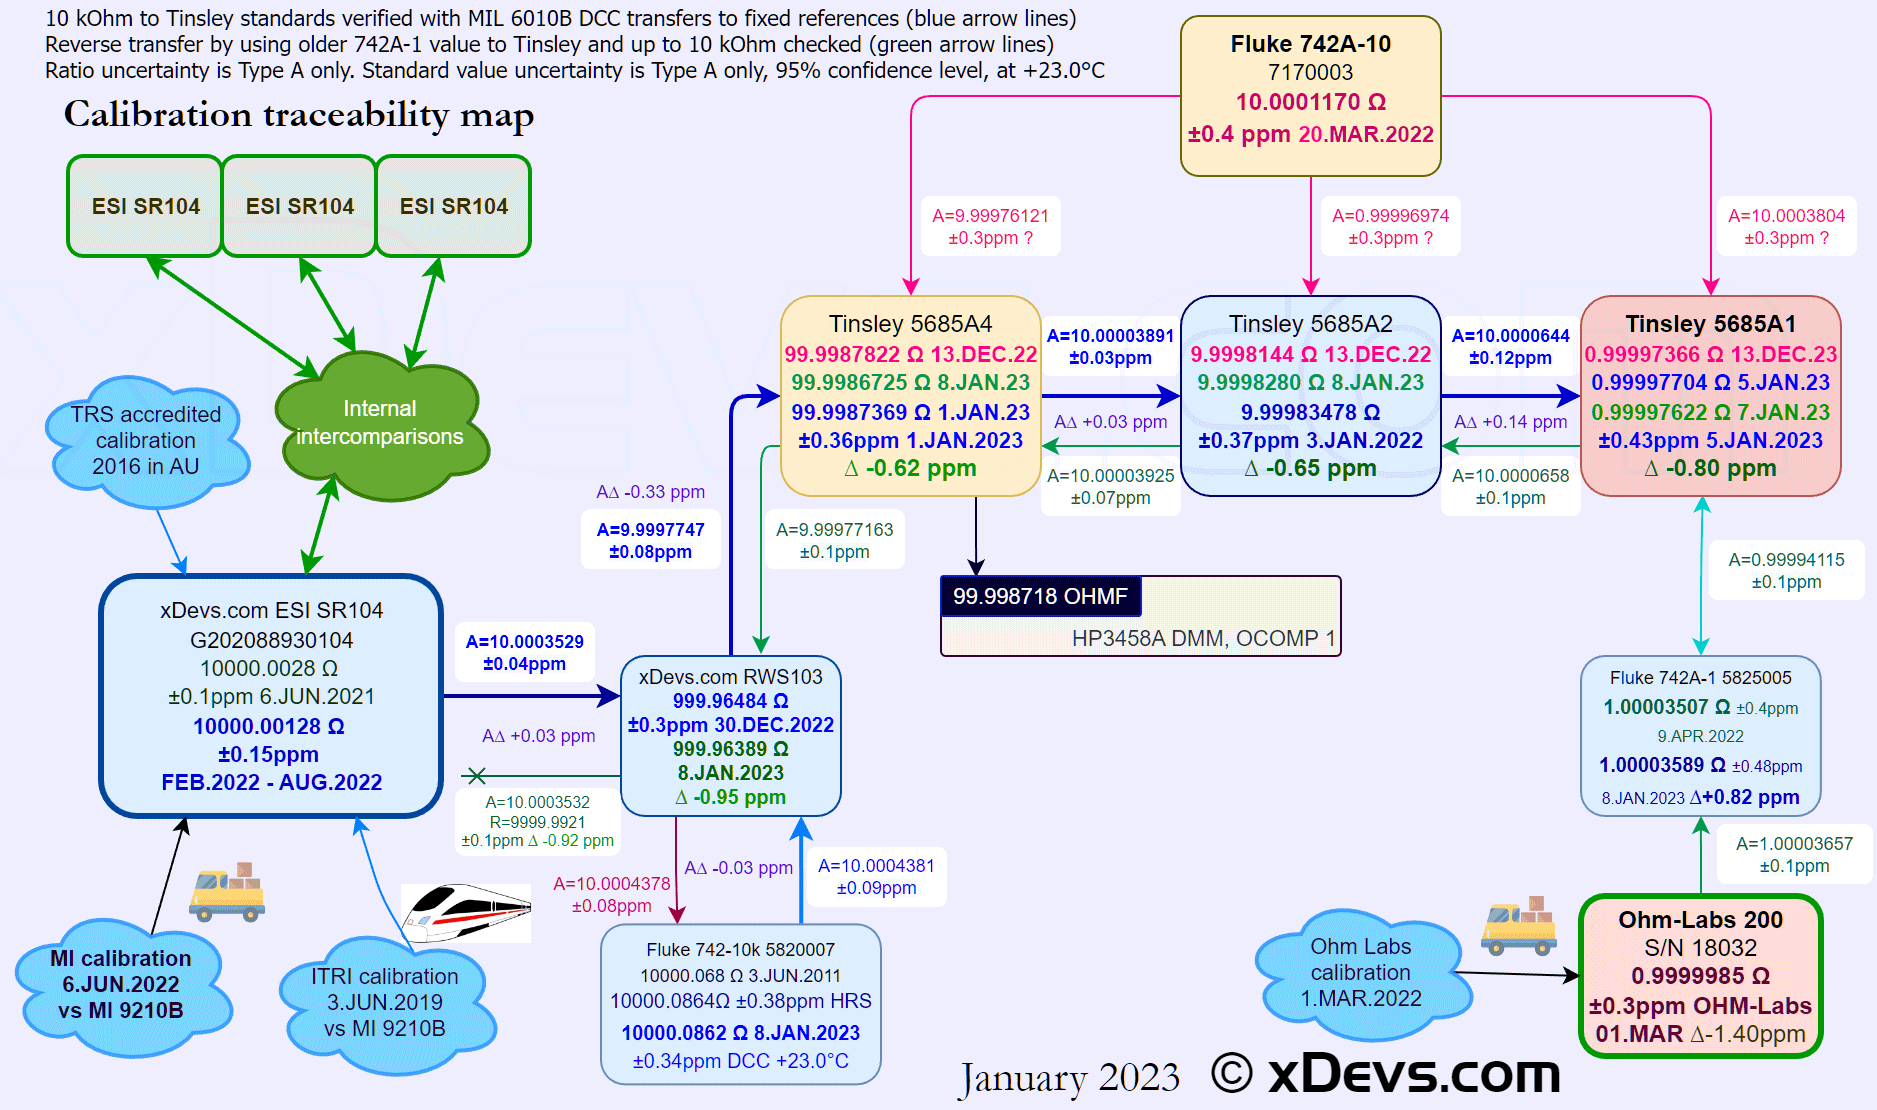
Image 30: Summary of all measurements with uncertainty propagation map
Feel free to click on the diagram to obtain draw.io diagram source file.
Type A uncertainty of transfers chain assigned starting from our primary traceable ESI SR104 standard, then going to xDevs RWS103 transfer 1 kΩ standard and following Tinsley standards chain. This path is outlined on diagram with bold blue arrows. Assigned uncertainty of measurement is outlined in blue font as ± ppm readings in each standard box. All transfers were based on ratios measured with fixed 23.0 °C temperature in thermal well of resistors (or ground post in case of Fluke 742A and RWS103 standards).
Tinsley 5685A uncertainty calculation report
Tinsley 5685A uncertainty calculation, source code for Suncal
I’d like to also use this occasion to mention great open-source diagram drawing tool, draw.io . Draw.io is a free tool that allows users to create a wide range of diagrams, including flowcharts, mind maps, UML diagrams, and more. It is available both in online version and as offline draw.io Desktop standalone program. I’ve started to use it year ago by suggestion from Nikolai Beev and it serves the task on illustration metrology experiments perfectly.
Measurement results summary
Here are all results to date in the Table 4 summary.
| Model and serial | Calibration date | Assigned value | Uncertainty | Temperature coefficient | Method | Test current | Note |
|---|---|---|---|---|---|---|---|
| ESI SR104 reference | MI 8.JUN.2021 | 10000.00128 Ω at +23 °C | ±0.1 ppm | α -0.03 ppm/°C, β -0.028 ppm/°C2, τ = >8 hour | DCC & 6000A HSB | 0.000316 A | Primary |
| Transfer RWS103 RSTD | Process calibration | 999.96484 Ω at +23 °C | ±0.3 ppm | Linear TC +0.8 ppm/°C | DCC vs SR104 | 0.00316 A | Transfer |
| 5865A-100, S/N 262763 | DEC.2022 | 99.9987822 Ω at +23 °C | TBD | Linear TC +0.8 ppm/°C | DCC vs NF742A-10 | 0.010 A | Initial |
| 5865A-100, S/N 262763 | 1.JAN.2023 | 99.9987369 Ω at +23 °C | ±0.36 ppm | α +0.862 ppm/°C, β -0.076 ppm/°C2, τ = <1 hour | DCC vs xDevs.com RWS103 | 0.010 A | Reference |
| 5865A-100, S/N 262763 | 4.JAN.2023 | 99.998802 Ω at +23 °C | ± 6 ppm | α +1.024 ppm/°C, β -0.091 ppm/°C2 | Keysight 3458A/002 | 0.001 A | +0.2 ppm vs DCC |
| 5865A-10, S/N 262283 | DEC.2022 | 9.99981441 Ω at +23 °C | TBD | Linear TC = -3.9 ppm/°C | DCC vs NF742A-10 | 0.031 A | Initial |
| 5865A-10, S/N 262283 | 3.JAN.2023 | 9.99983478 Ω at +23 °C | ±0.37 ppm | α -3.734 ppm/°C, β -0.080 ppm/°C2, τ = 1 hour | DCC vs T5685A-100 S/N 262763 | 0.0316 A | Reference |
| 5865A-10, S/N 262283 | 3.AUG.2024 | 9.99981615 Ω at +23 °C | ±0.3 ppm | DCC vs Guildline 9330 S/N 40707 | 0.01 A | Reference | |
| 5865A-10, S/N 262283 | 15.JAN.2025 | 9.9998258 Ω at +23 °C | ±0.4 ppm | α -3.804 ppm/°C, β -0.080 ppm/°C2, ZTC: -0.8 °C | DCC vs Guildline 9330 S/N 40707 | 0.0316 A | Reference |
| 5865A-1, S/N 262249 | DEC.2022 | 0.99997366 Ω at +23 °C | TBD | Linear TC = -5.5 ppm/°C | DCC vs NF742A-10 | 0.100 A | Initial |
| 5865A-1, S/N 262249 | 5.JAN.2023 | 0.99997704 Ω at +23 °C | ±0.43 ppm | α -5.334 ppm/°C, β -0.08 ppm/°C2, τ 3 hour | DCC vs T5685A-10 S/N 262283 | 0.050 A | Reference |
| 5865A-1, S/N 262249 | 7.JAN.2023 | 0.99997622 Ω at +23 °C | N/A | α -5.303 ppm/°C, β -0.081 ppm/°C2, τ 3 hour | DCC vs Fluke 742A-1 S/N 5825005 | 0.0316 A | Cross-check |
Table 4: Tinsley resistance standard measurement results summary
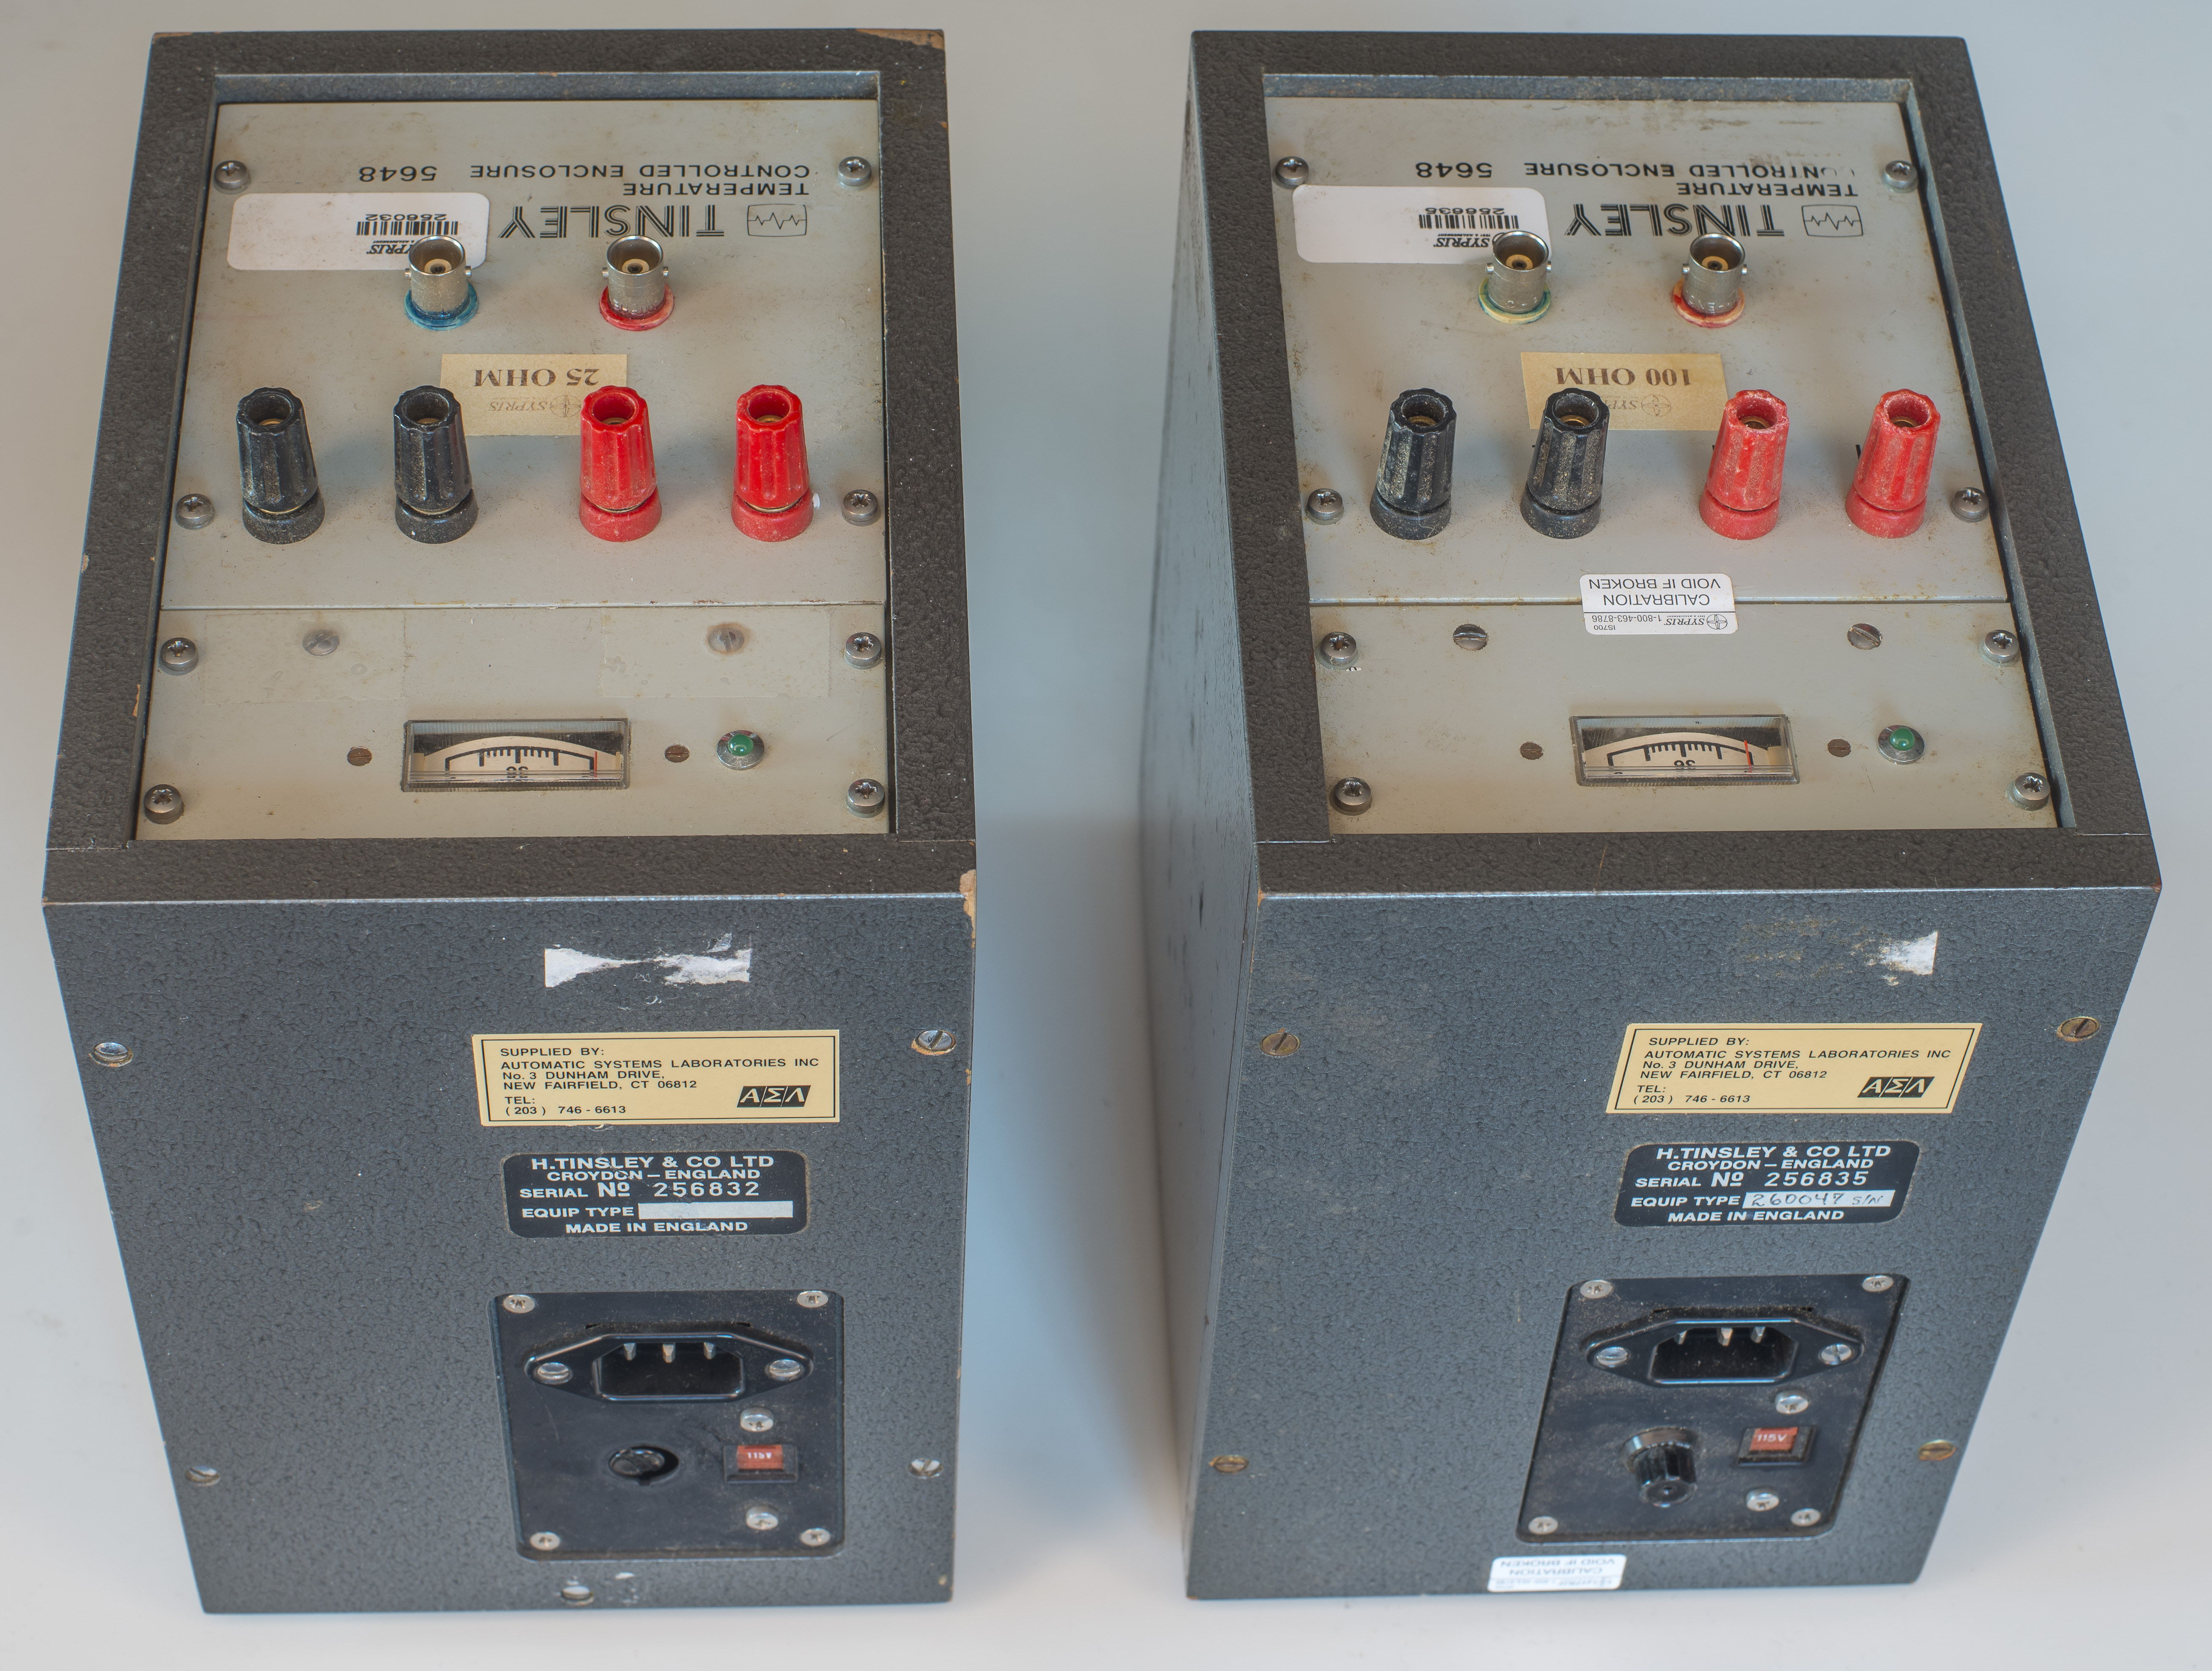
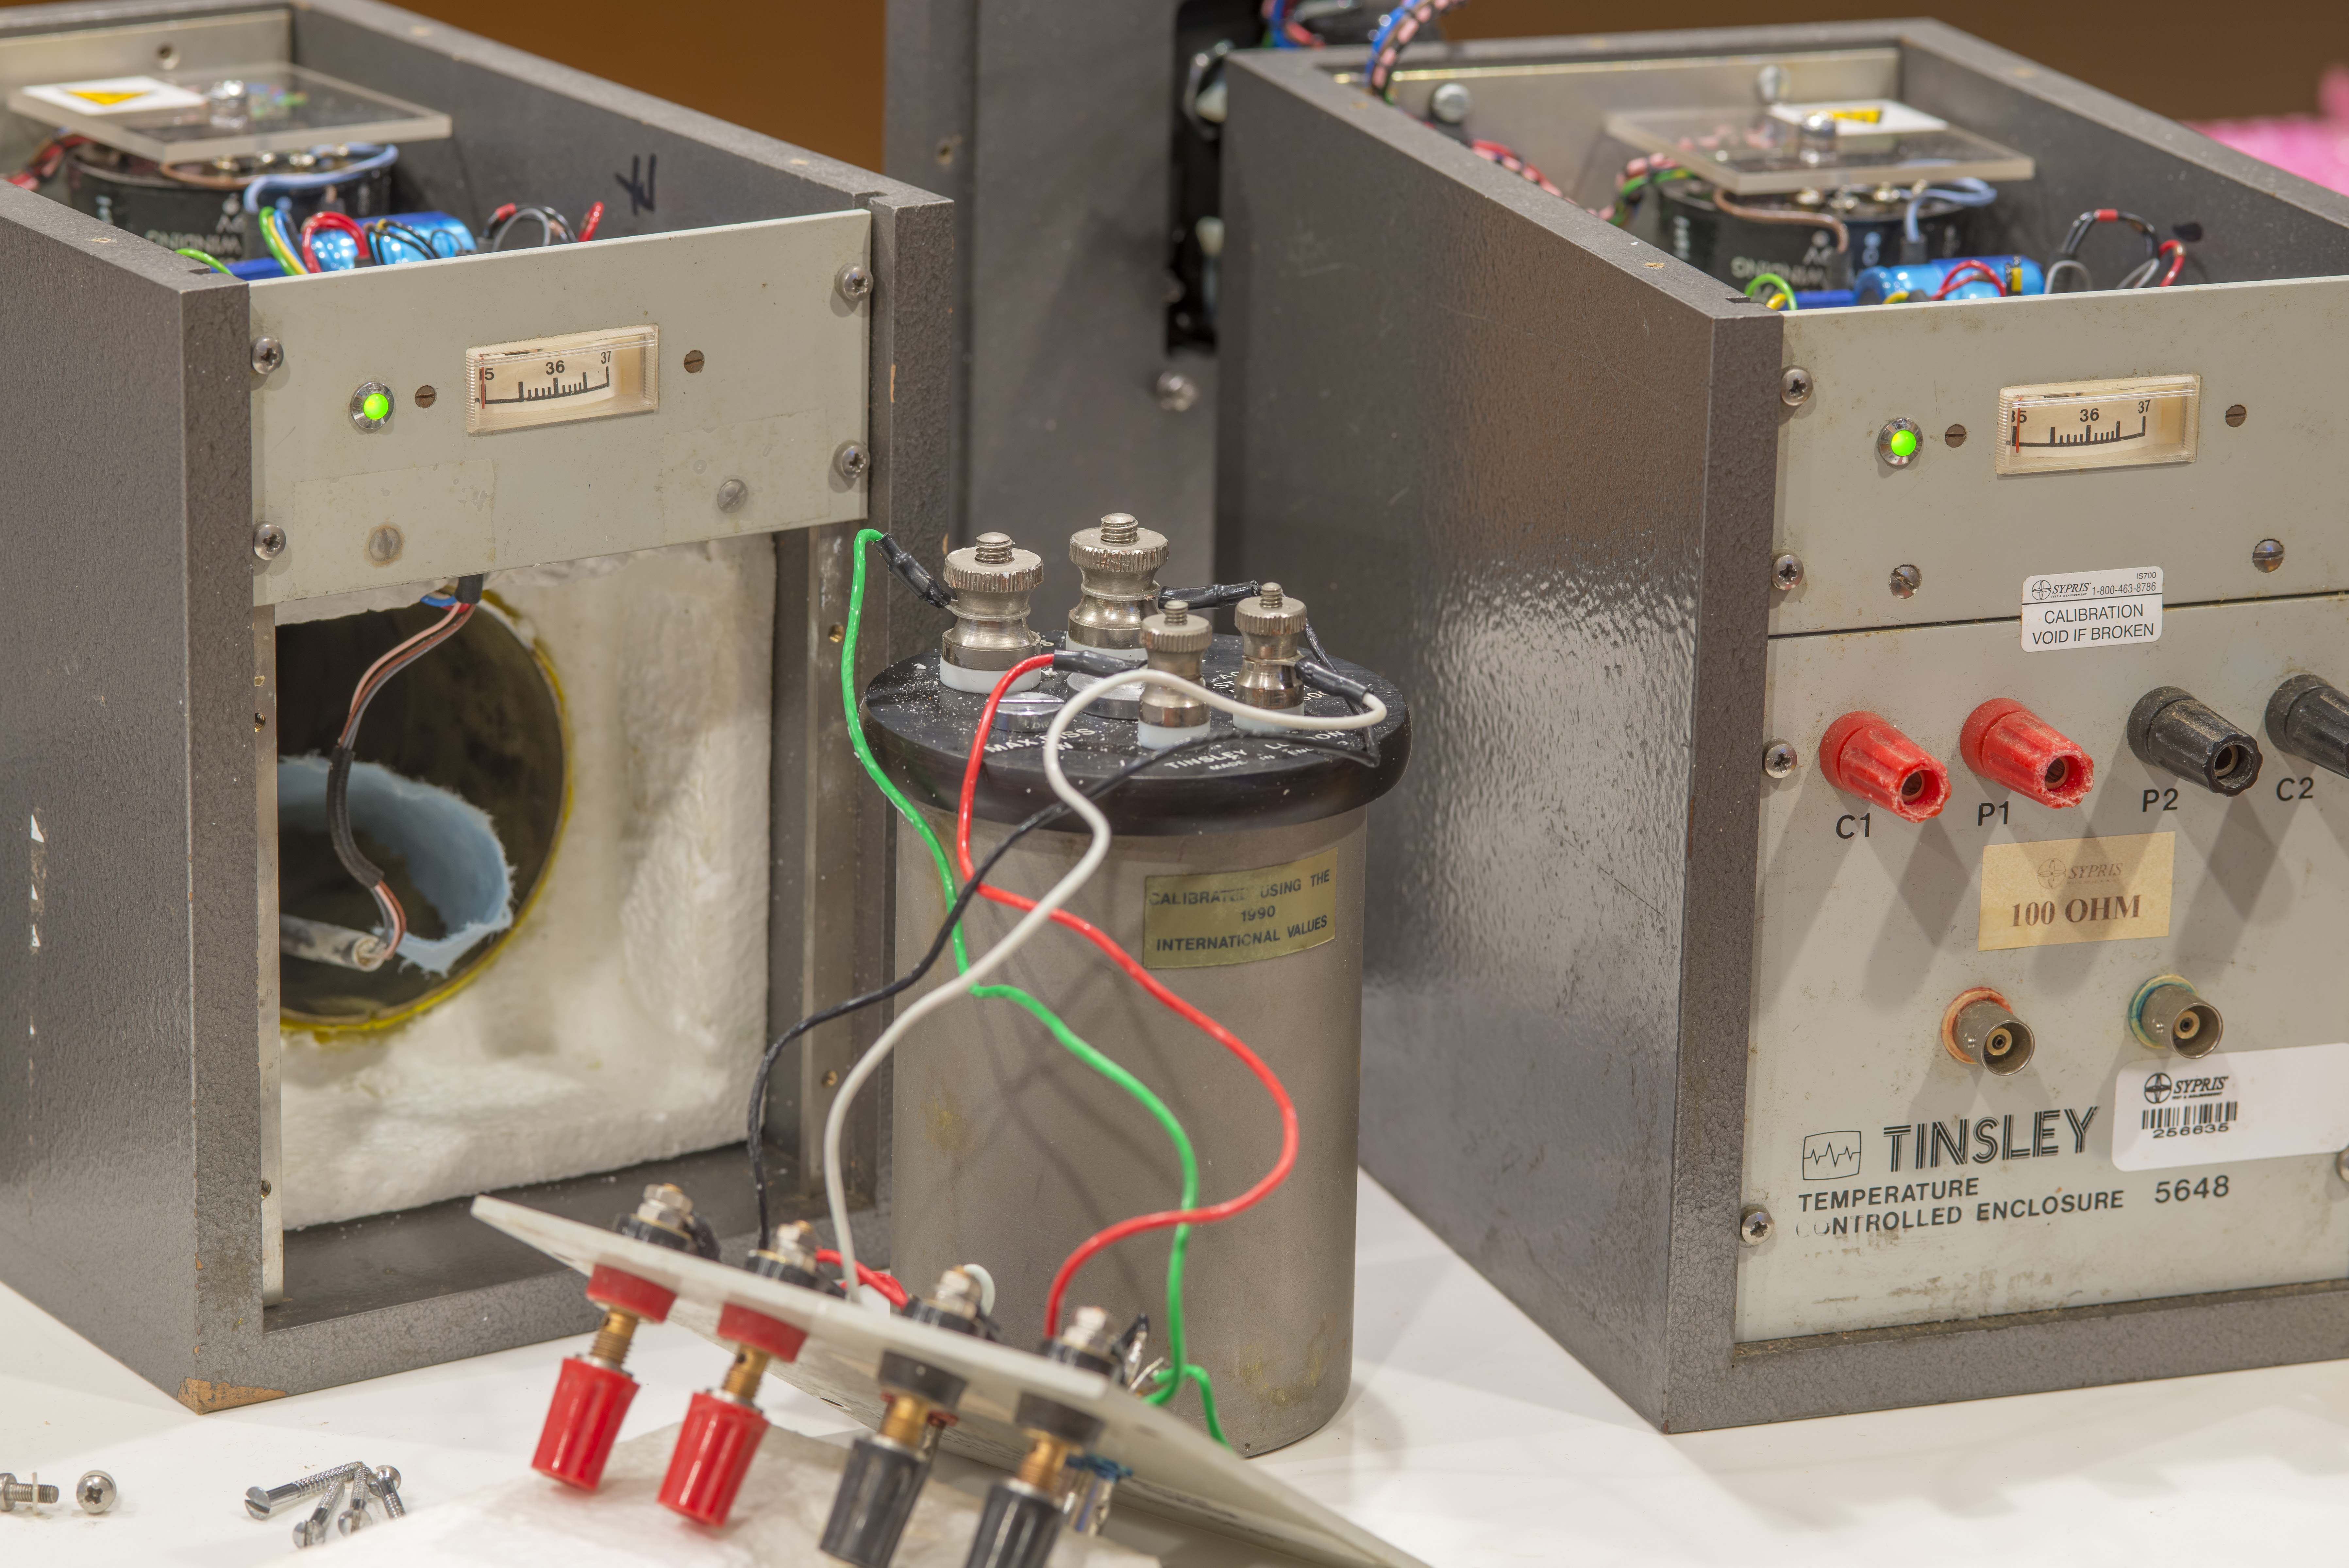
Tinsley 5648 oven enclosure units teardown
Our friend with codename Nikonoid managed to score a pair of ovenized Tinsley resistance kits, fitted with 5865A-100 and 5865A-25 standards. Both came with original Model 5648 oven enclosures, so it will be interesting to see how they are designed. Sadly there is no manual or much information available online about this Tinsley 5648 oven enclosure. Hopefully this teardown will resolve the issue now.
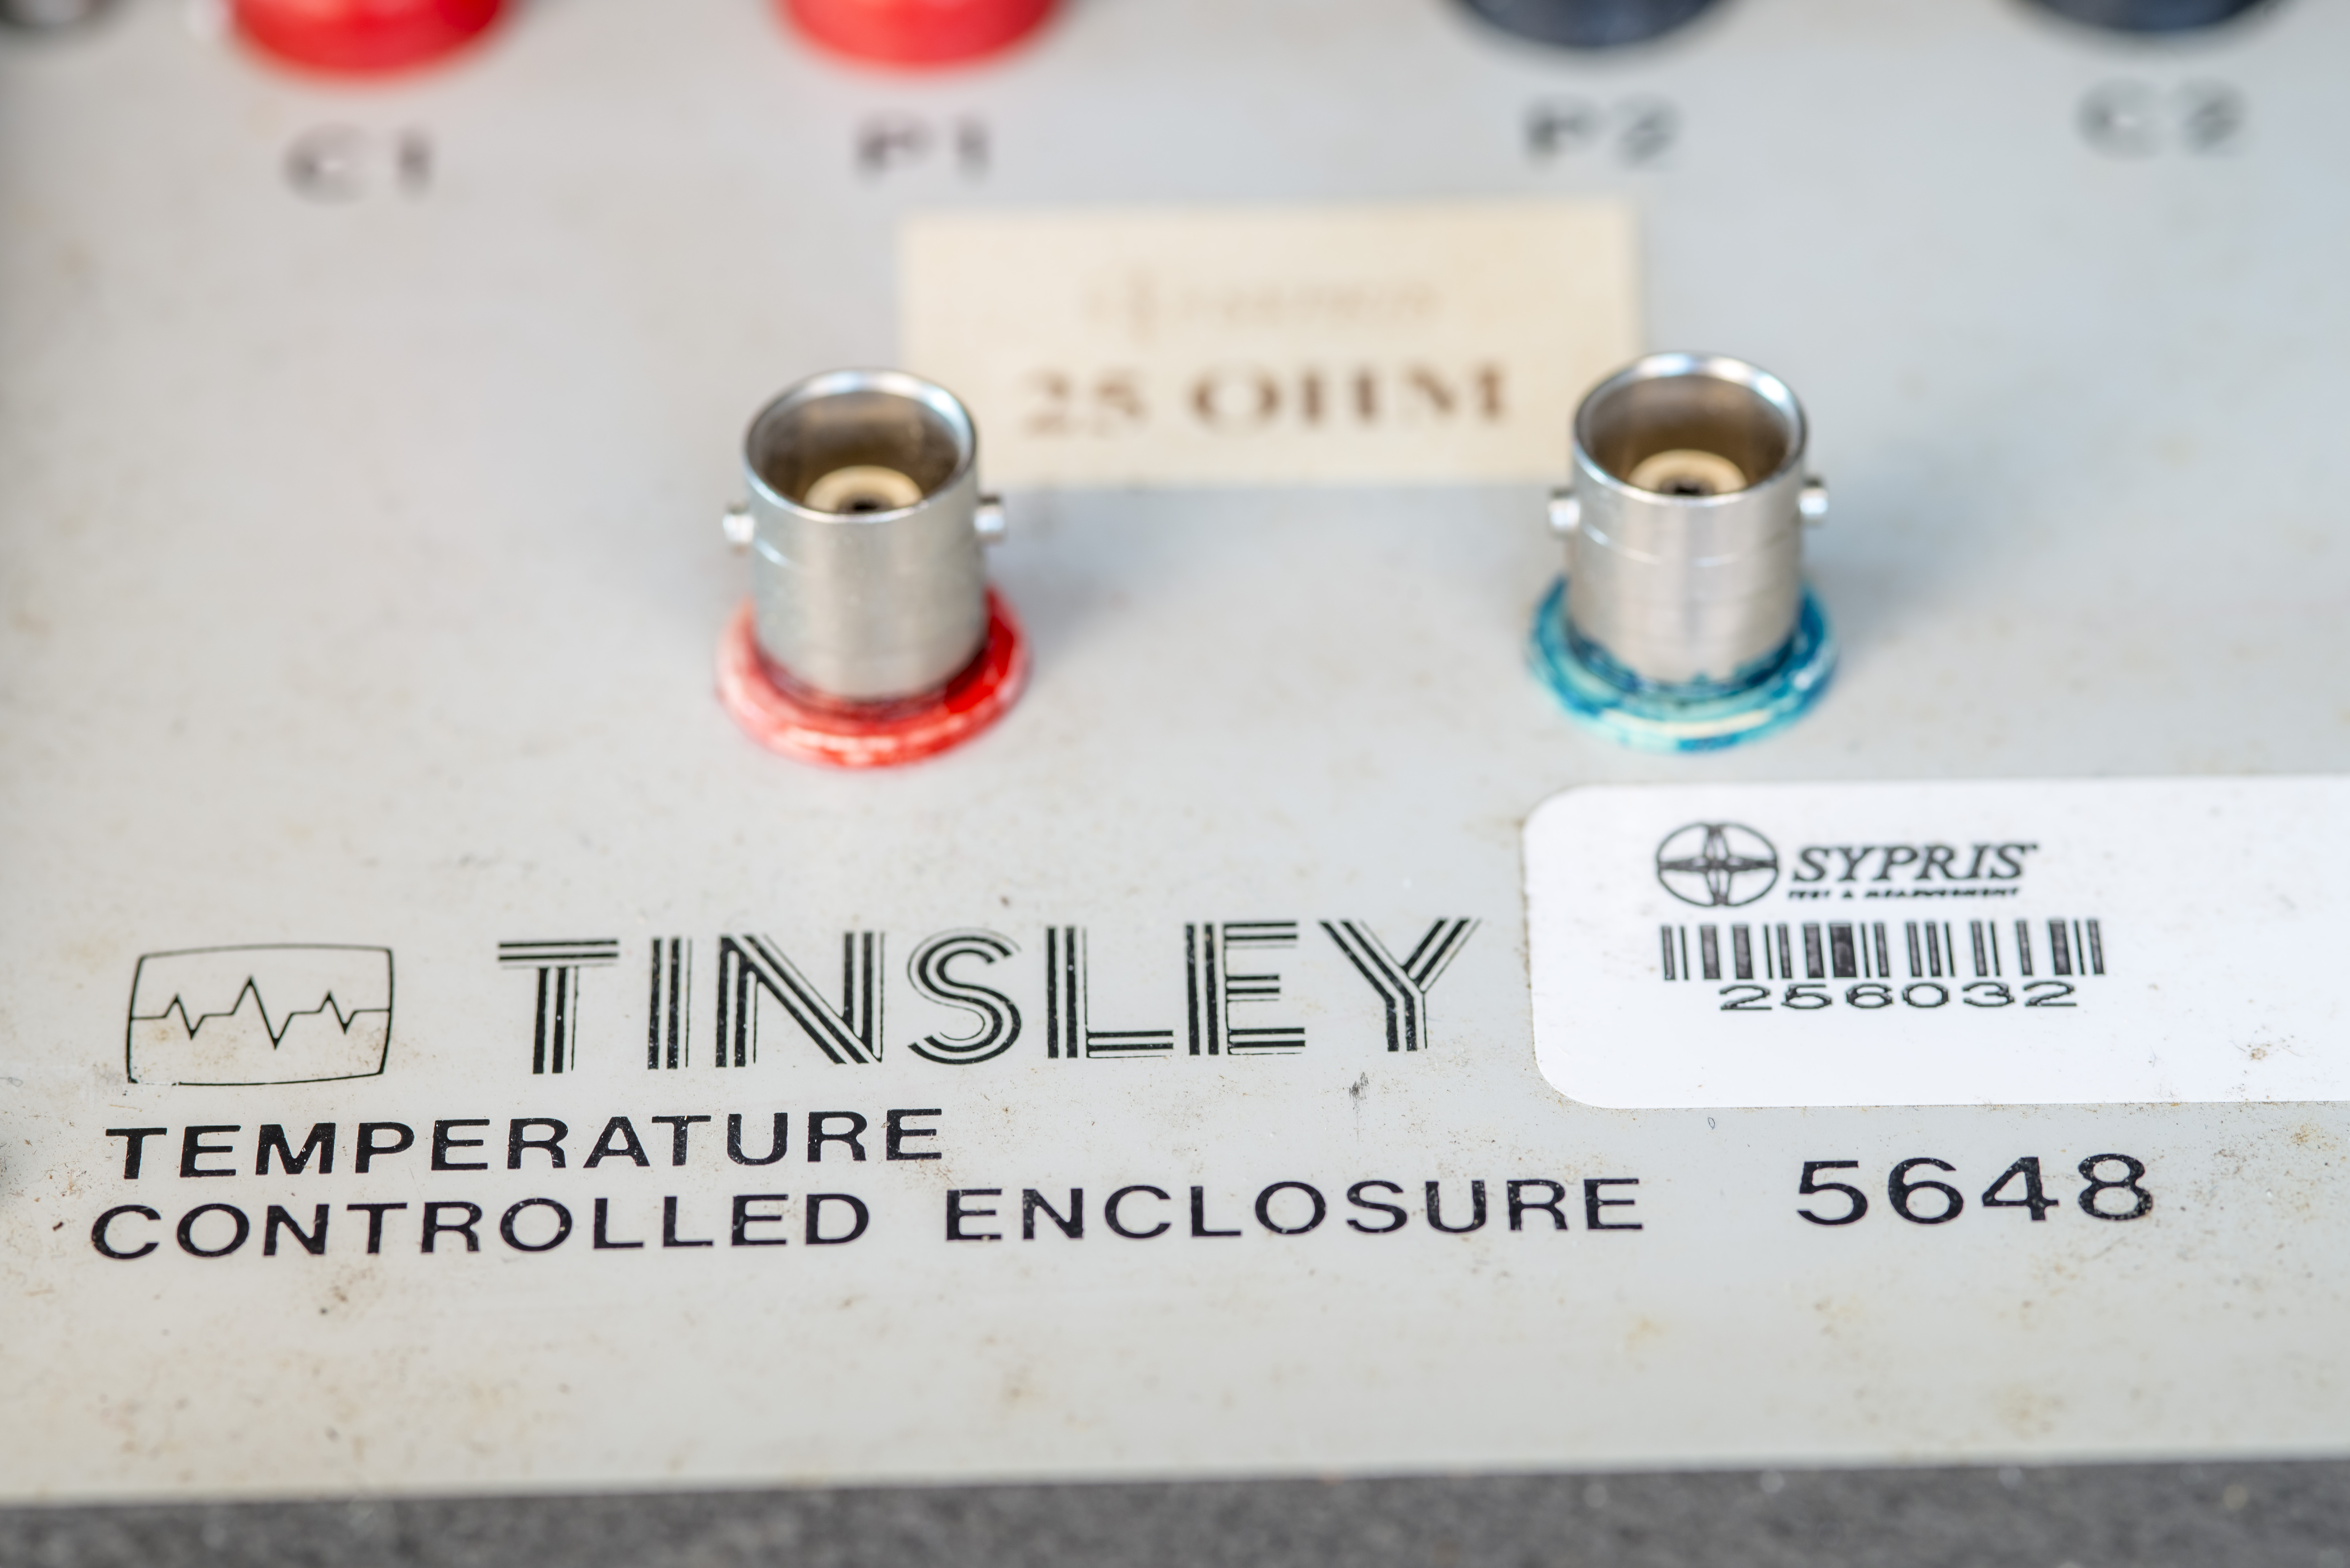
Tinsley oven box Model 5648 is designed to be compact and self-contained with power supply, electronics circuitry and heating chamber built into a compact wooden box. It is designed to be operated with terminals pointing straight up and mains power connection at the back. It’s a little bit weird in orientation and proportions, but not uncommon for English-made instrumentation :).
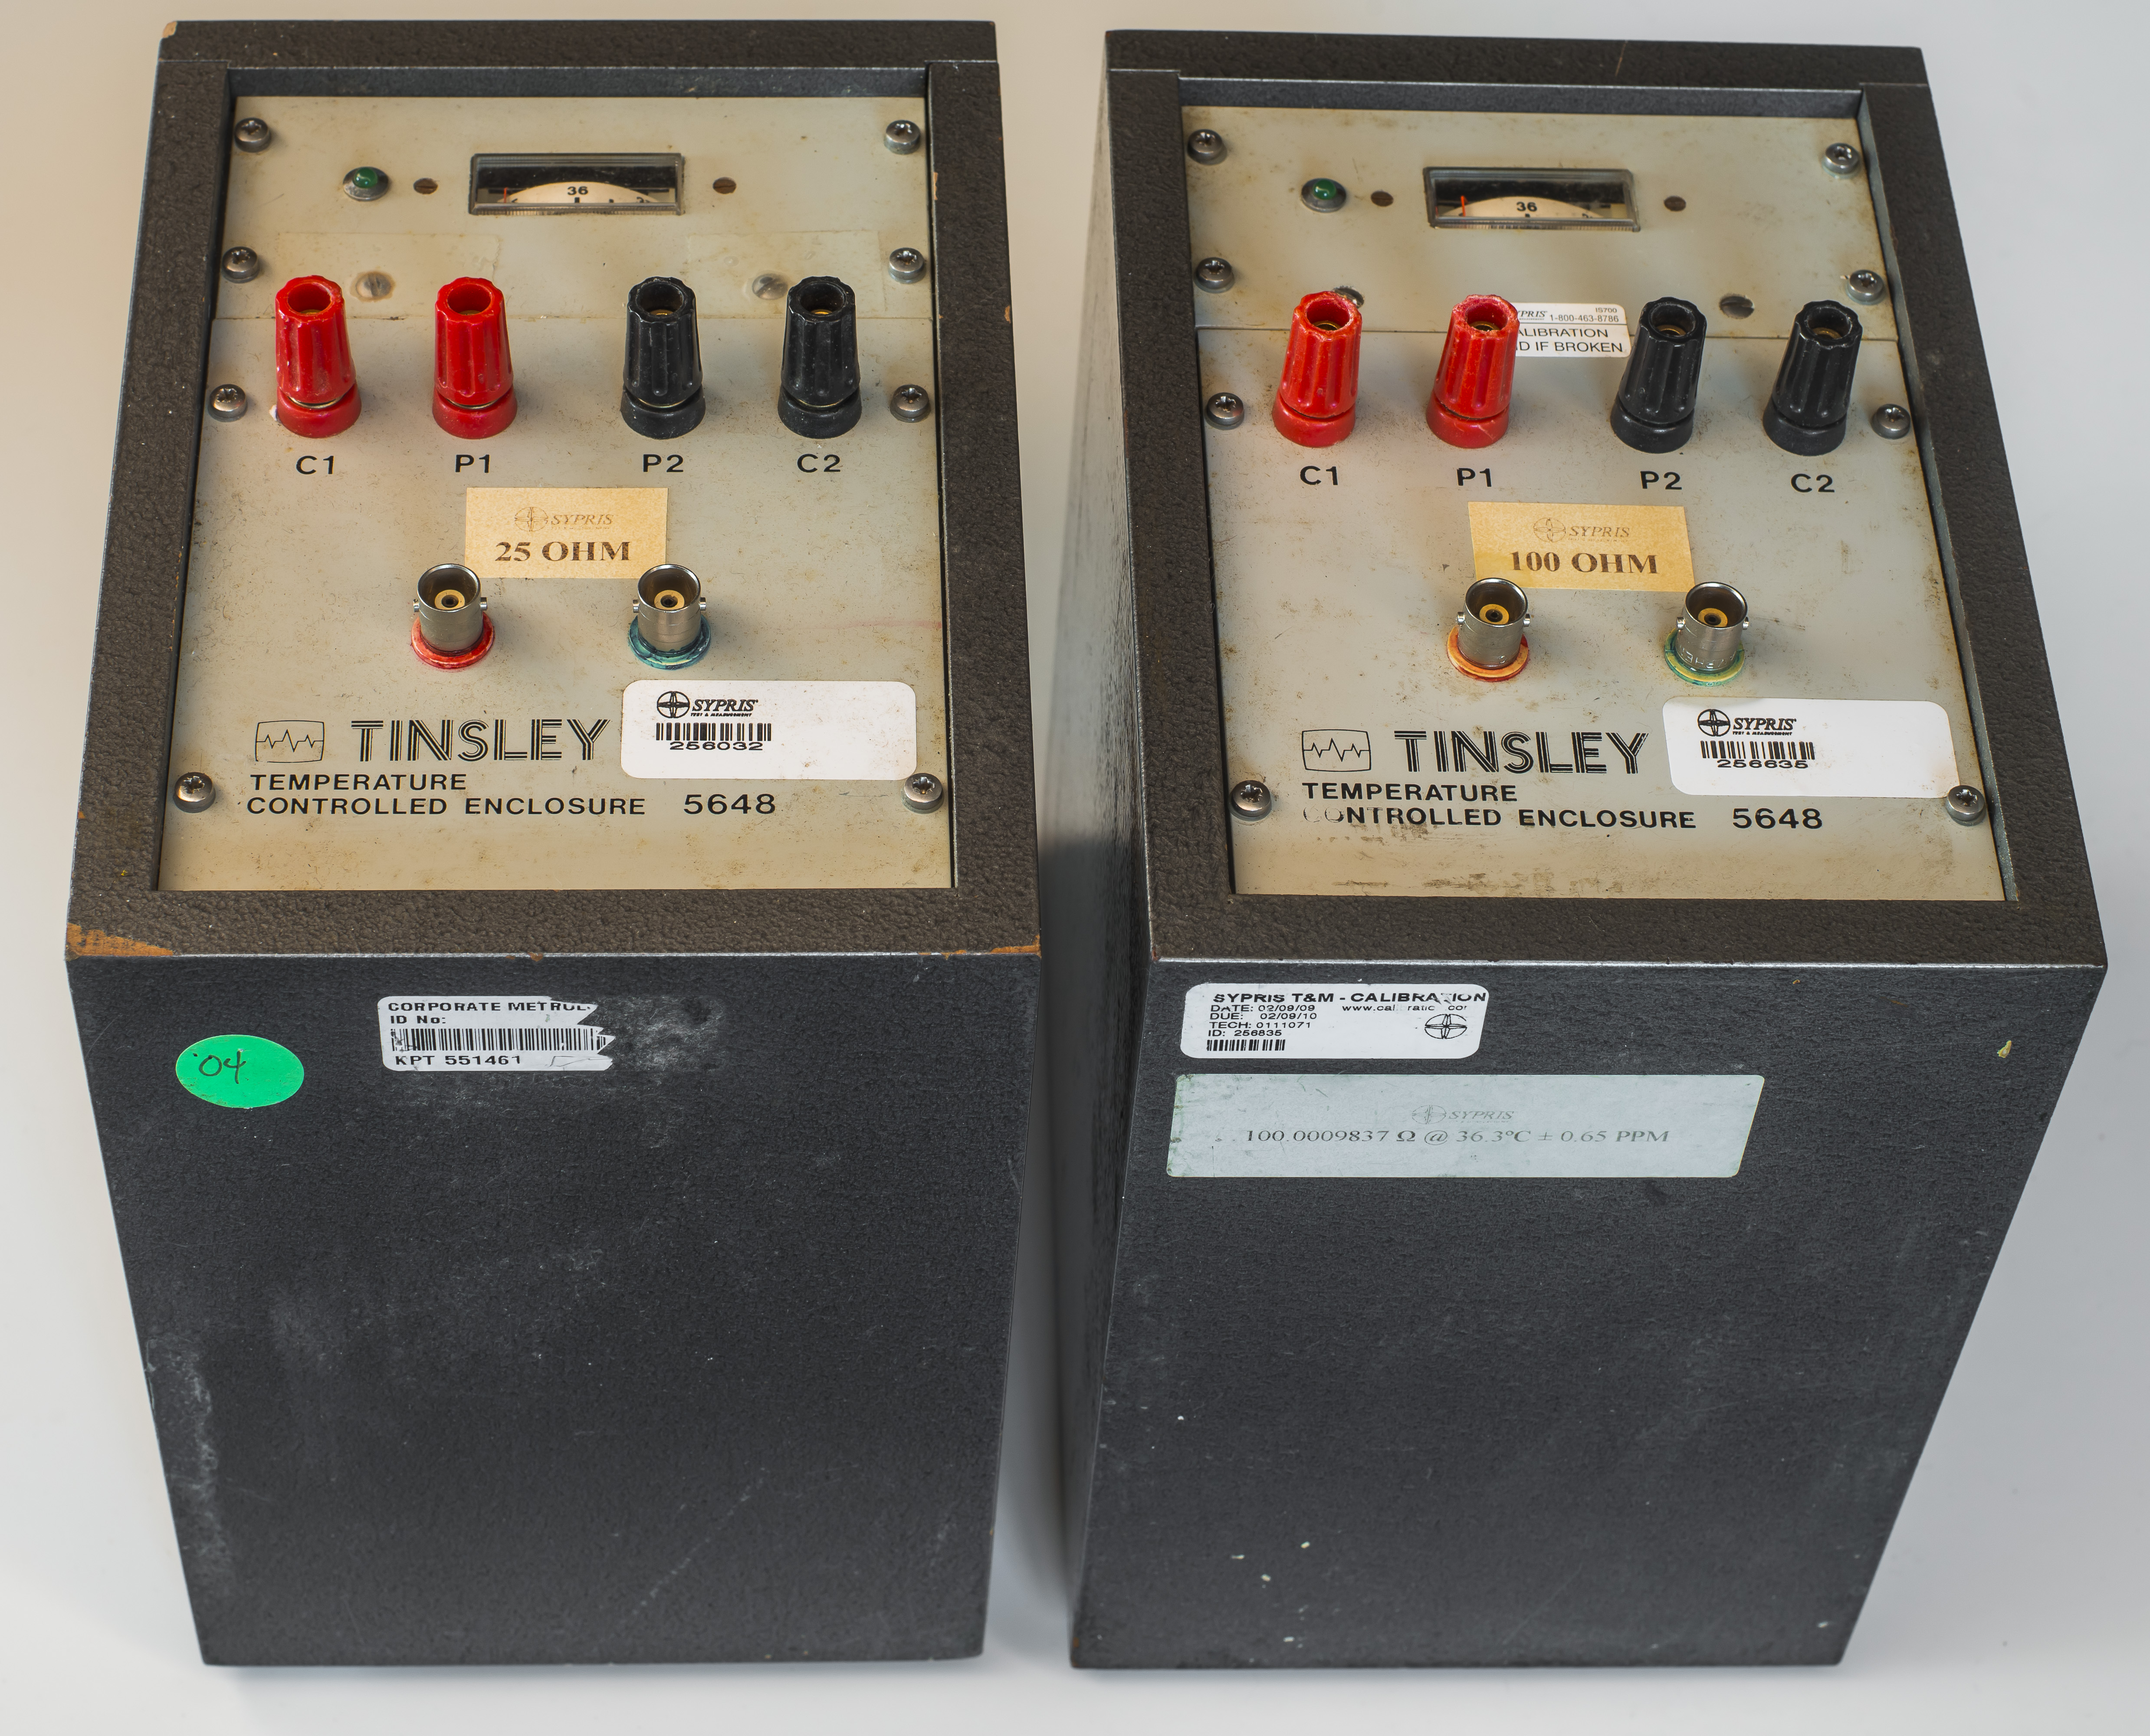
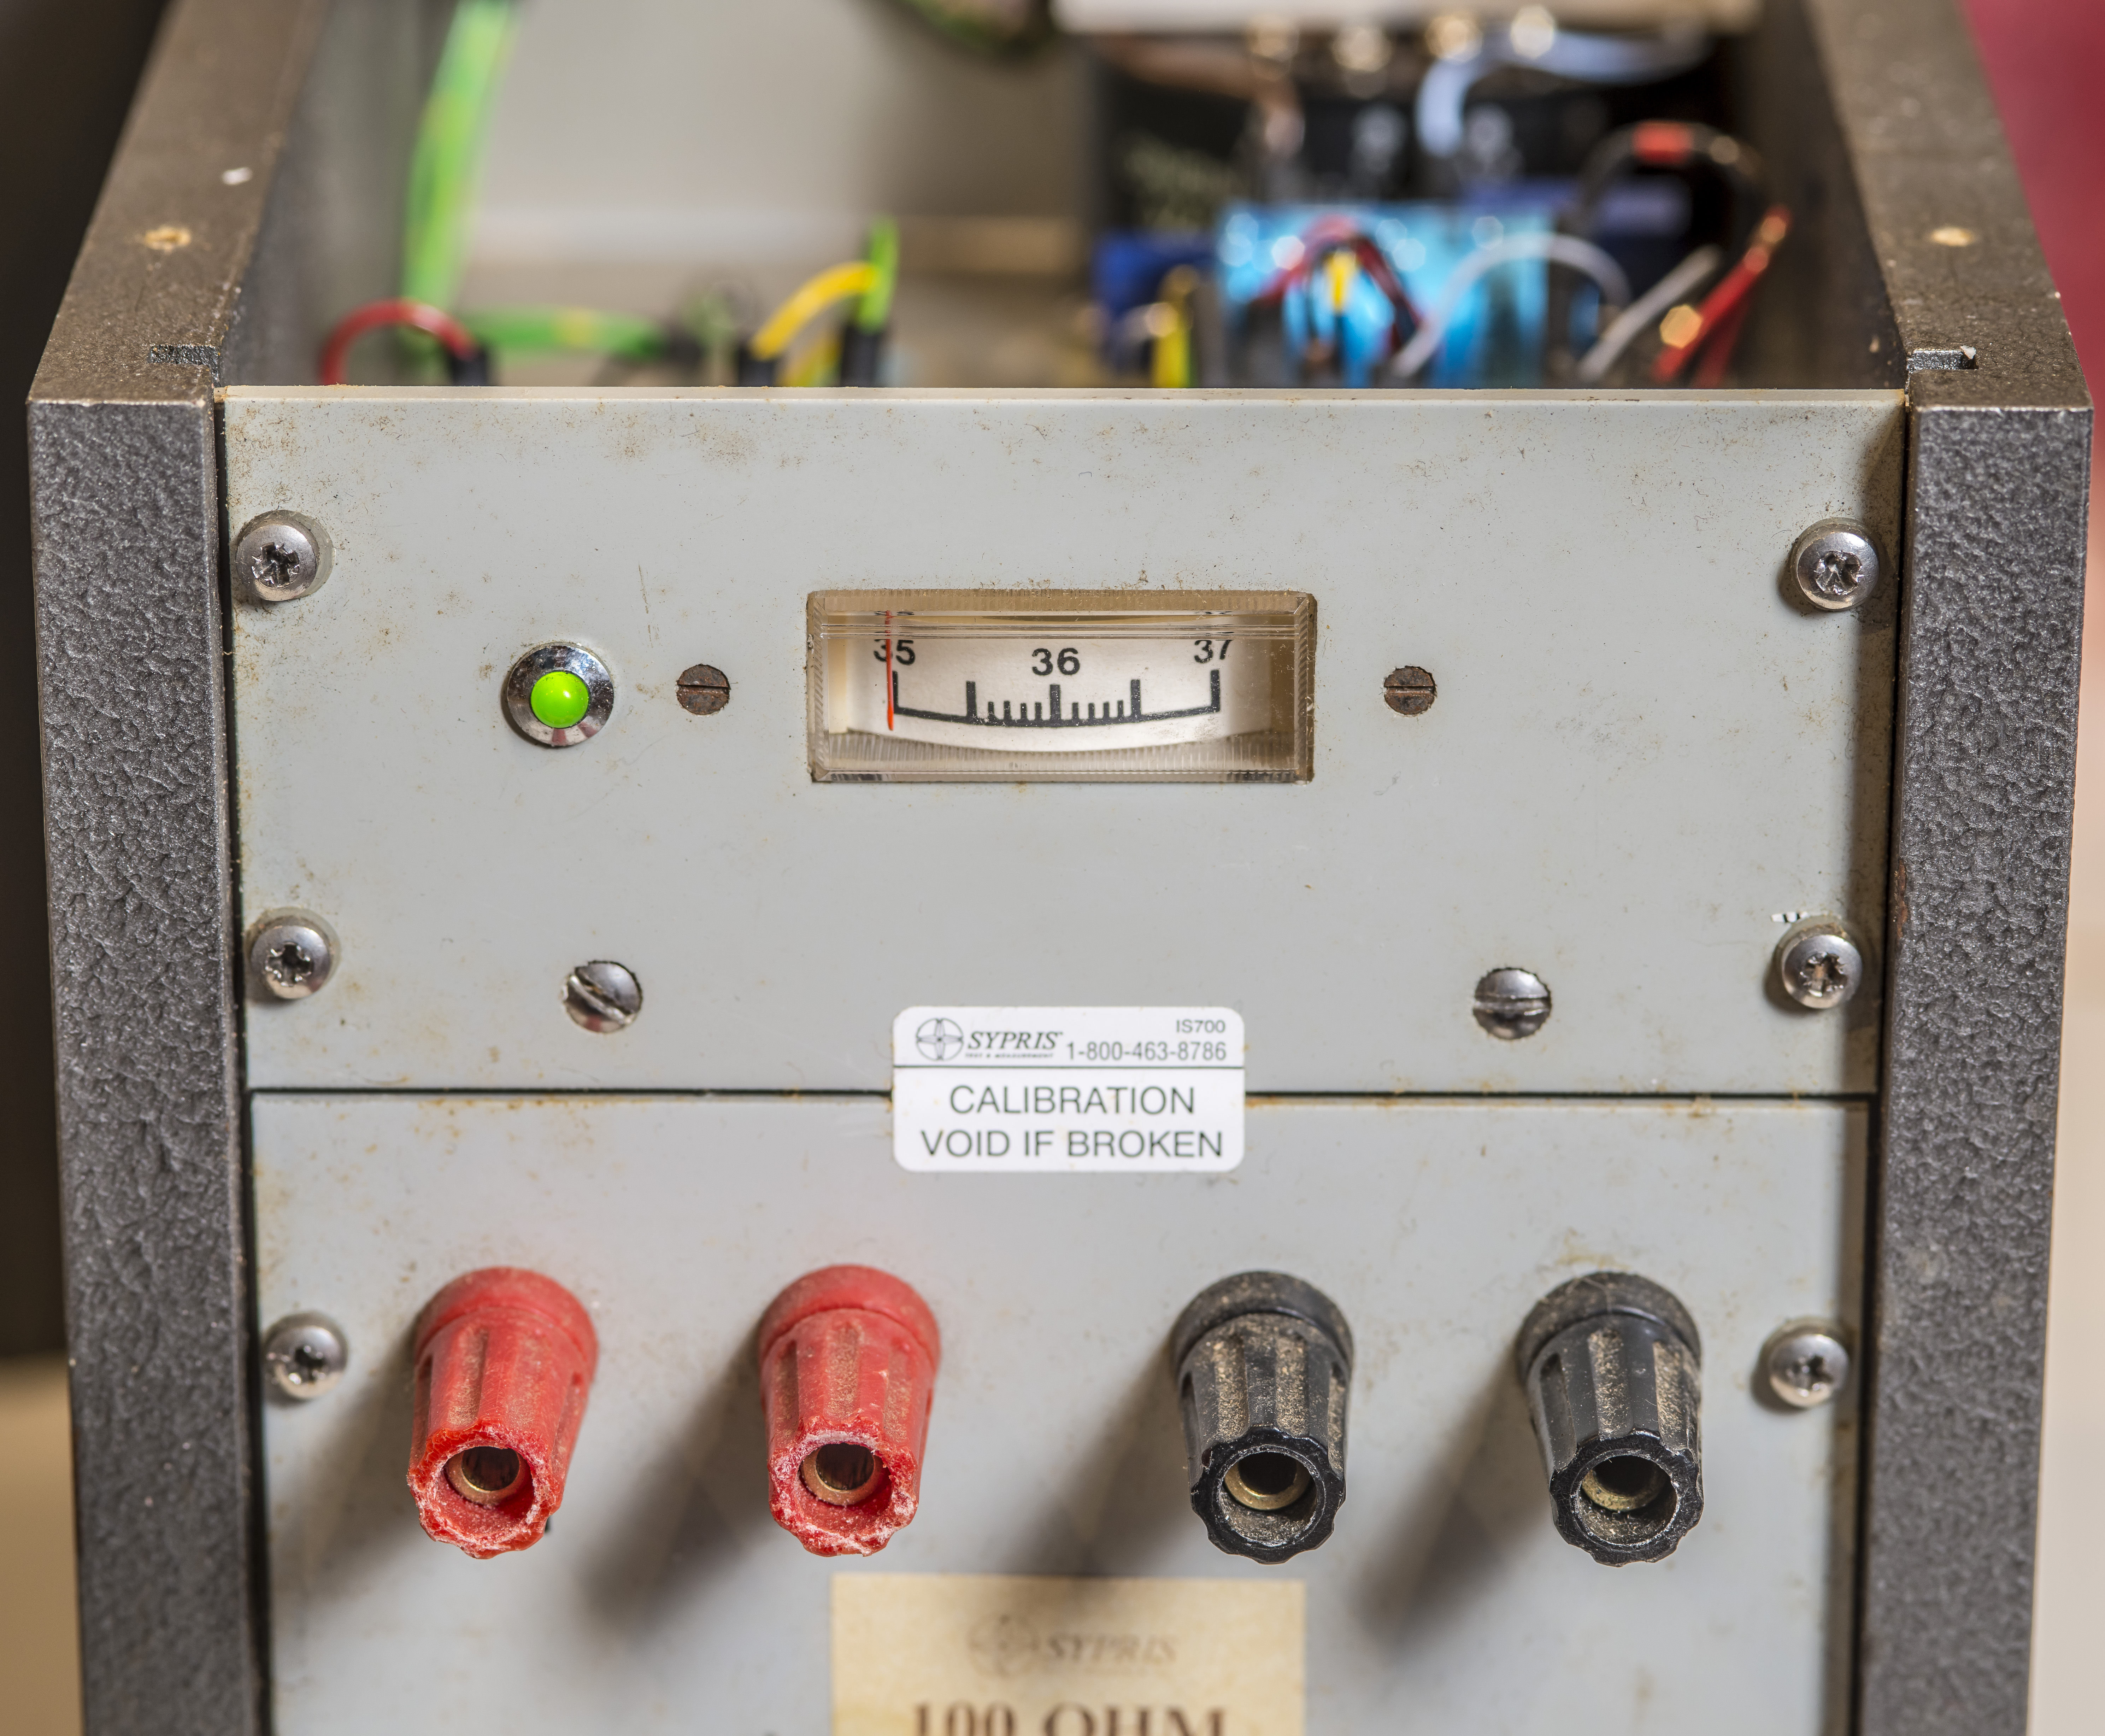
The standard with nominal 100 Ω even has a calibration label from Sypris T&M calibration from 9 February, 2009 with value statement 100.0009837 Ω at +36.3 °C with claimed uncertainty ±0.65 µΩ/Ω.
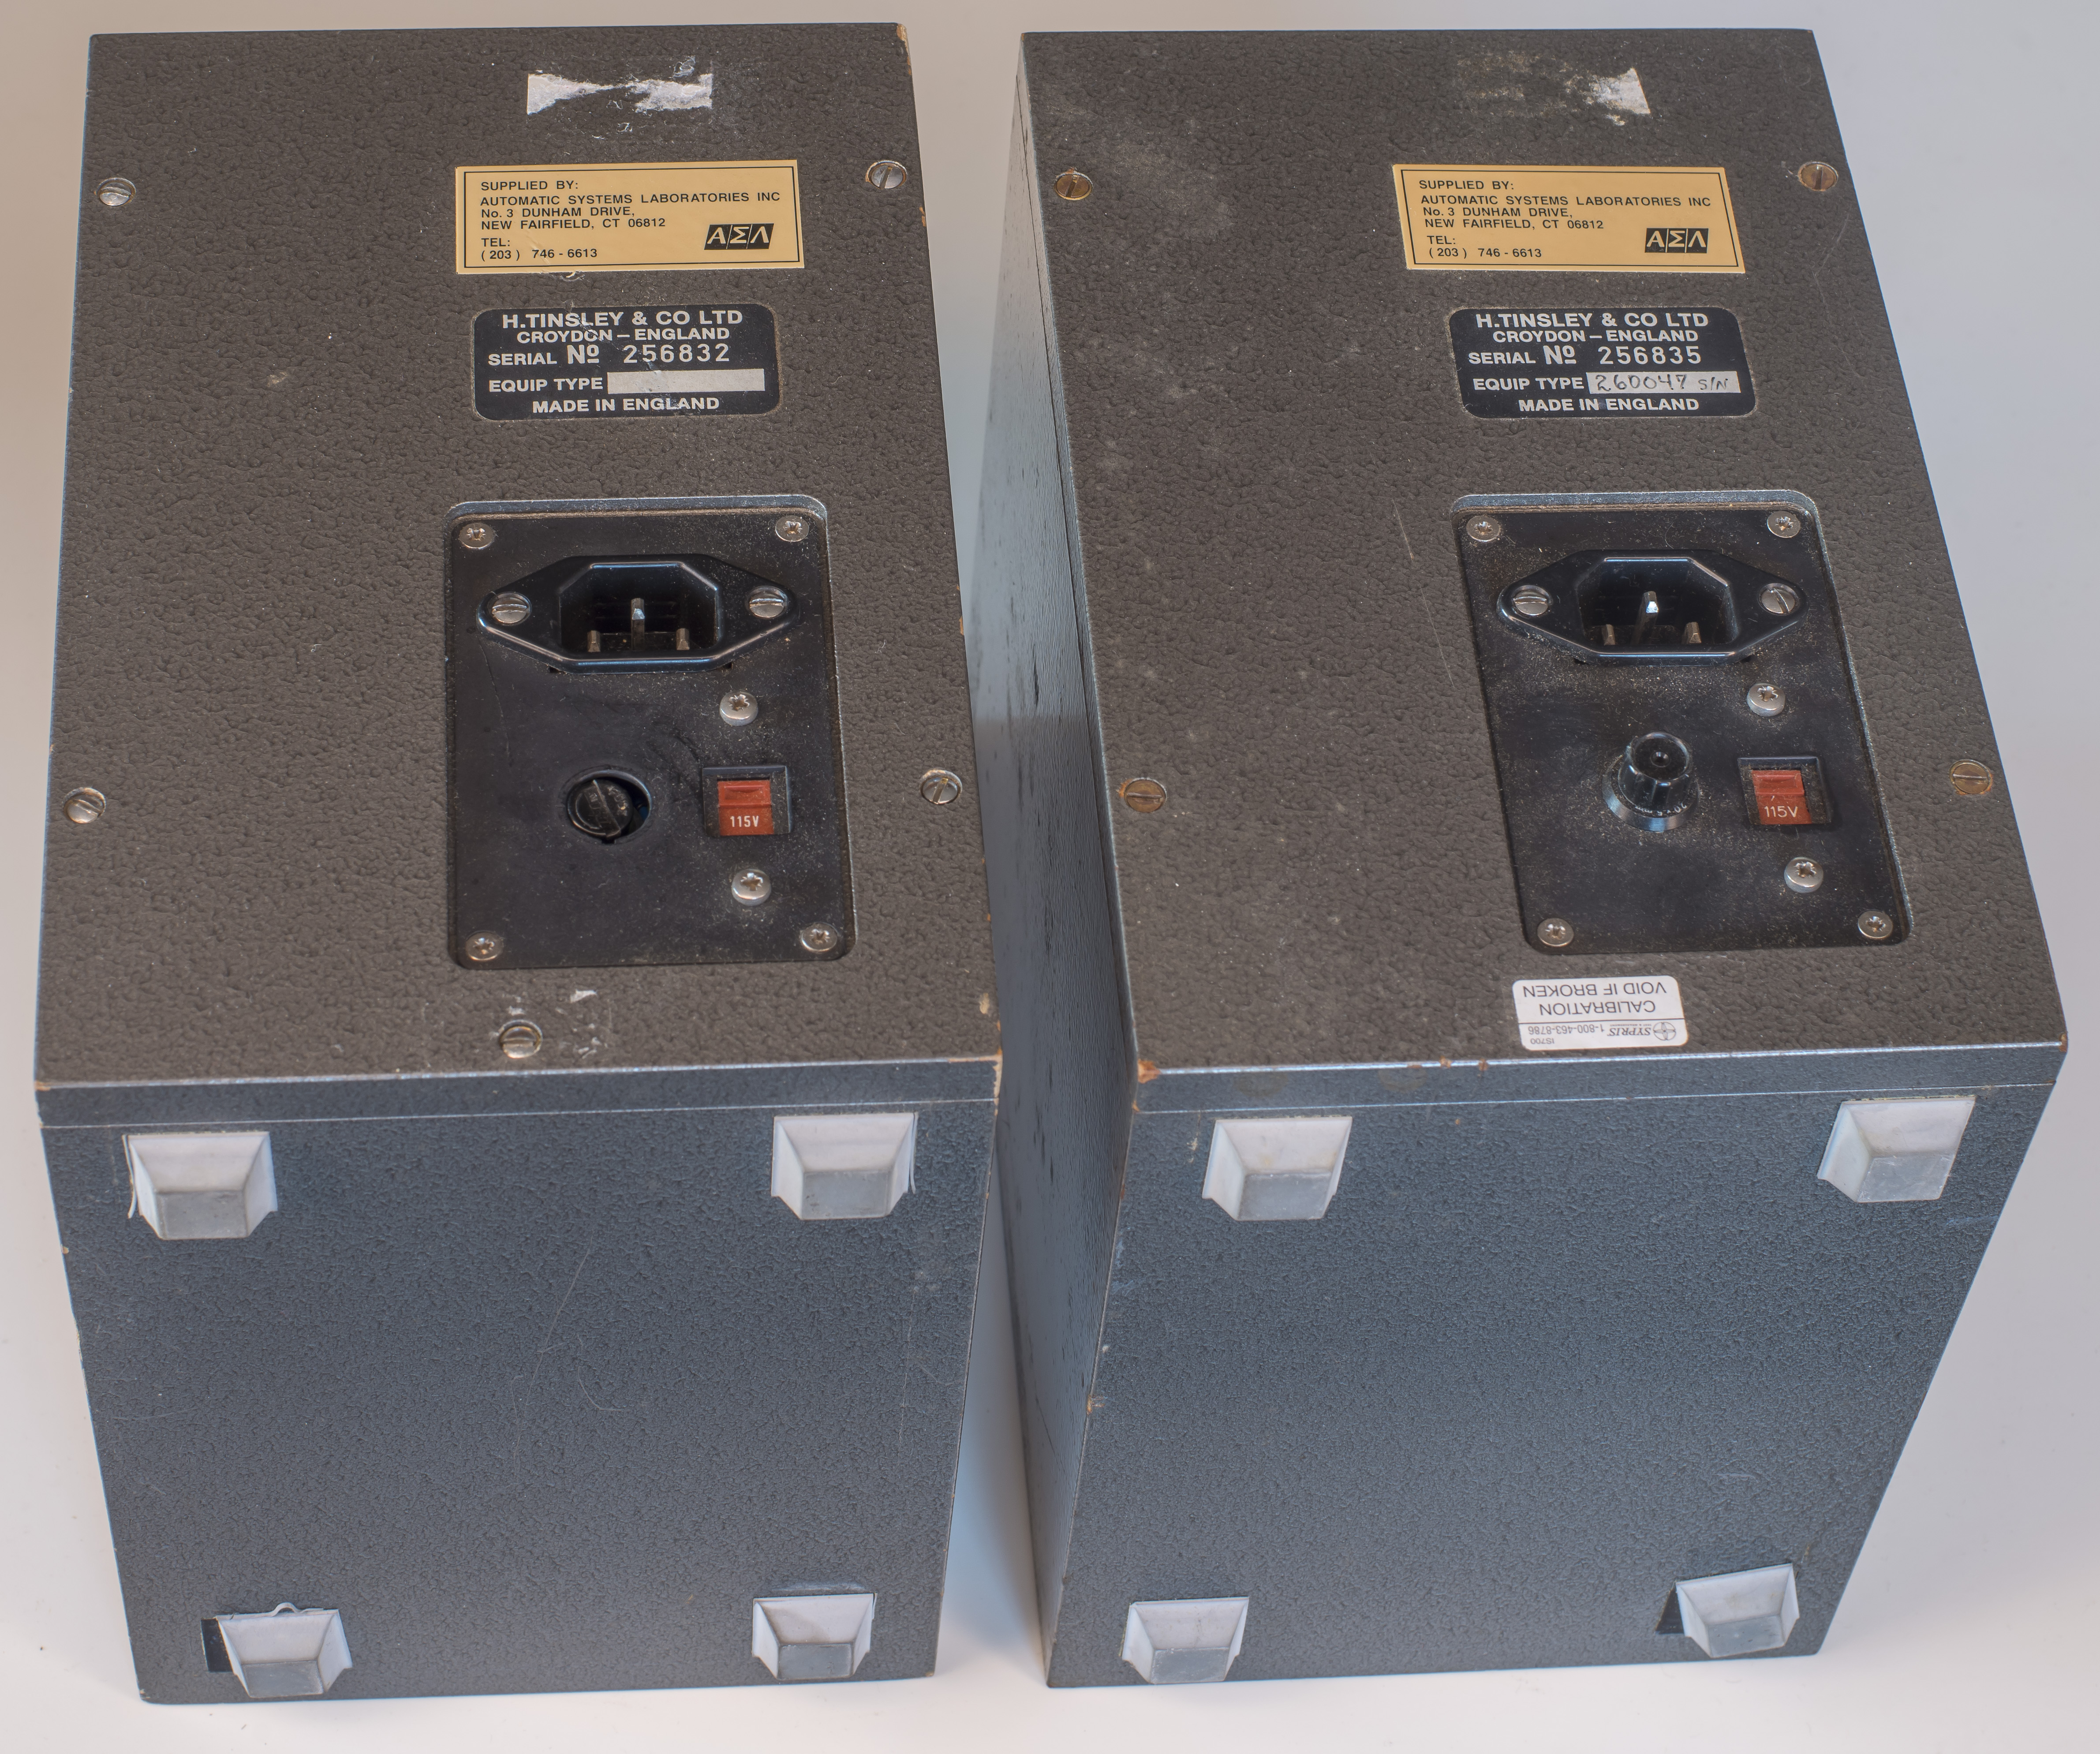
There are large rubber bumpers on the bottom side of the unit. A nice touch to protect the box and other surfaces from scratching up. There is no battery power backup in the 5648 enclosure, but with good insulation and the relatively large mass of the resistance standard itself, it might maintain temperature for some short duration, enough to move the standard between different rooms.
Interesting to note that these Tinsley units were supplied by ASL Inc. who is today part of WIKA. WIKA and Tinsley have a partnership to distribute and sell resistance standard products in different markets.
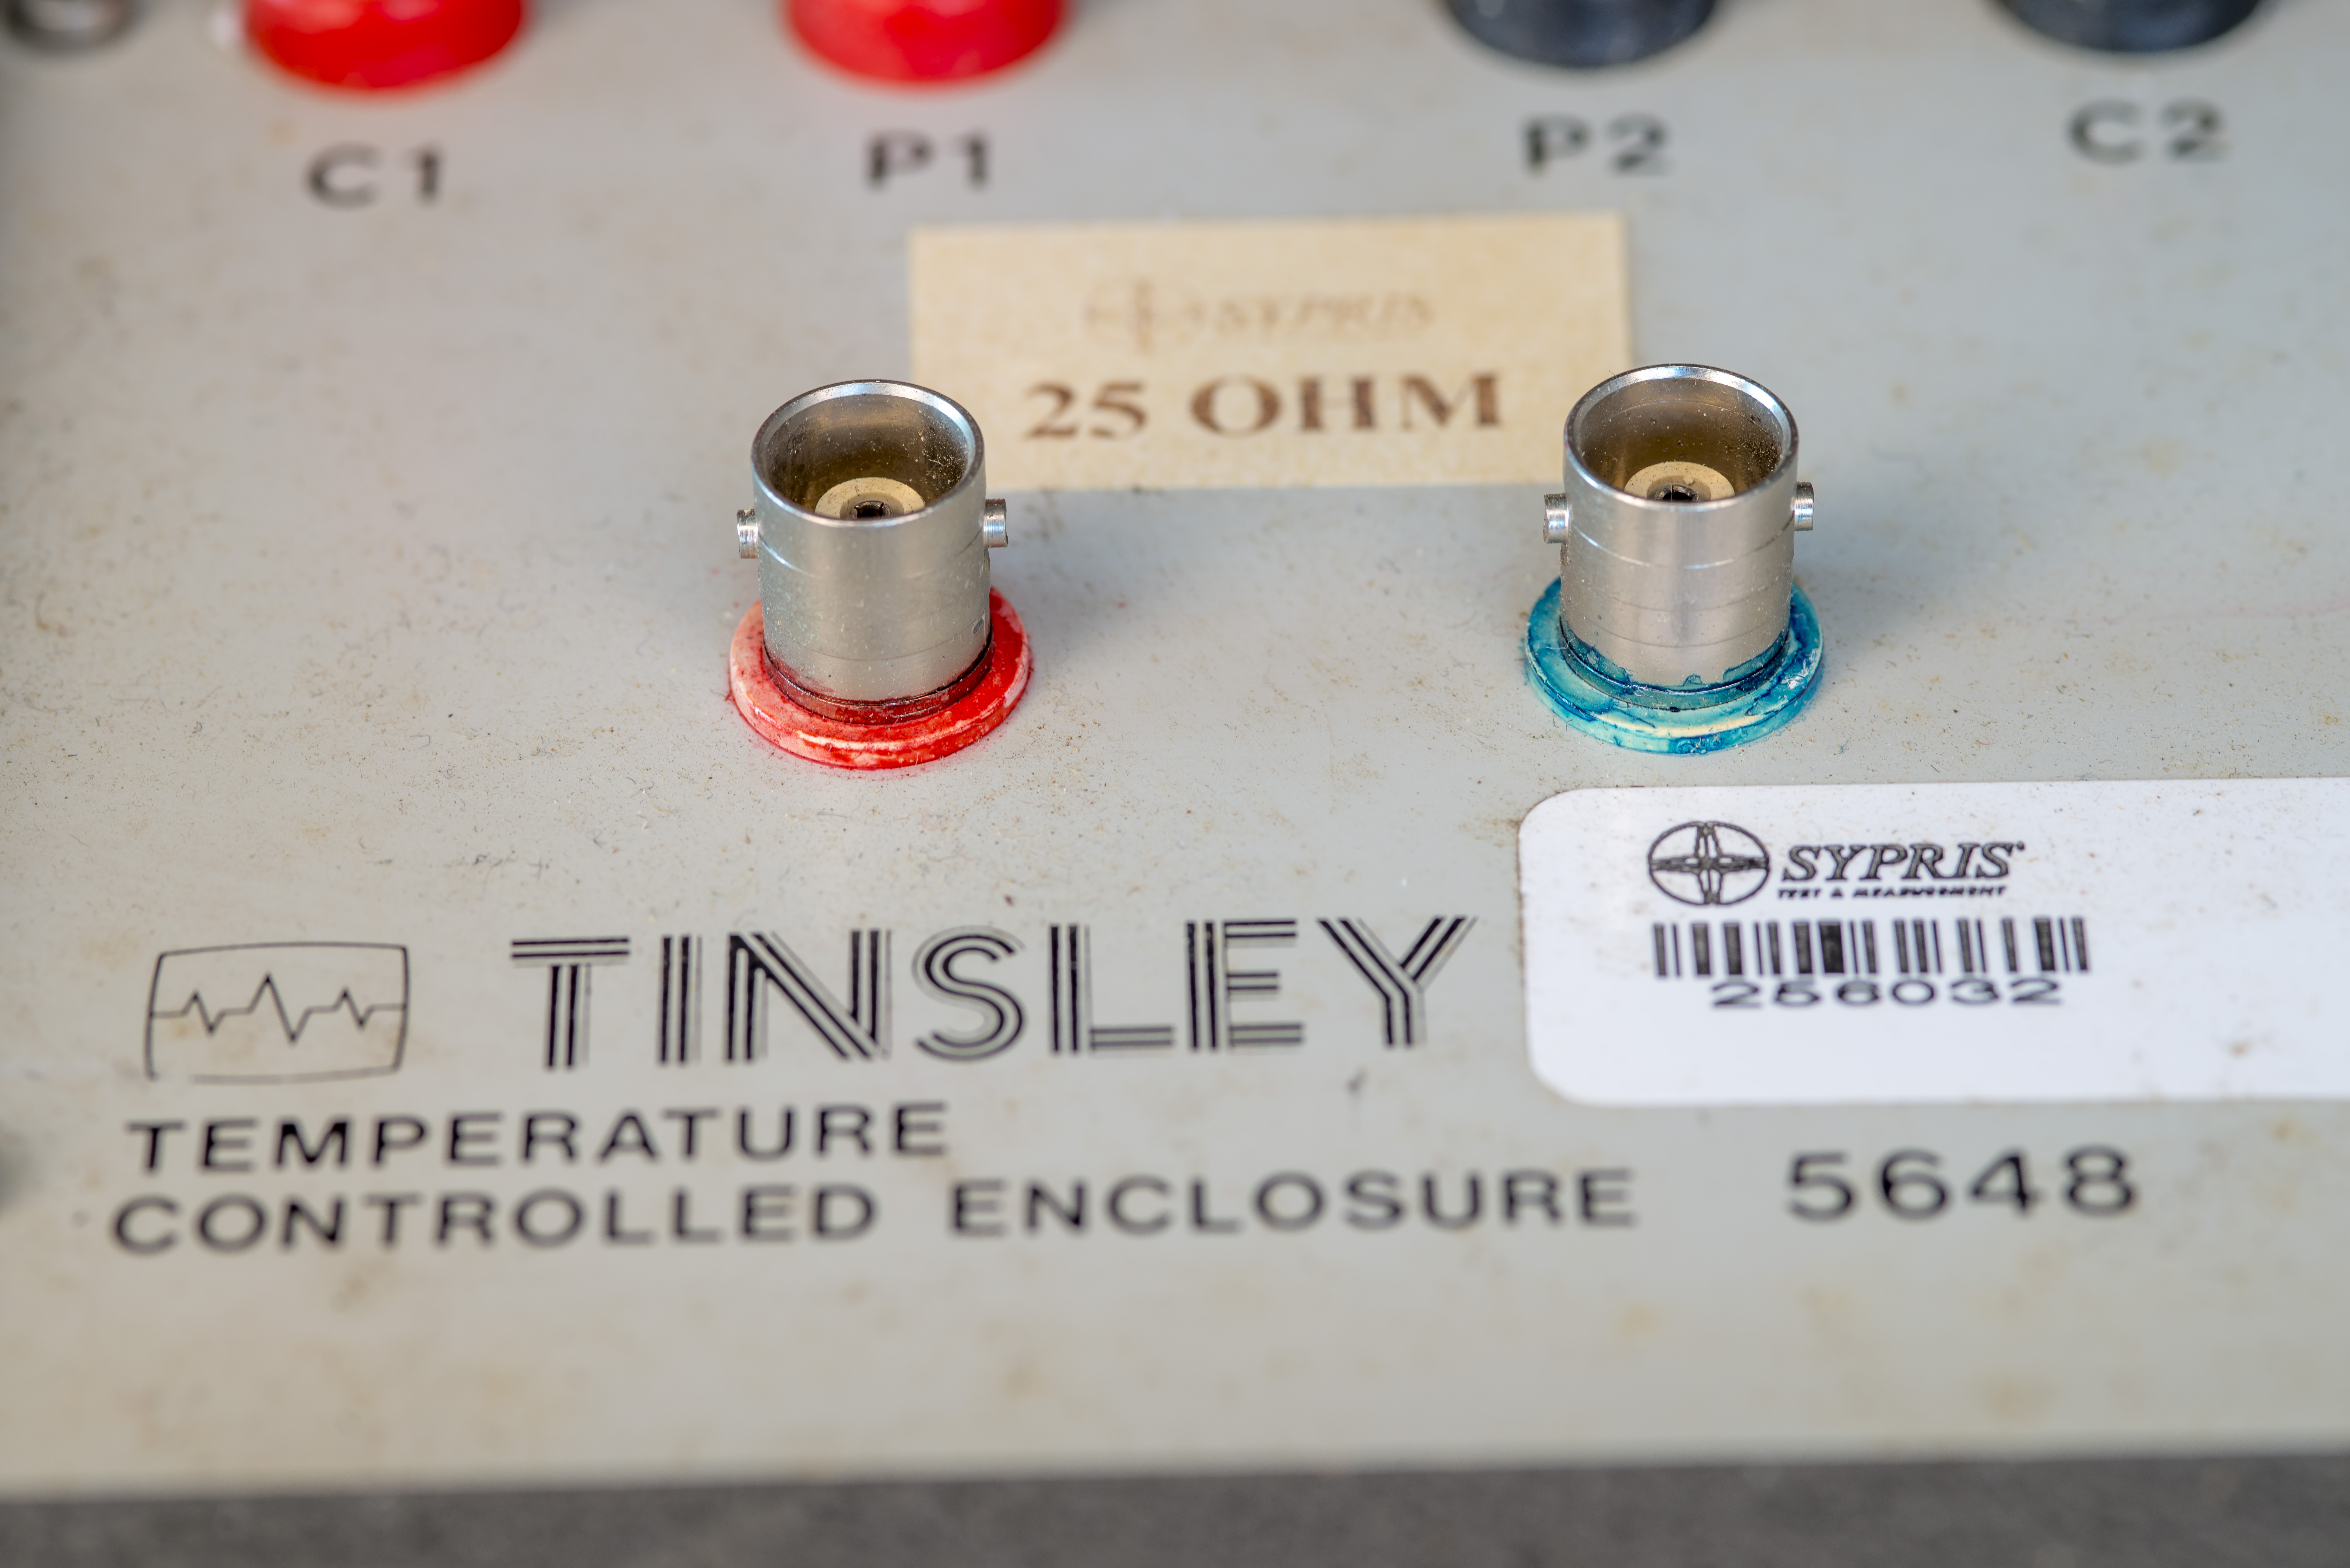
Because core 5685A resistor is designed to operate with AC/DC good performance, the oven enclosure panel also has additional BNC connectors to provide coaxial interface for easier interfacing with AC thermometry bridge systems. This simplifies user operation and connections by avoiding adapters between banana posts and coaxial cables. BNC insulators are painted in red and turquoise colors with a sharpie :).
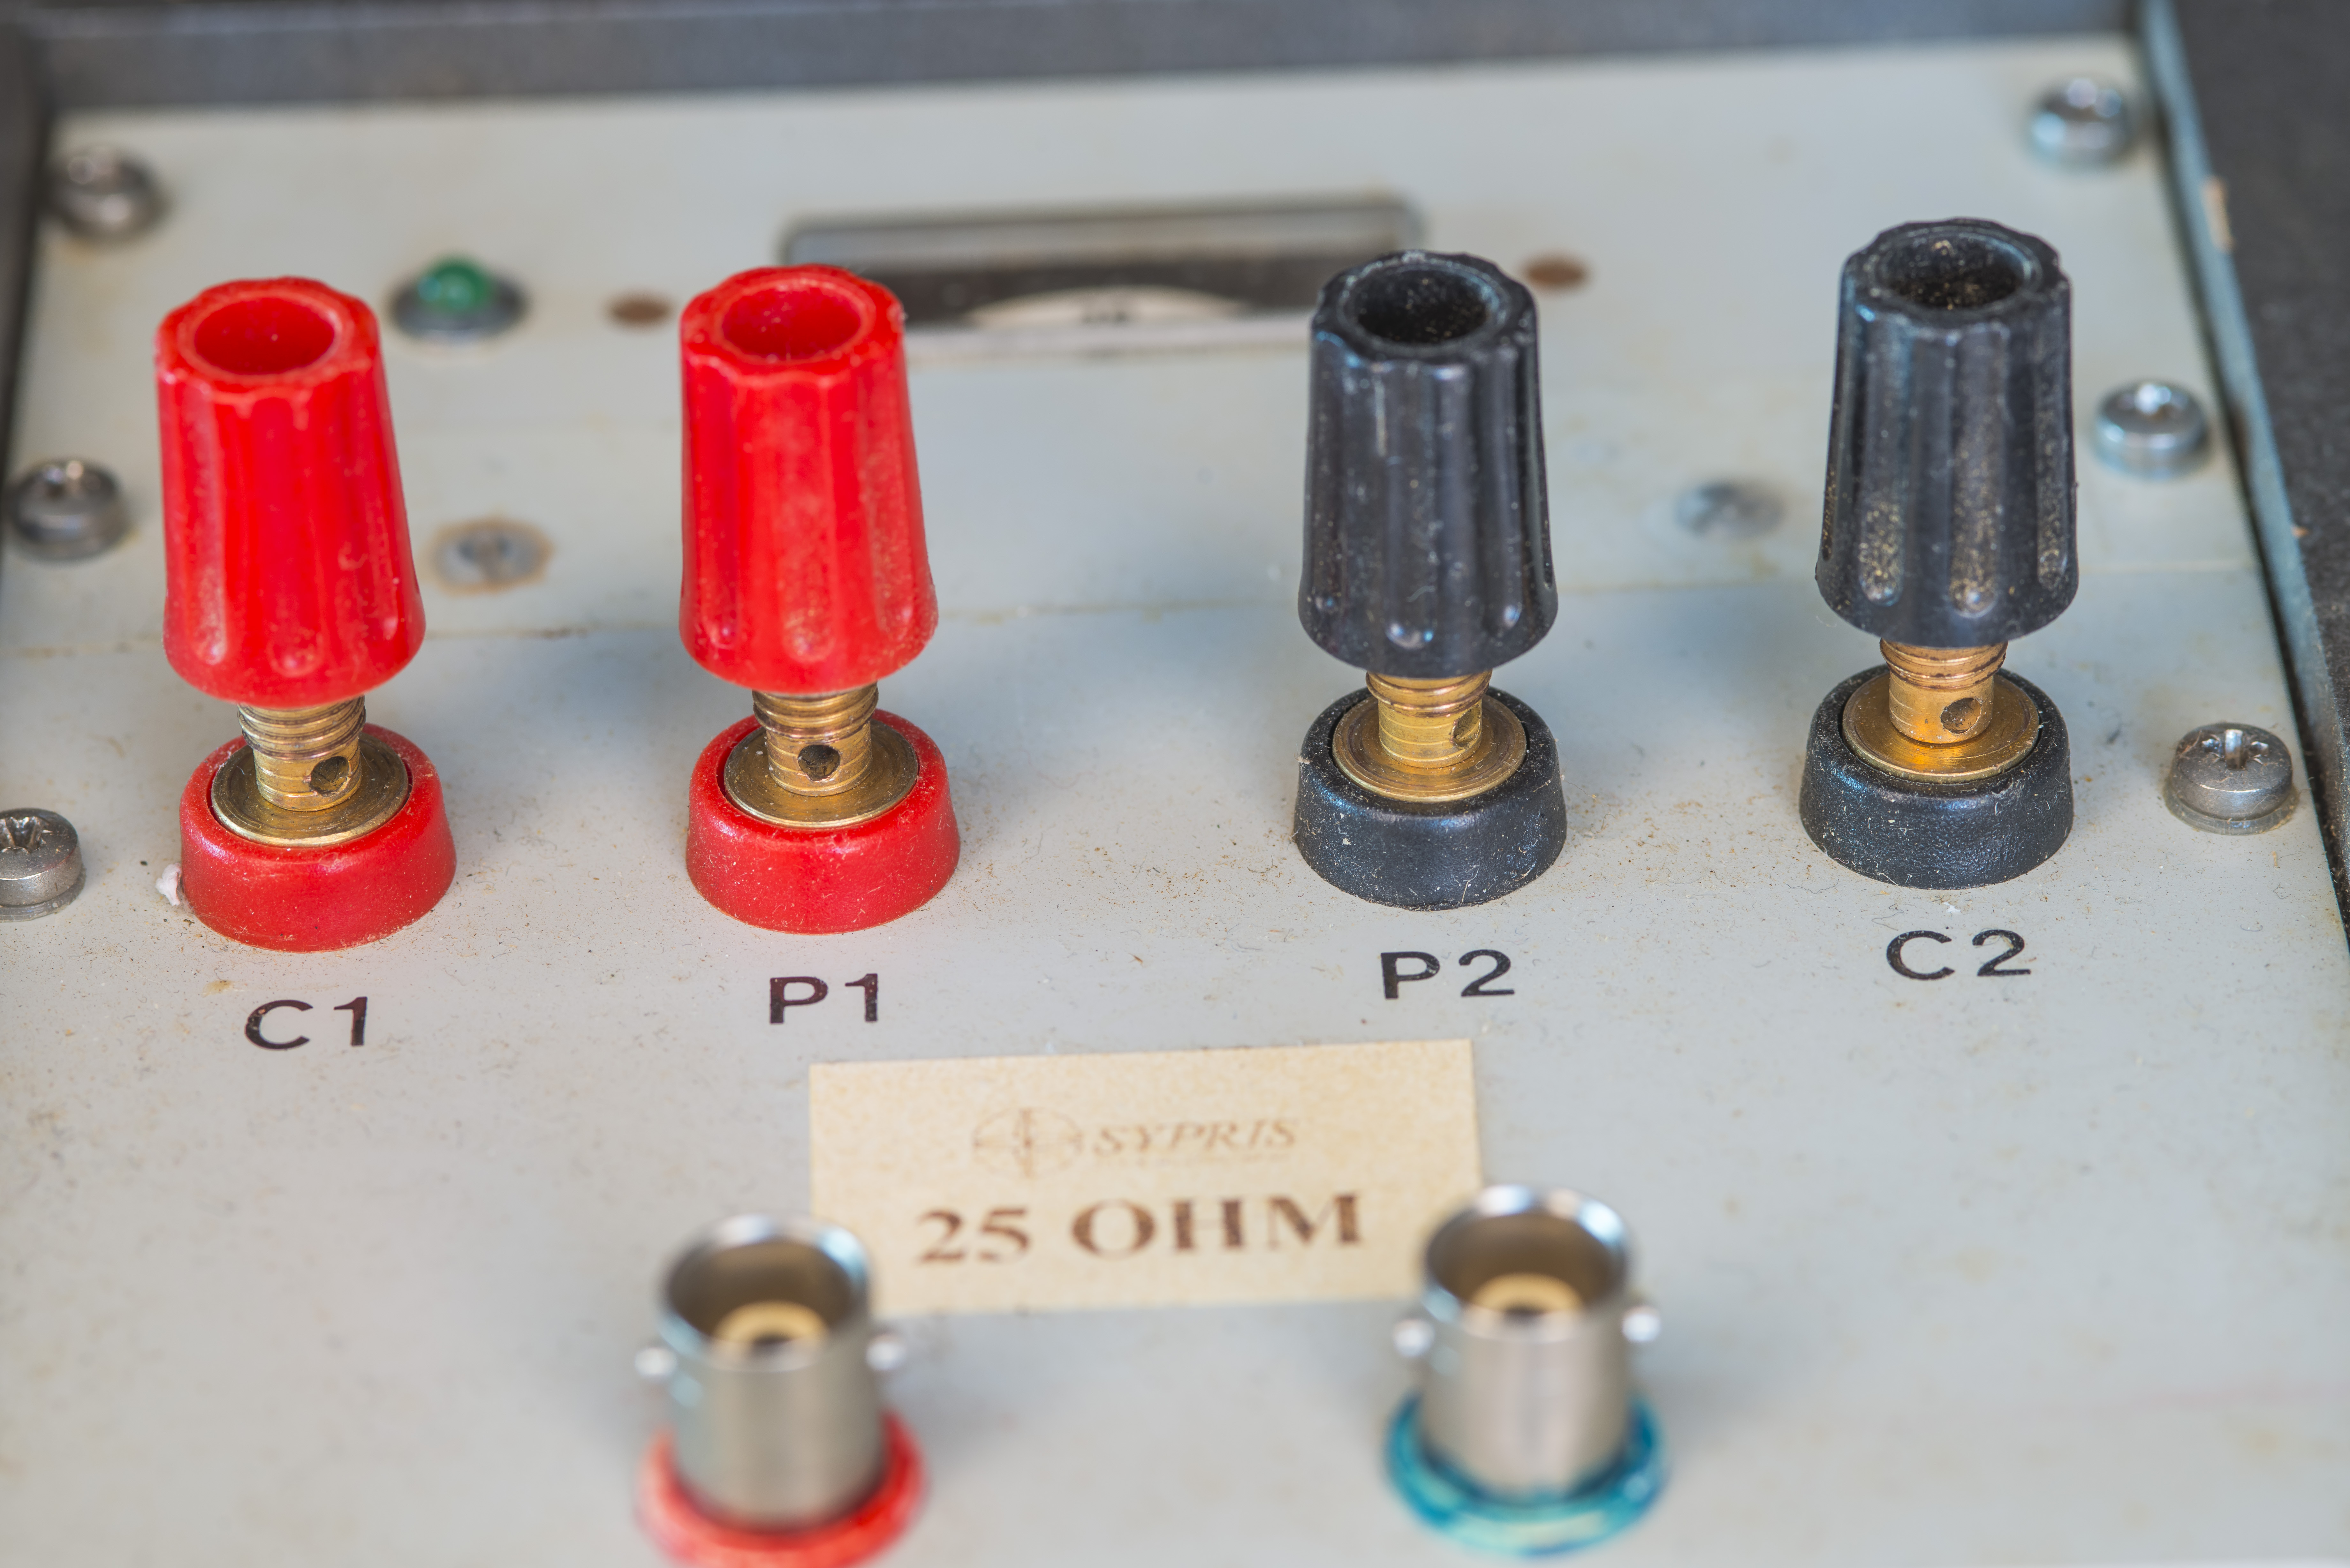
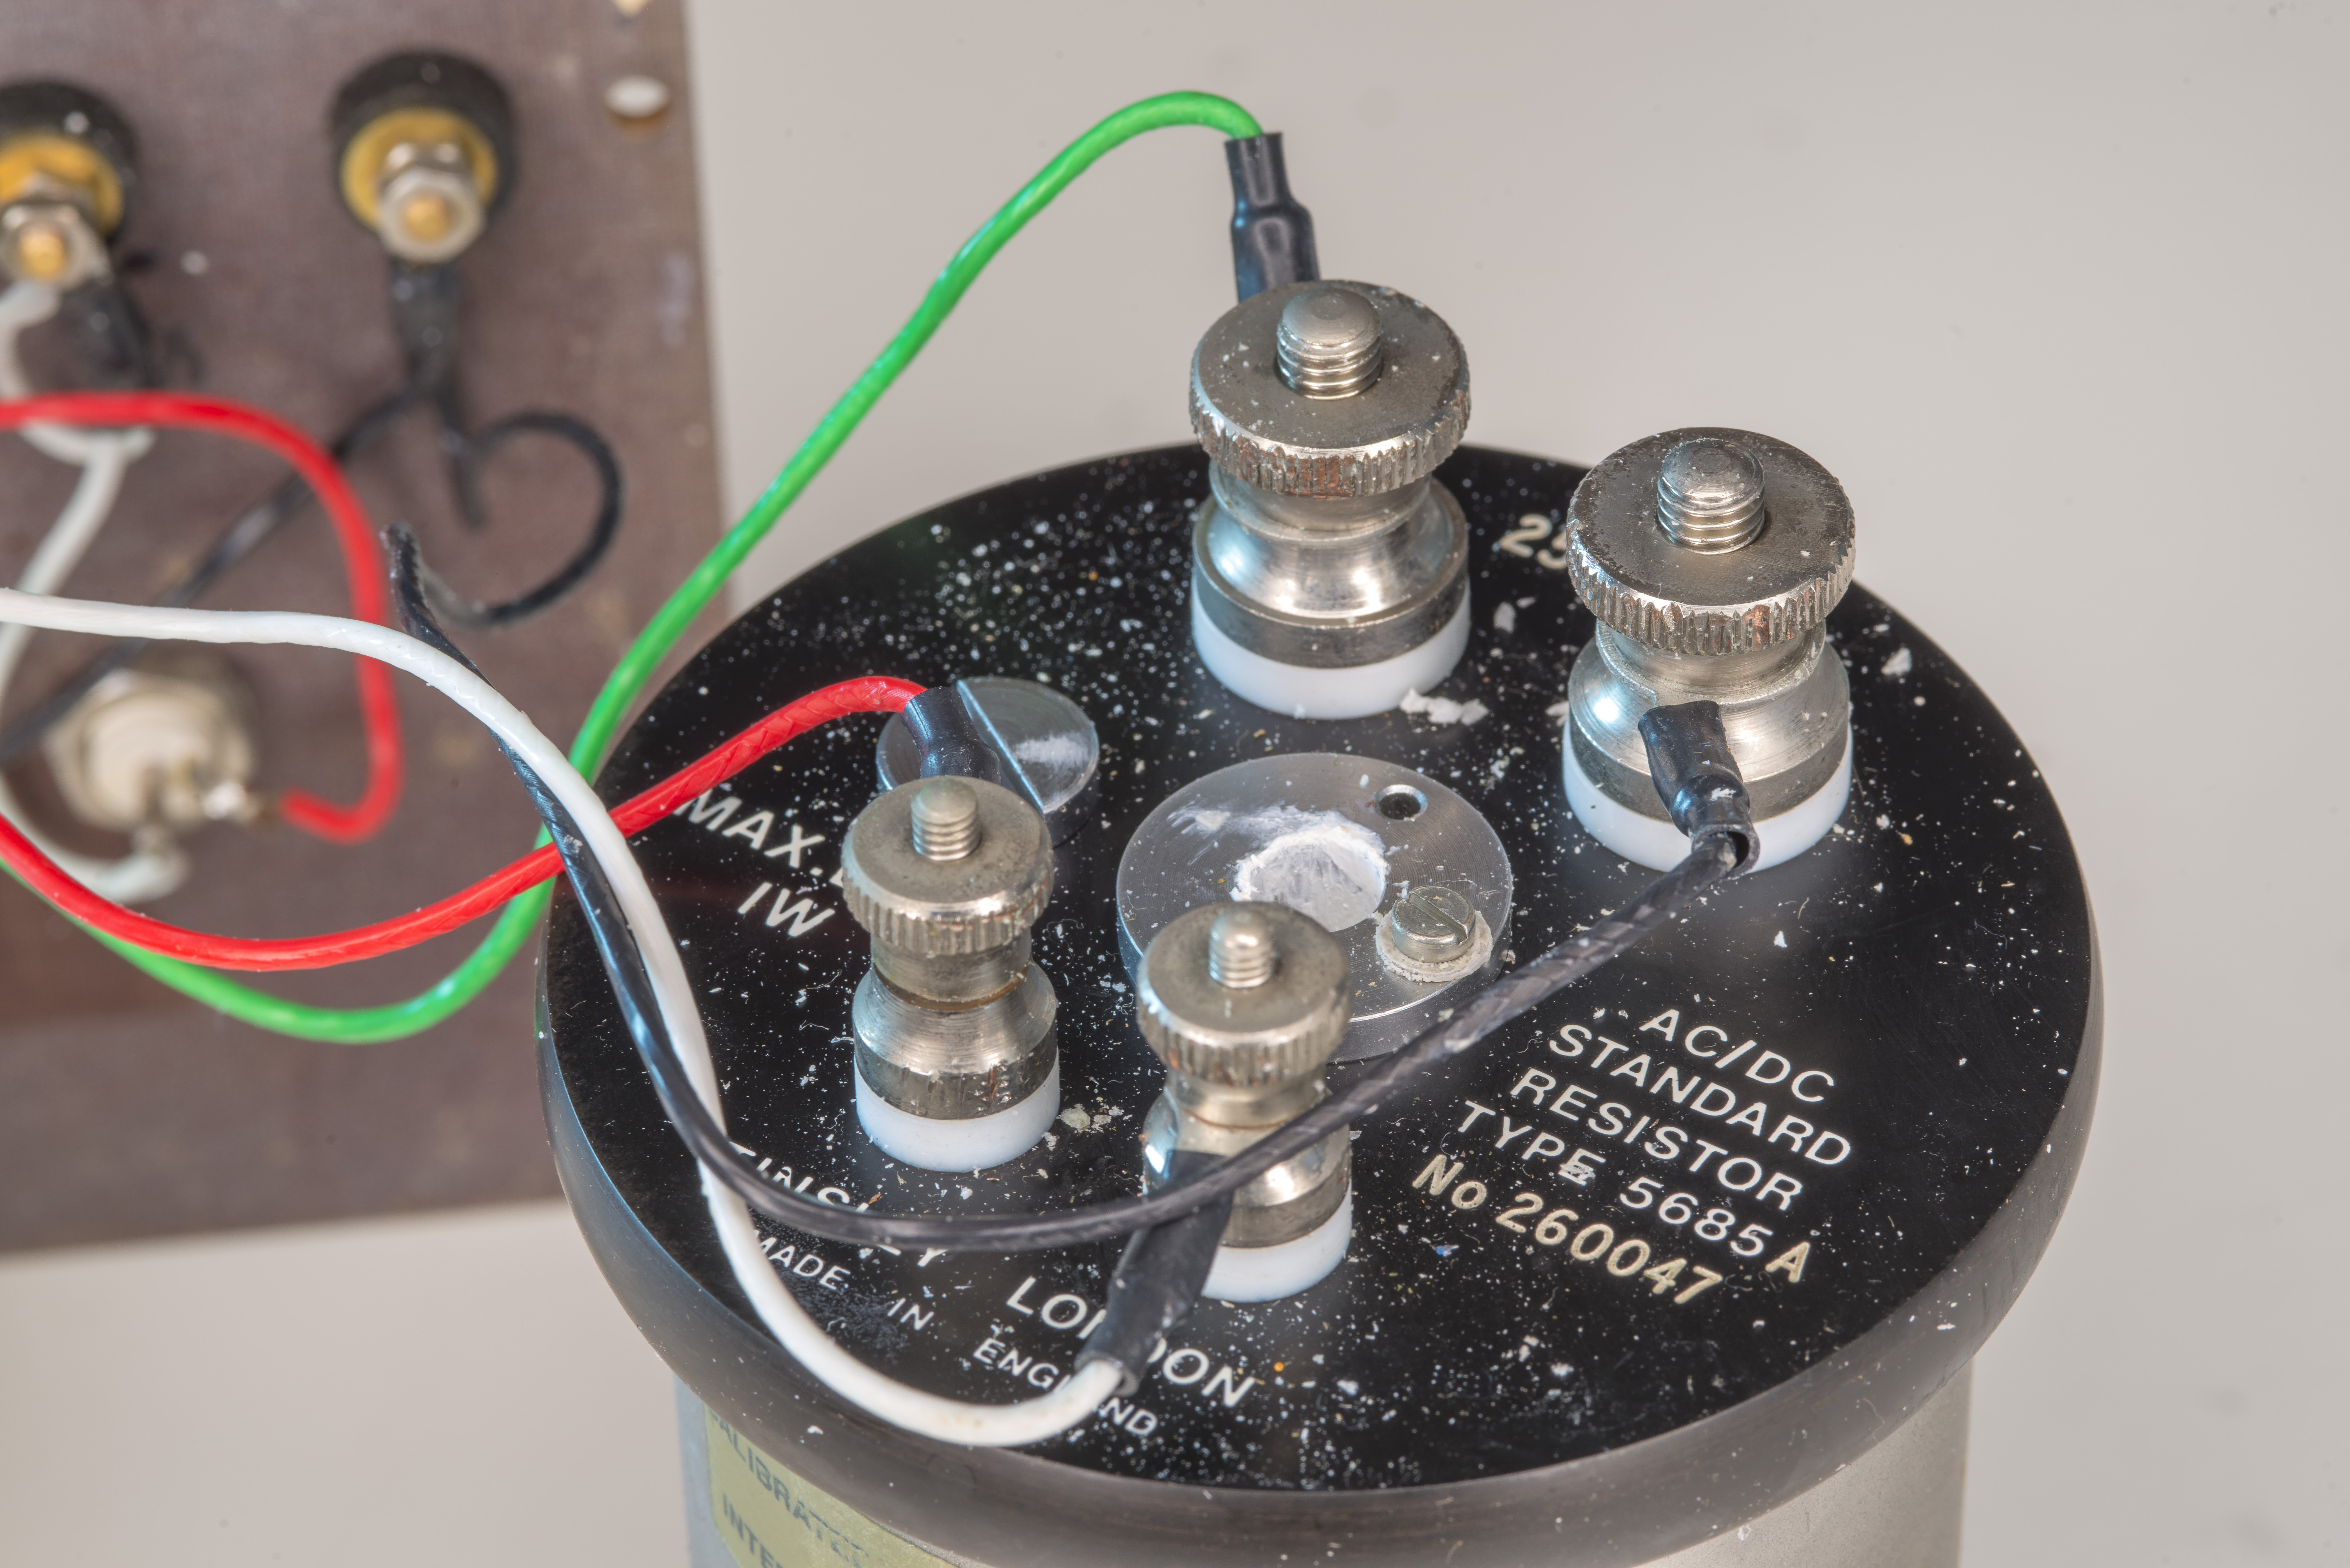
Posts are rather crusty dirty and definitely require some decent amount of cleaning. Knobs are not removable from the turret but allow quite a bit of spade lug spacing, enabling connections with multiple cables. The panel that has the posts and BNC cables is made out of fiberglass dielectric similar to Bakelite material and not conductive.
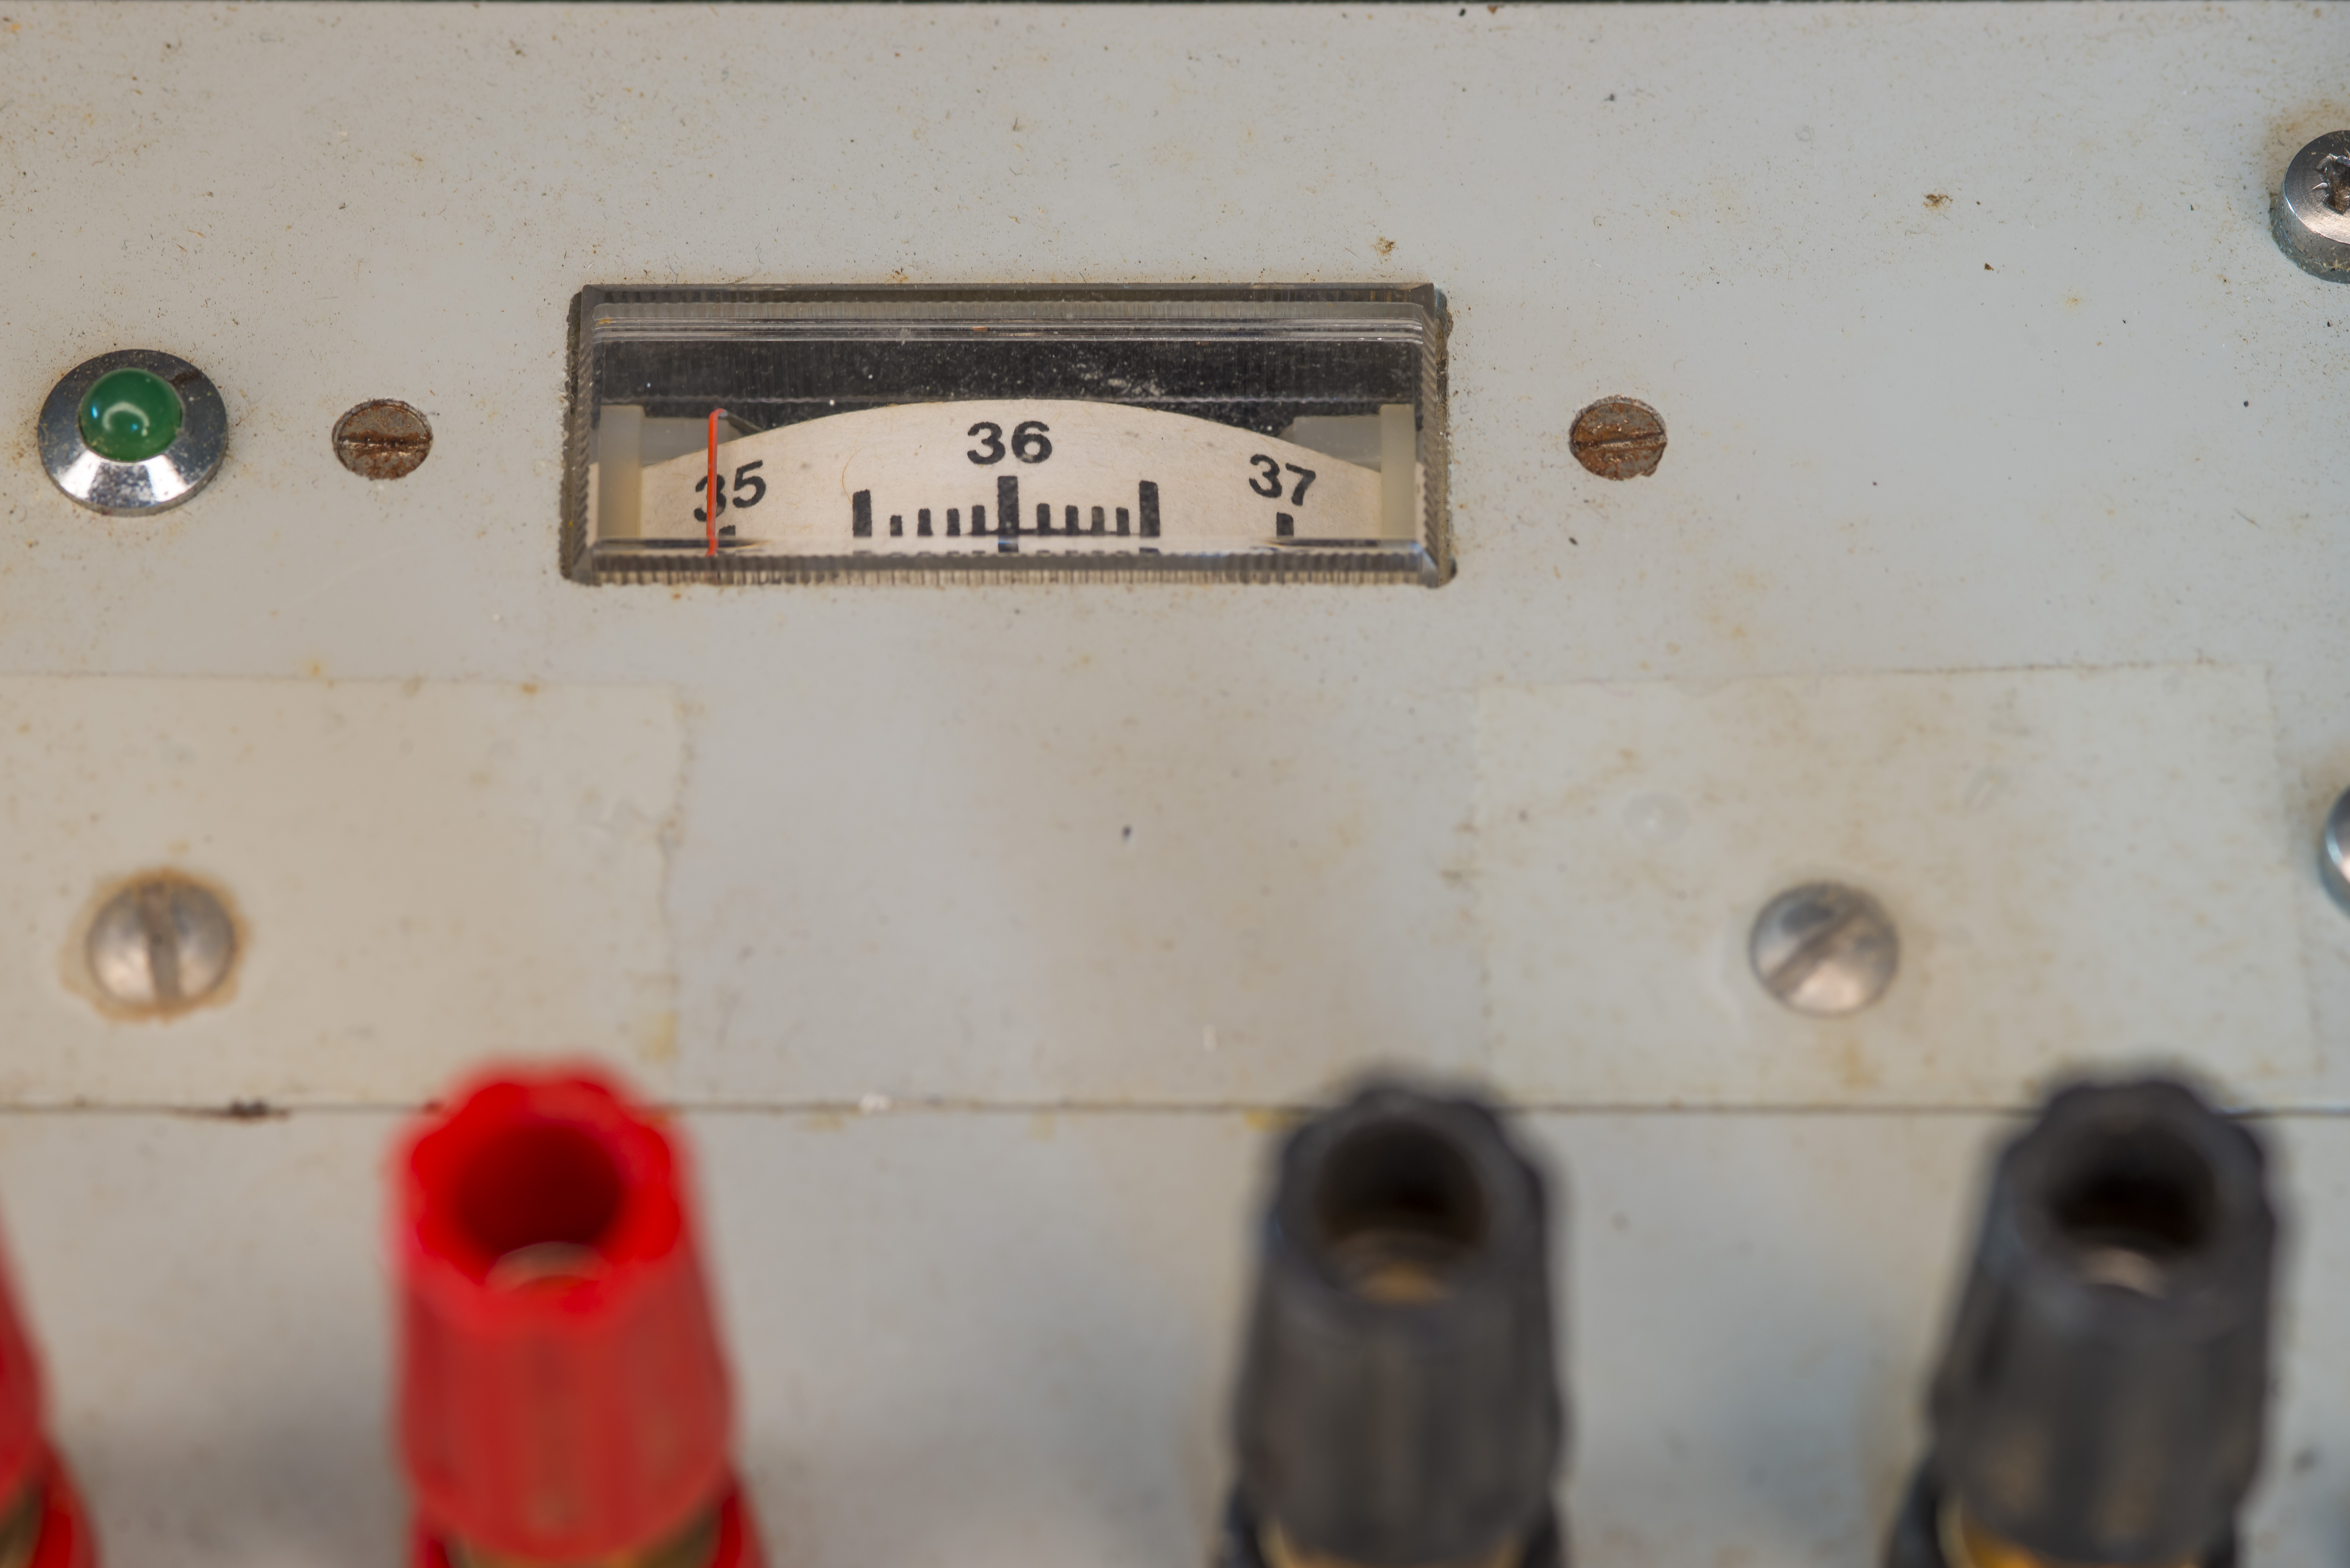
The top panel meter is a simple mechanical gauge with narrow ±1 °C range of temperature around the factory defined and set +36.0 °C. Tinsley stated in the manual for 5685A standards that 5648 enclosure set point can be customized to a different value. There are no externally provided user adjustment controls for oven temperature.
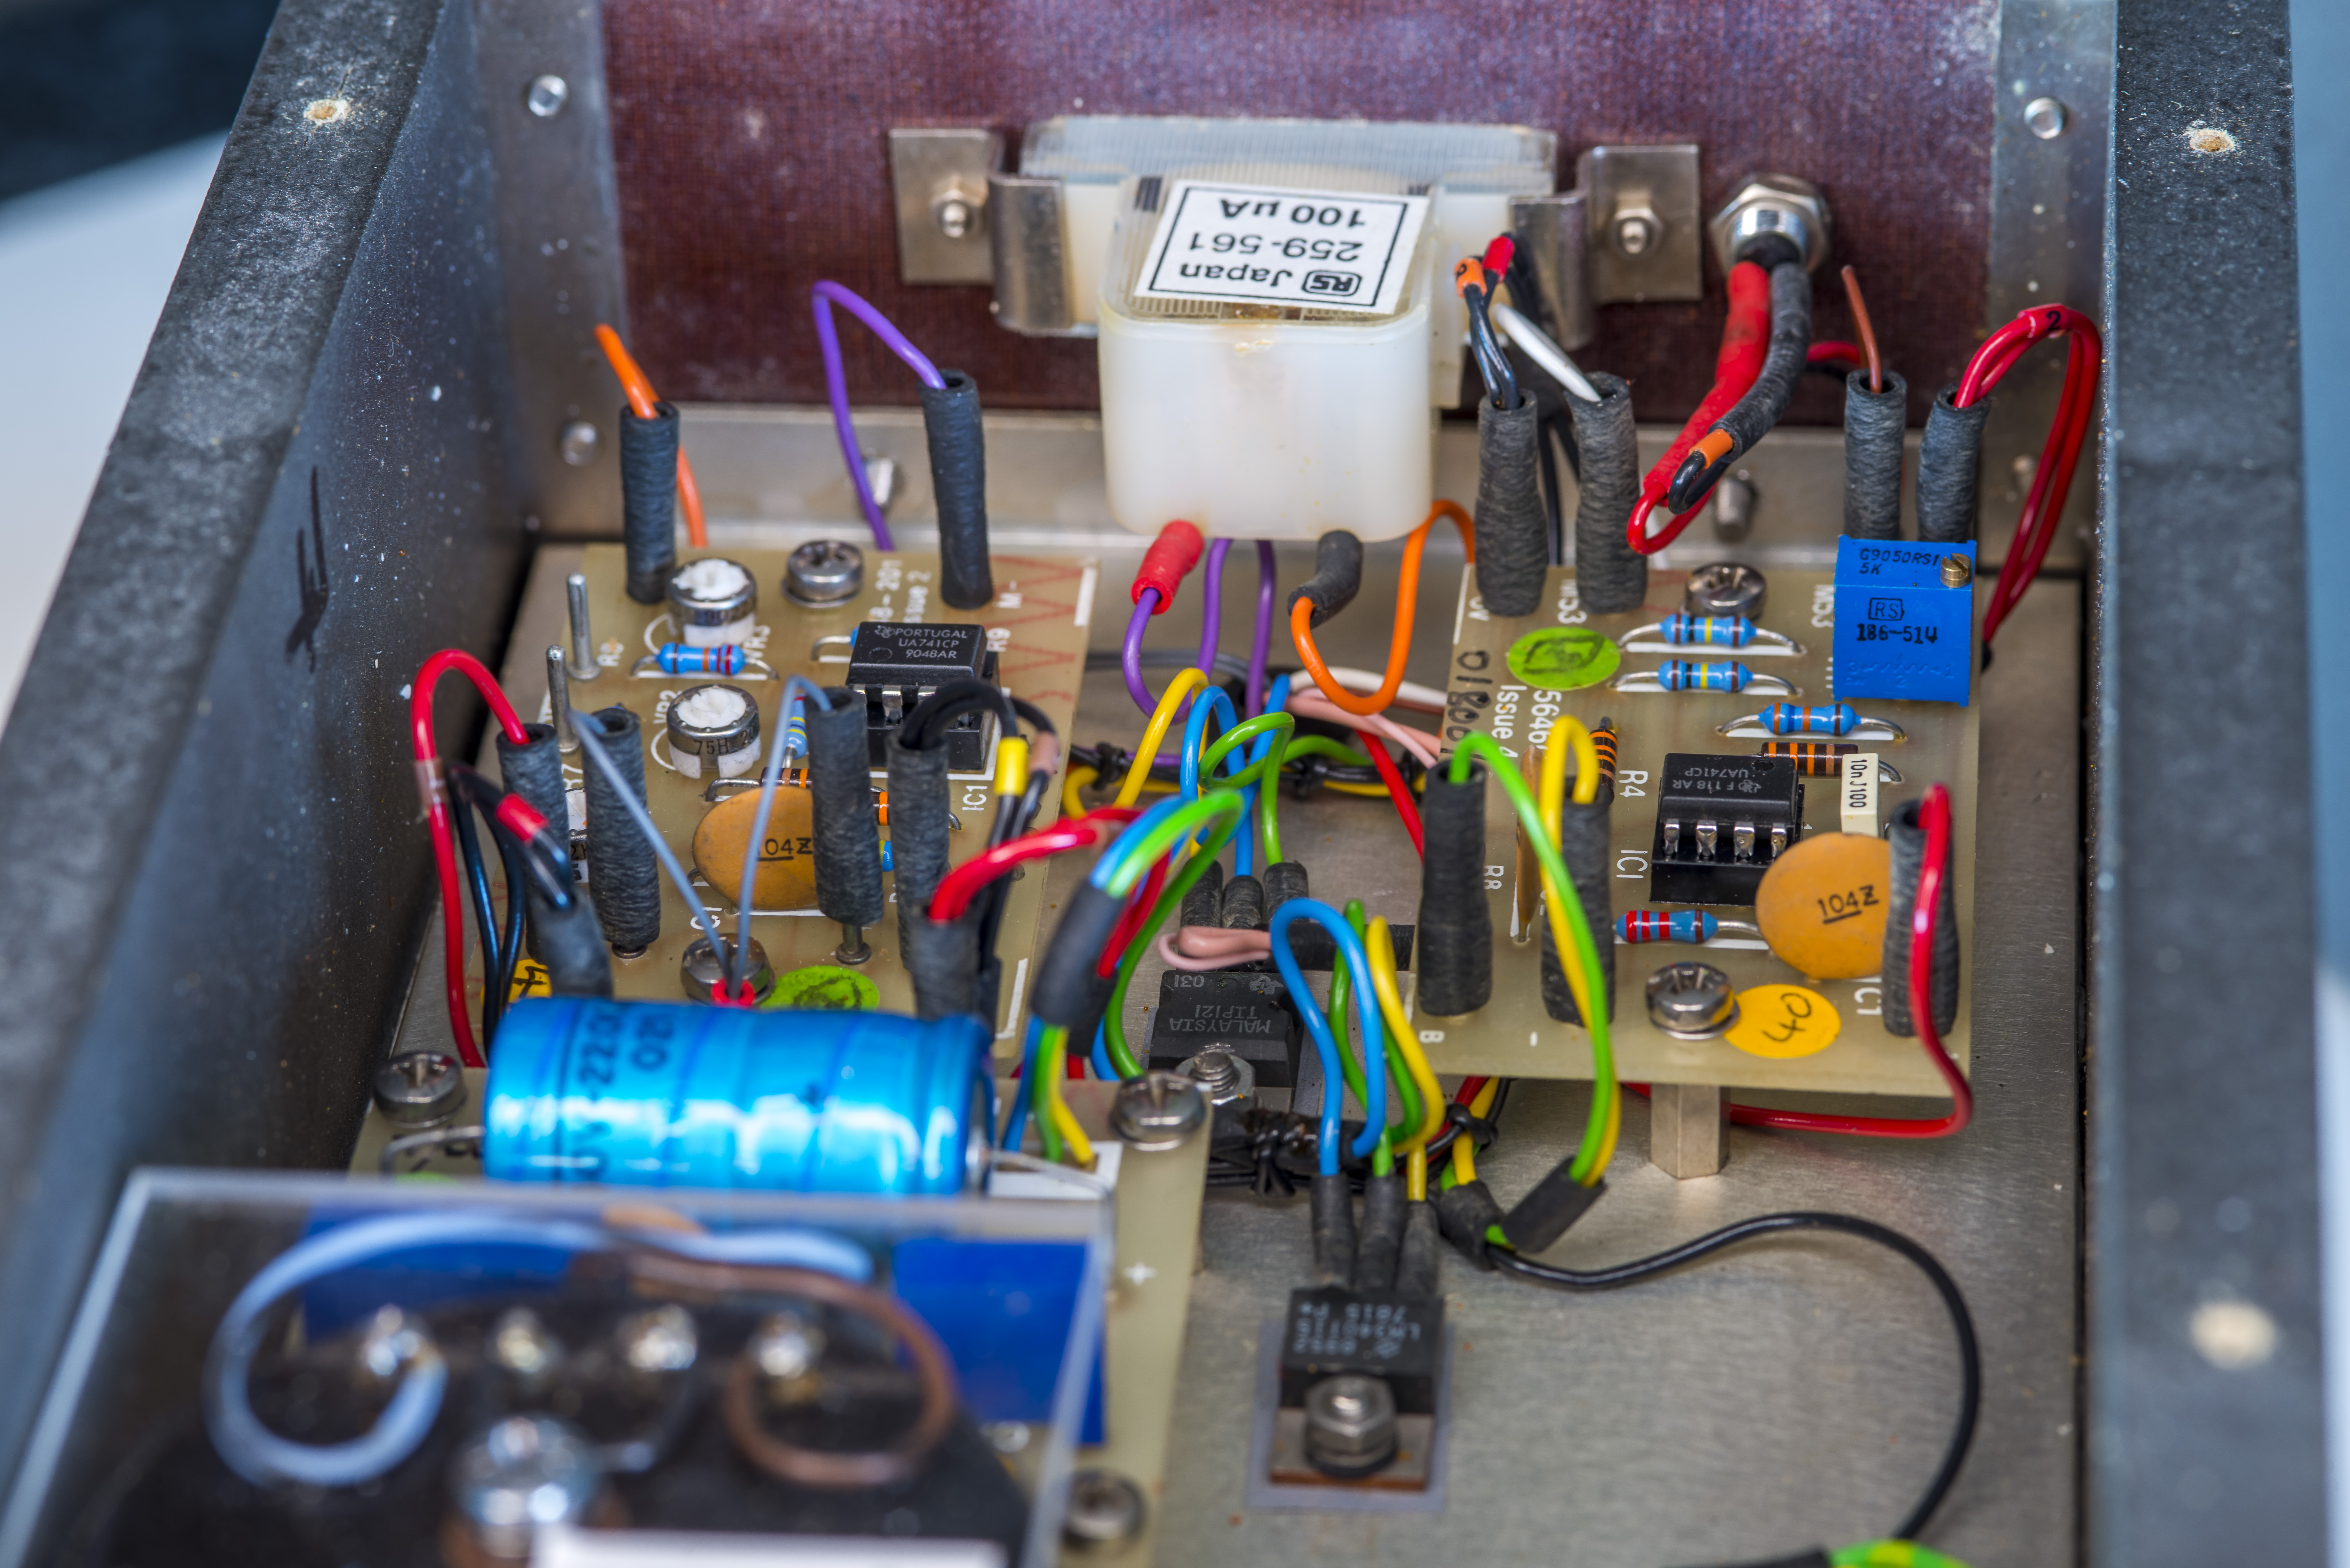
Removing five self-tapping screws from the side wall with IEC mains entry connector and protection fuse holder let us in to the electronic circuitry section of the oven box. All hardware is mounted on an internal aluminum plate and wired neatly together. Based on the chip date code this unit was made around week 48 year 1990.
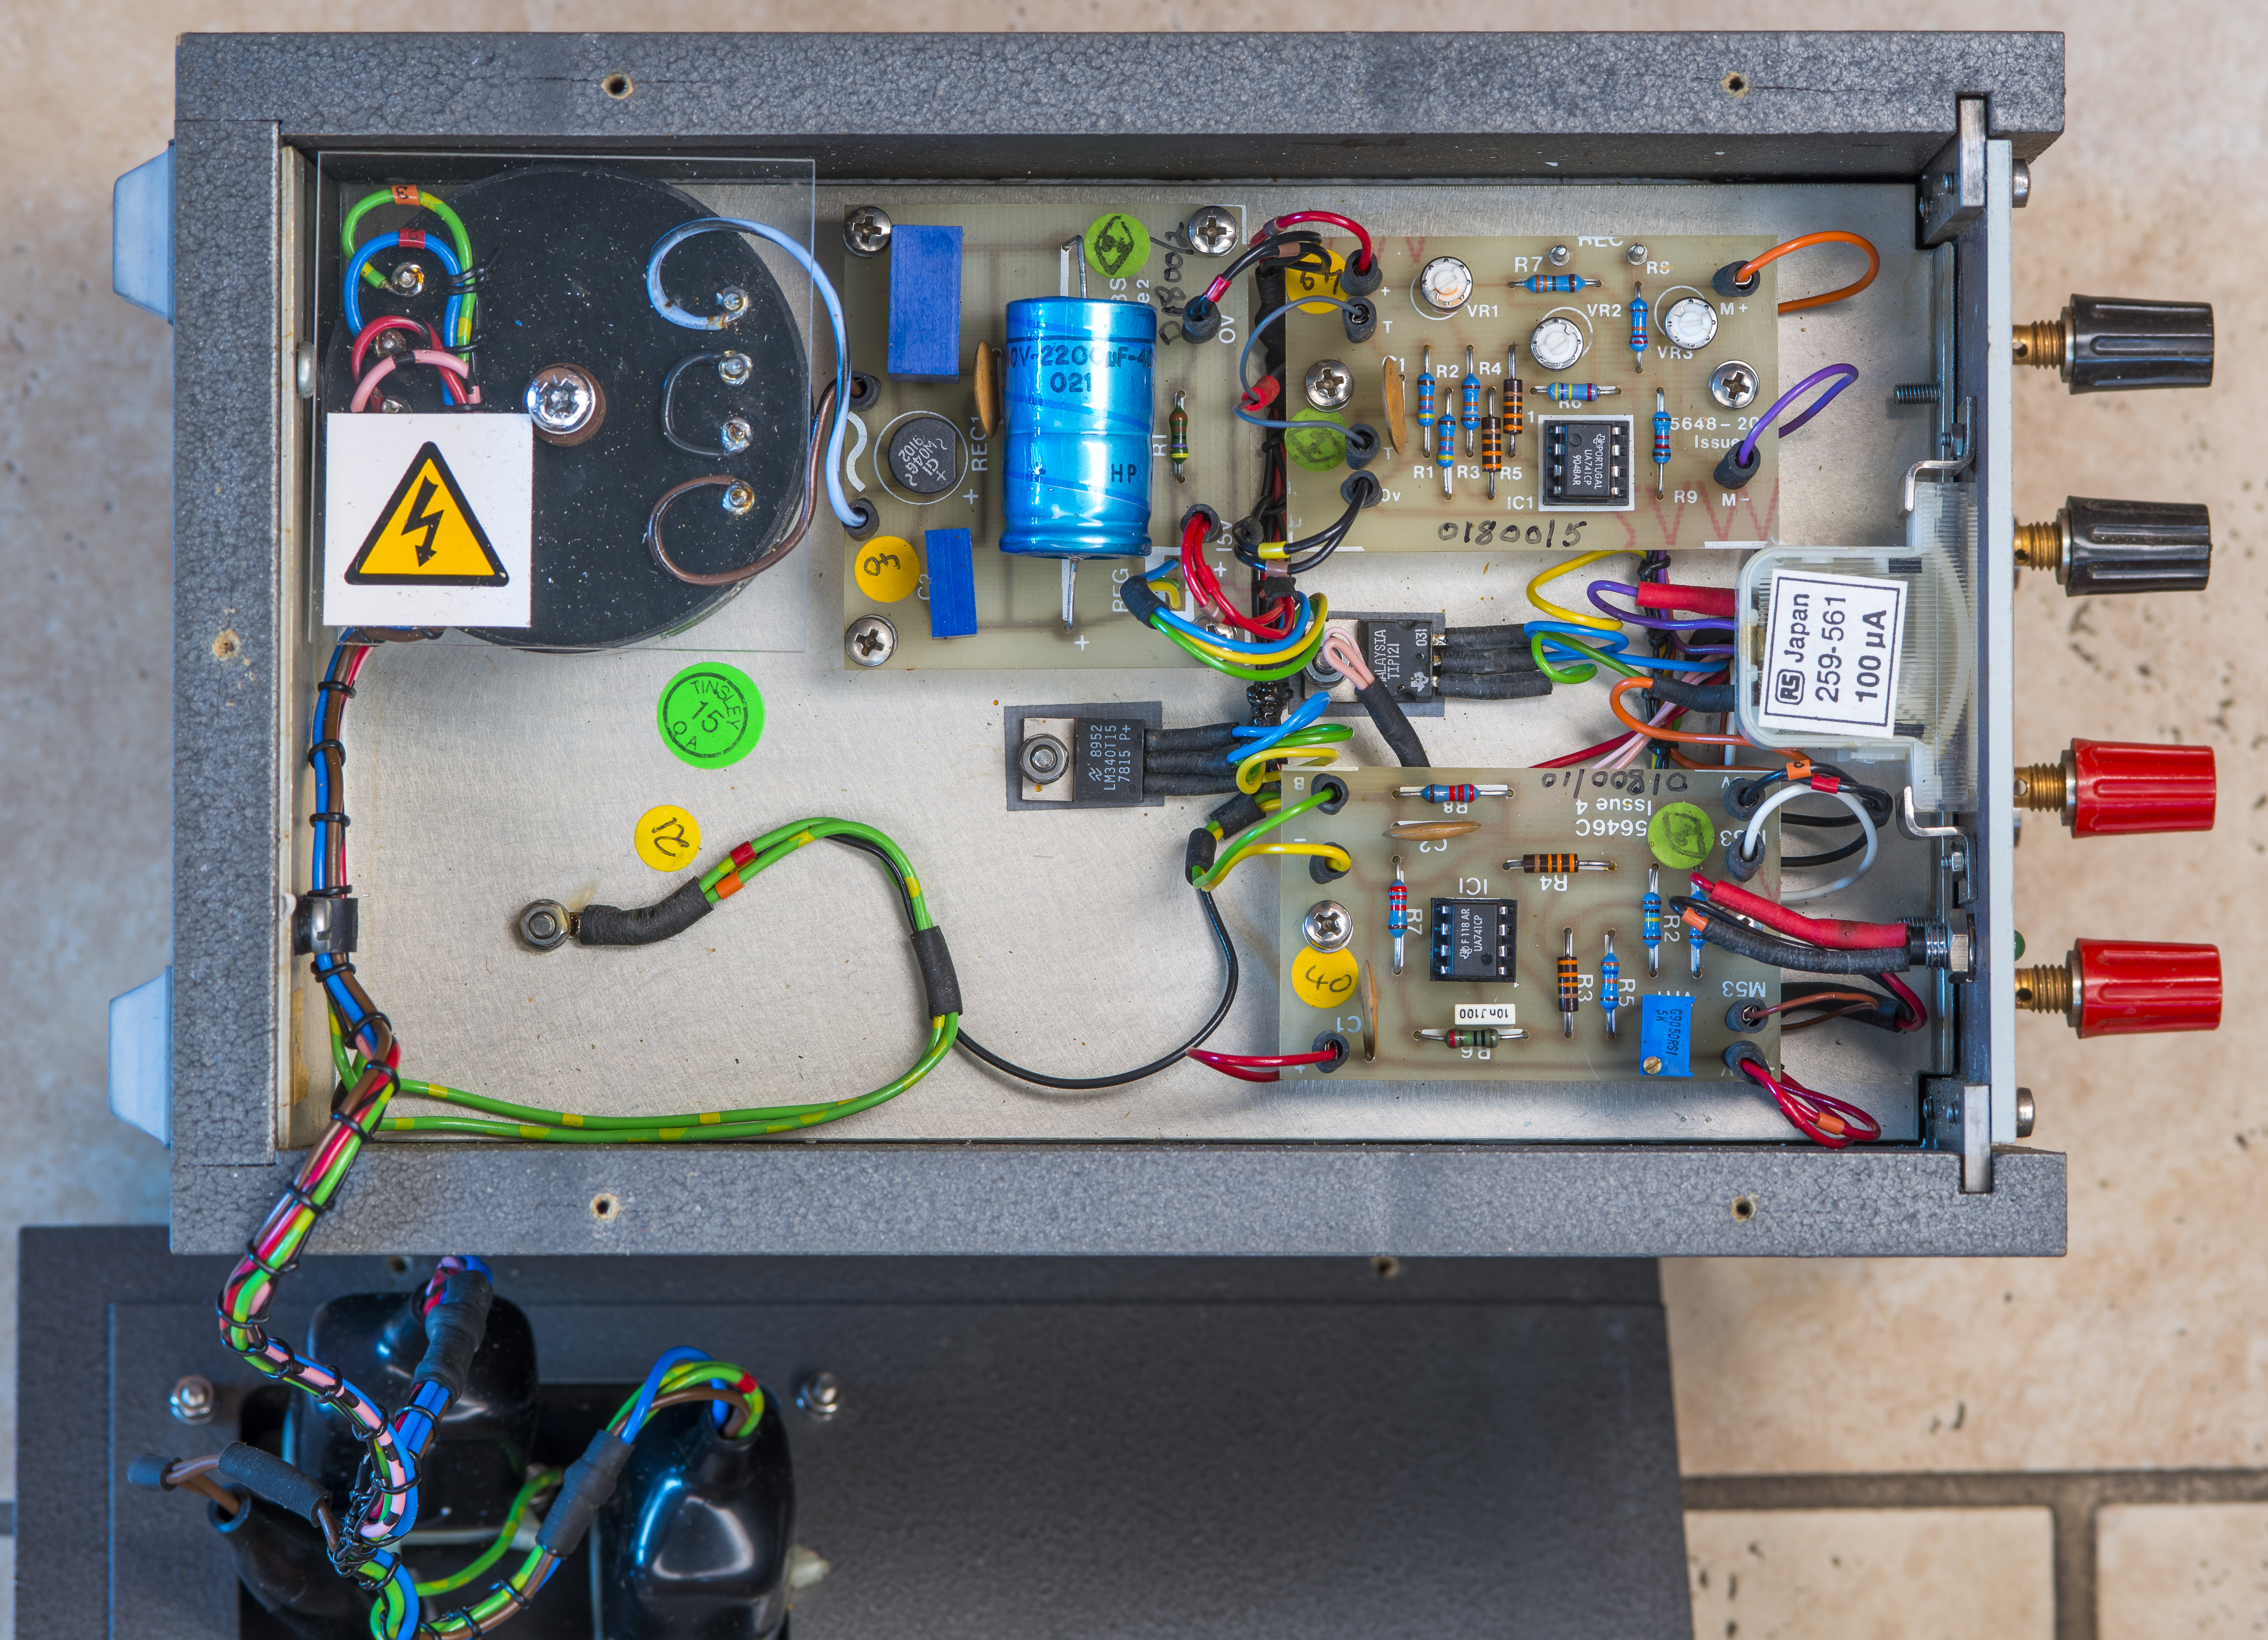
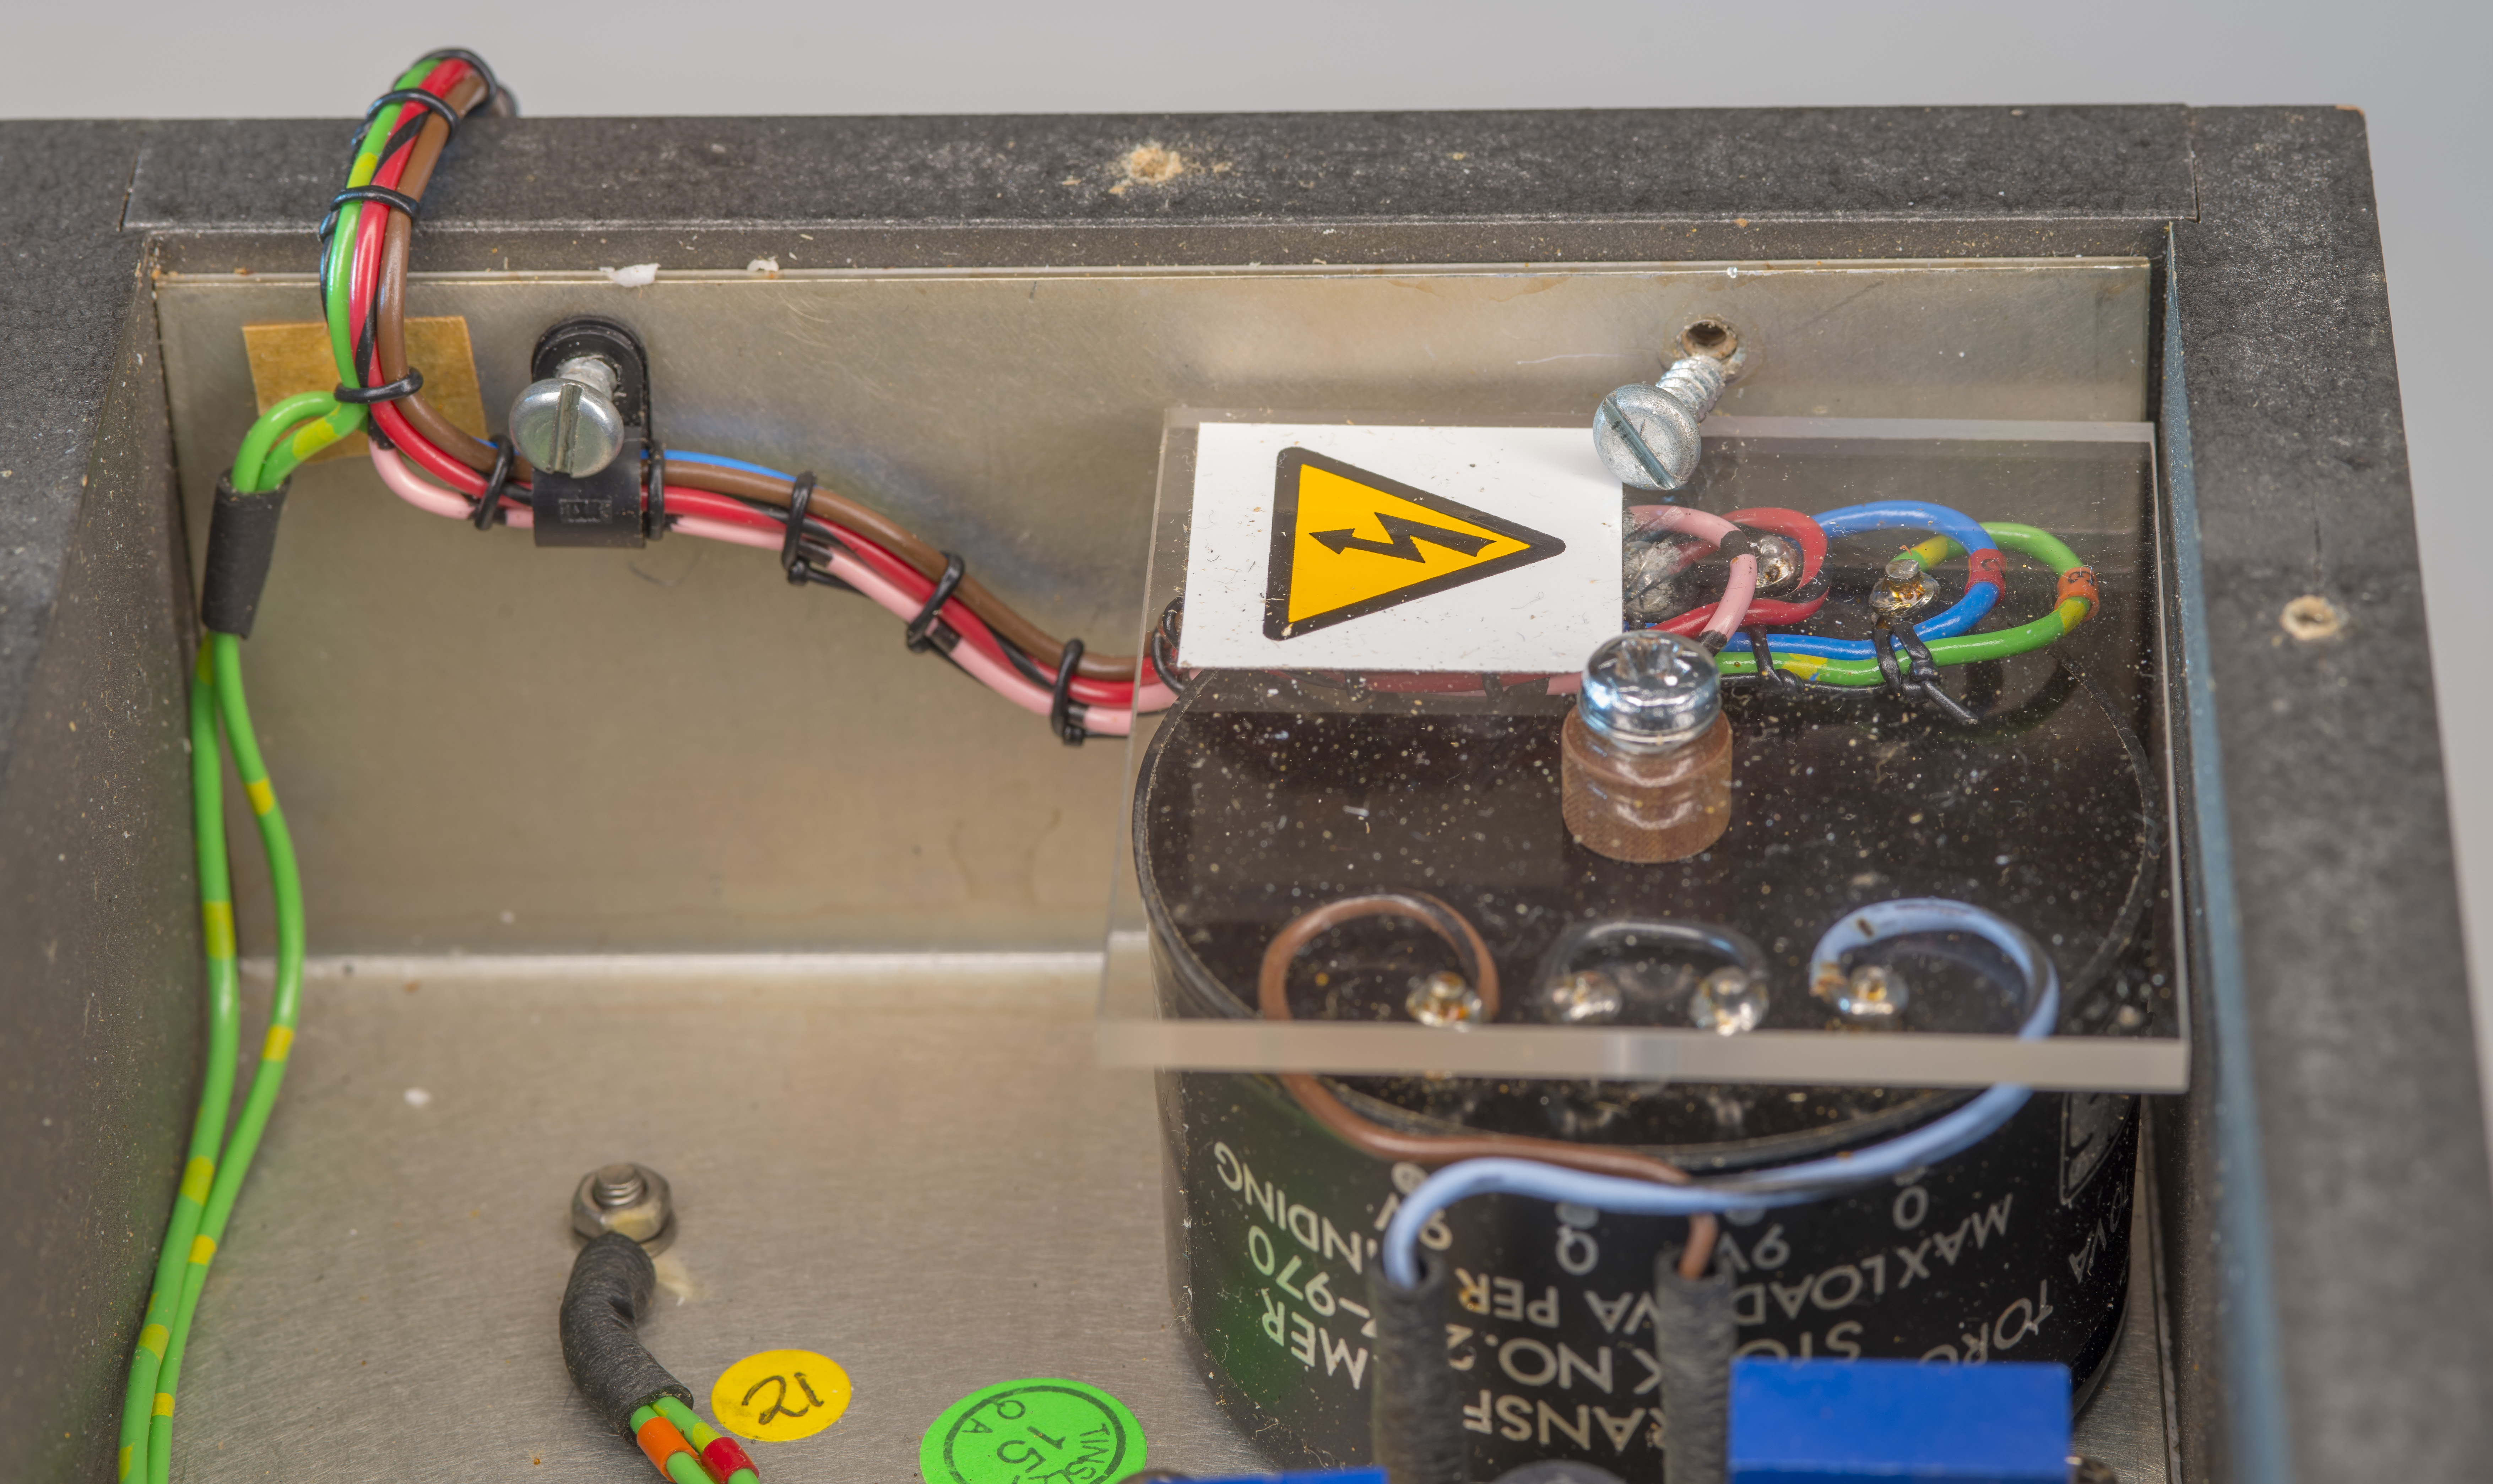
A small toroidal transformer is used to convert mains 120 V AC input to 20 V AC which is further rectified and regulated to +15 V DC level. Transformer exposed contacts are protected from contact by bolted on clear polycarbonate sheet.
Wiring is done with multi-stranded copper tinned conductor cables. No magical special PTFE cables or silver oxygen free interconnects. Part of the reasoning is the target applications of 5648 box for thermometry, where the most commonly needed standard values are 25 Ω and 100 Ω. With such low resistances, leakage effects can be neglected even for high precision long resolution measurements.
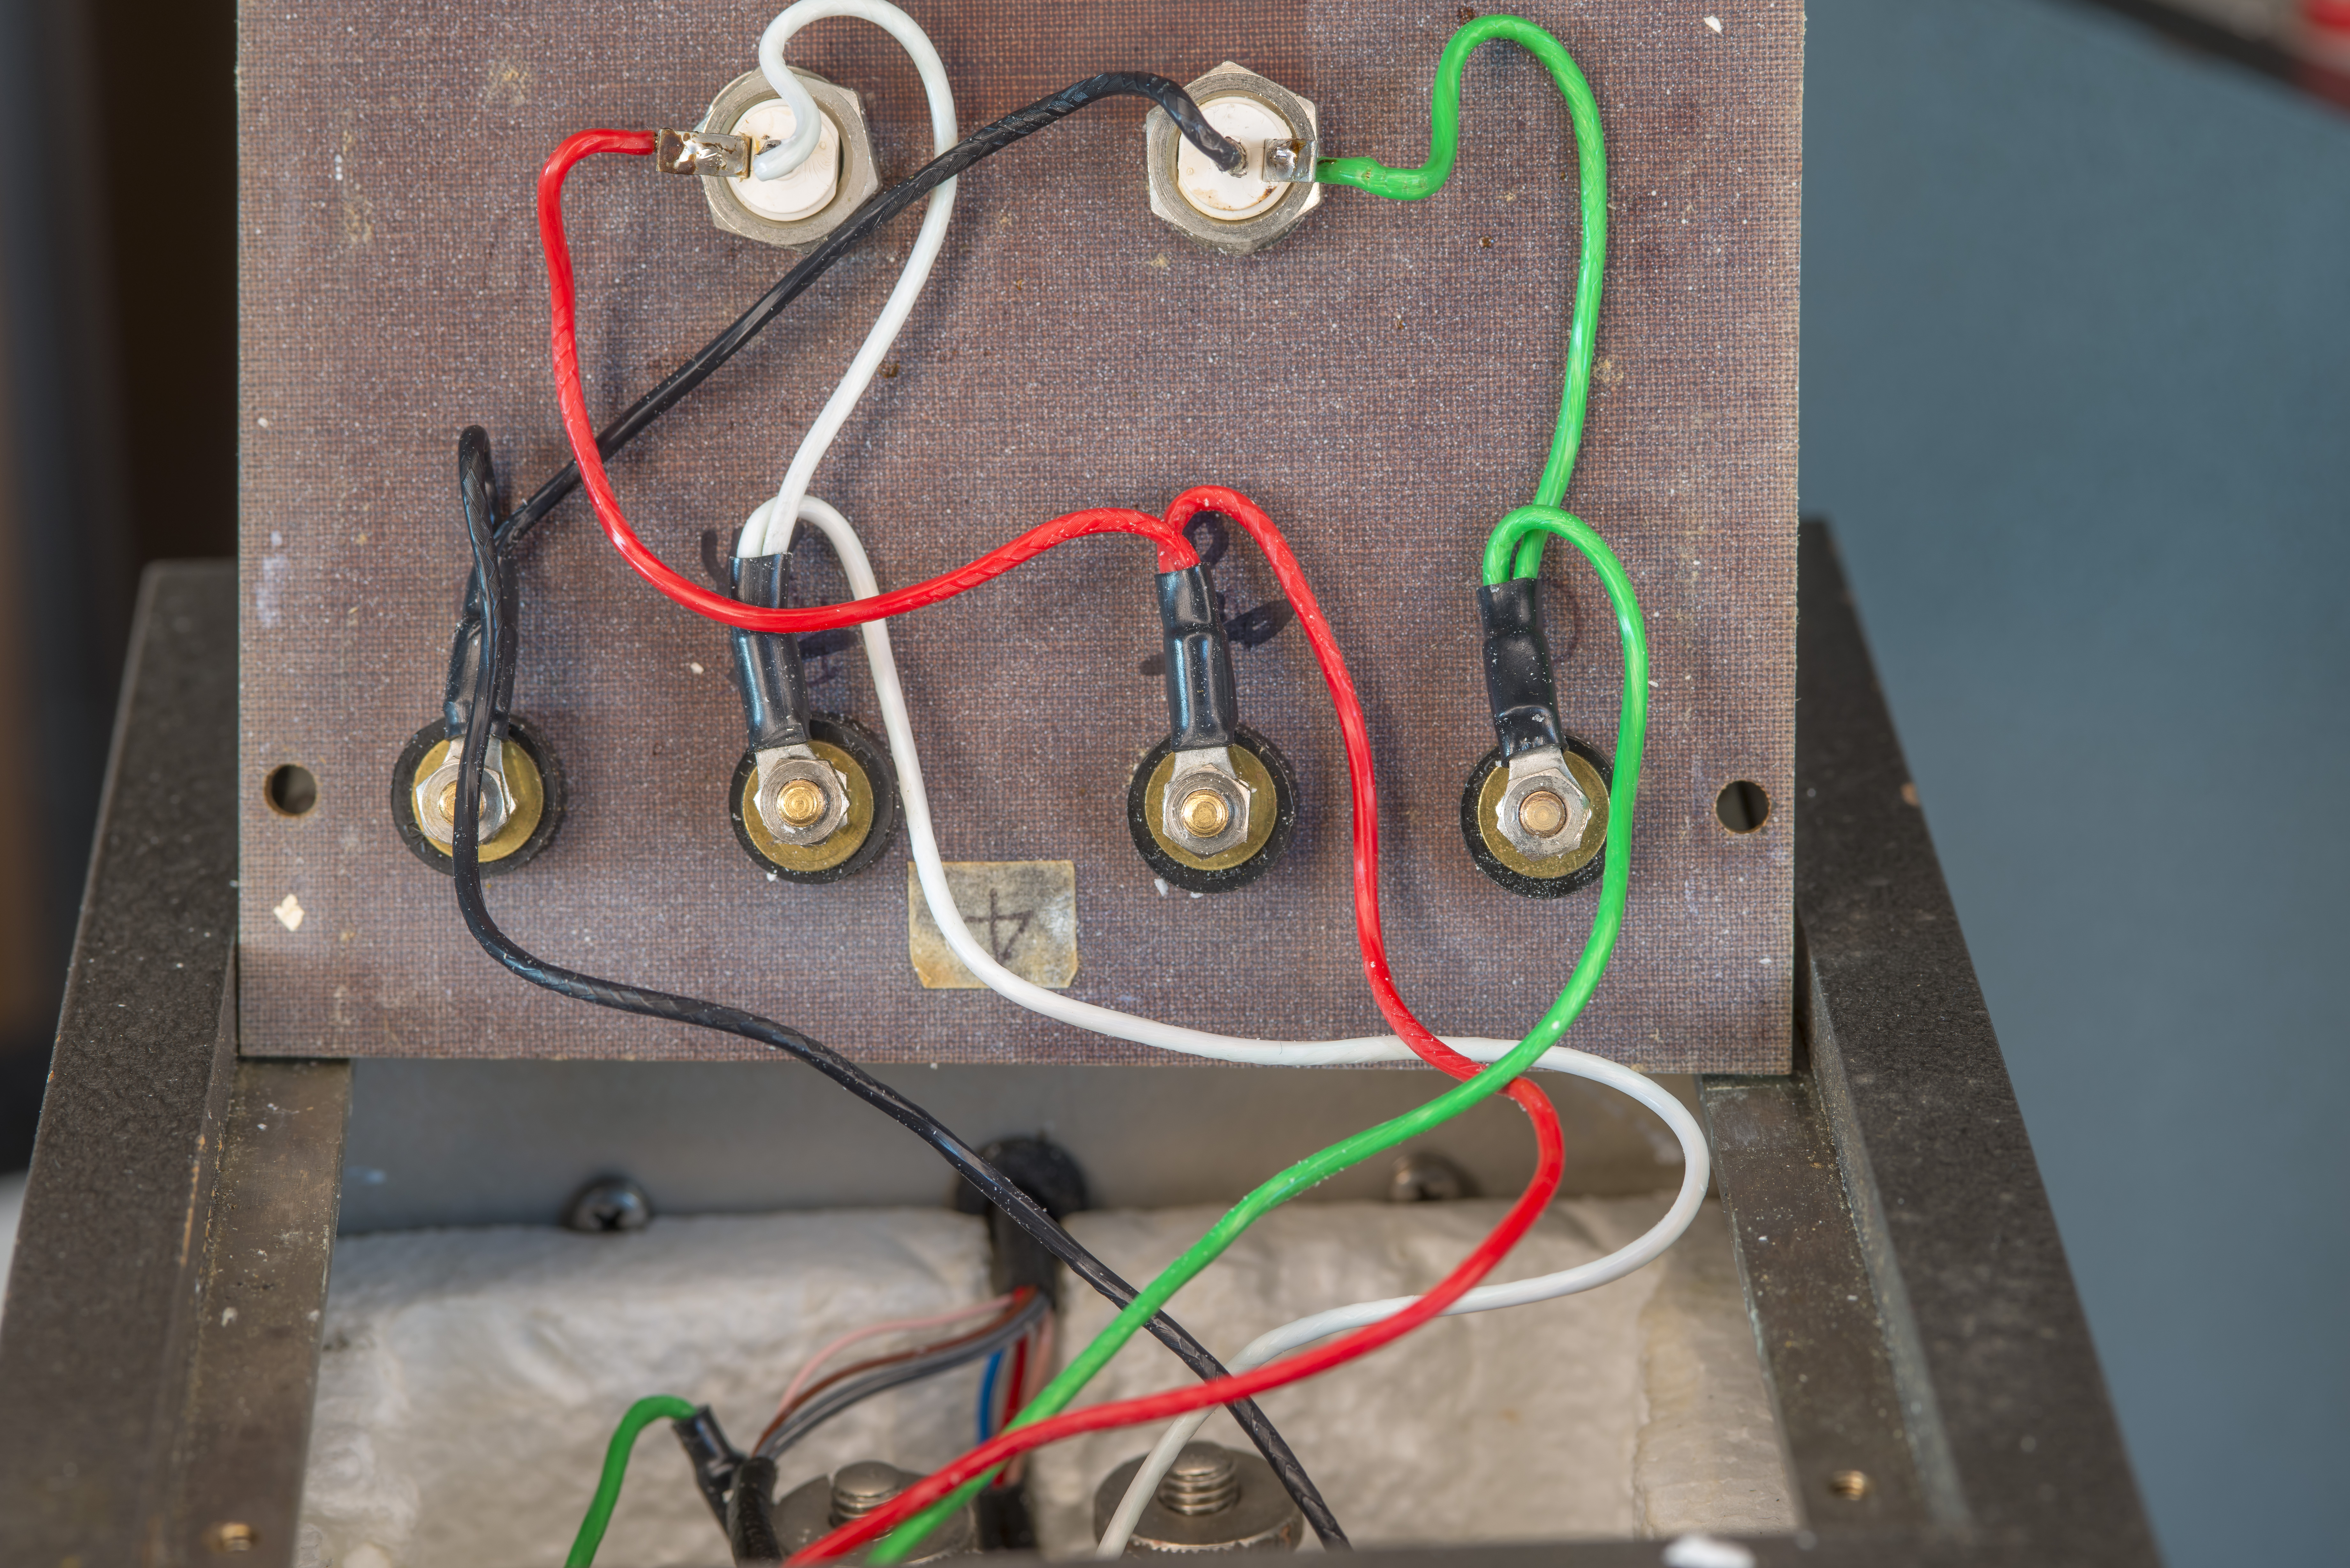
All the interconnect between boards are done with collet sockets and test pins. Cables are nicely formed around and color coded for easy assembly and testing. It’s a bit weird to have circuitry on three different boards instead of one larger PCBA. Likely this was done due to unification since Tinsley could reuse the separate boards in multiple products.
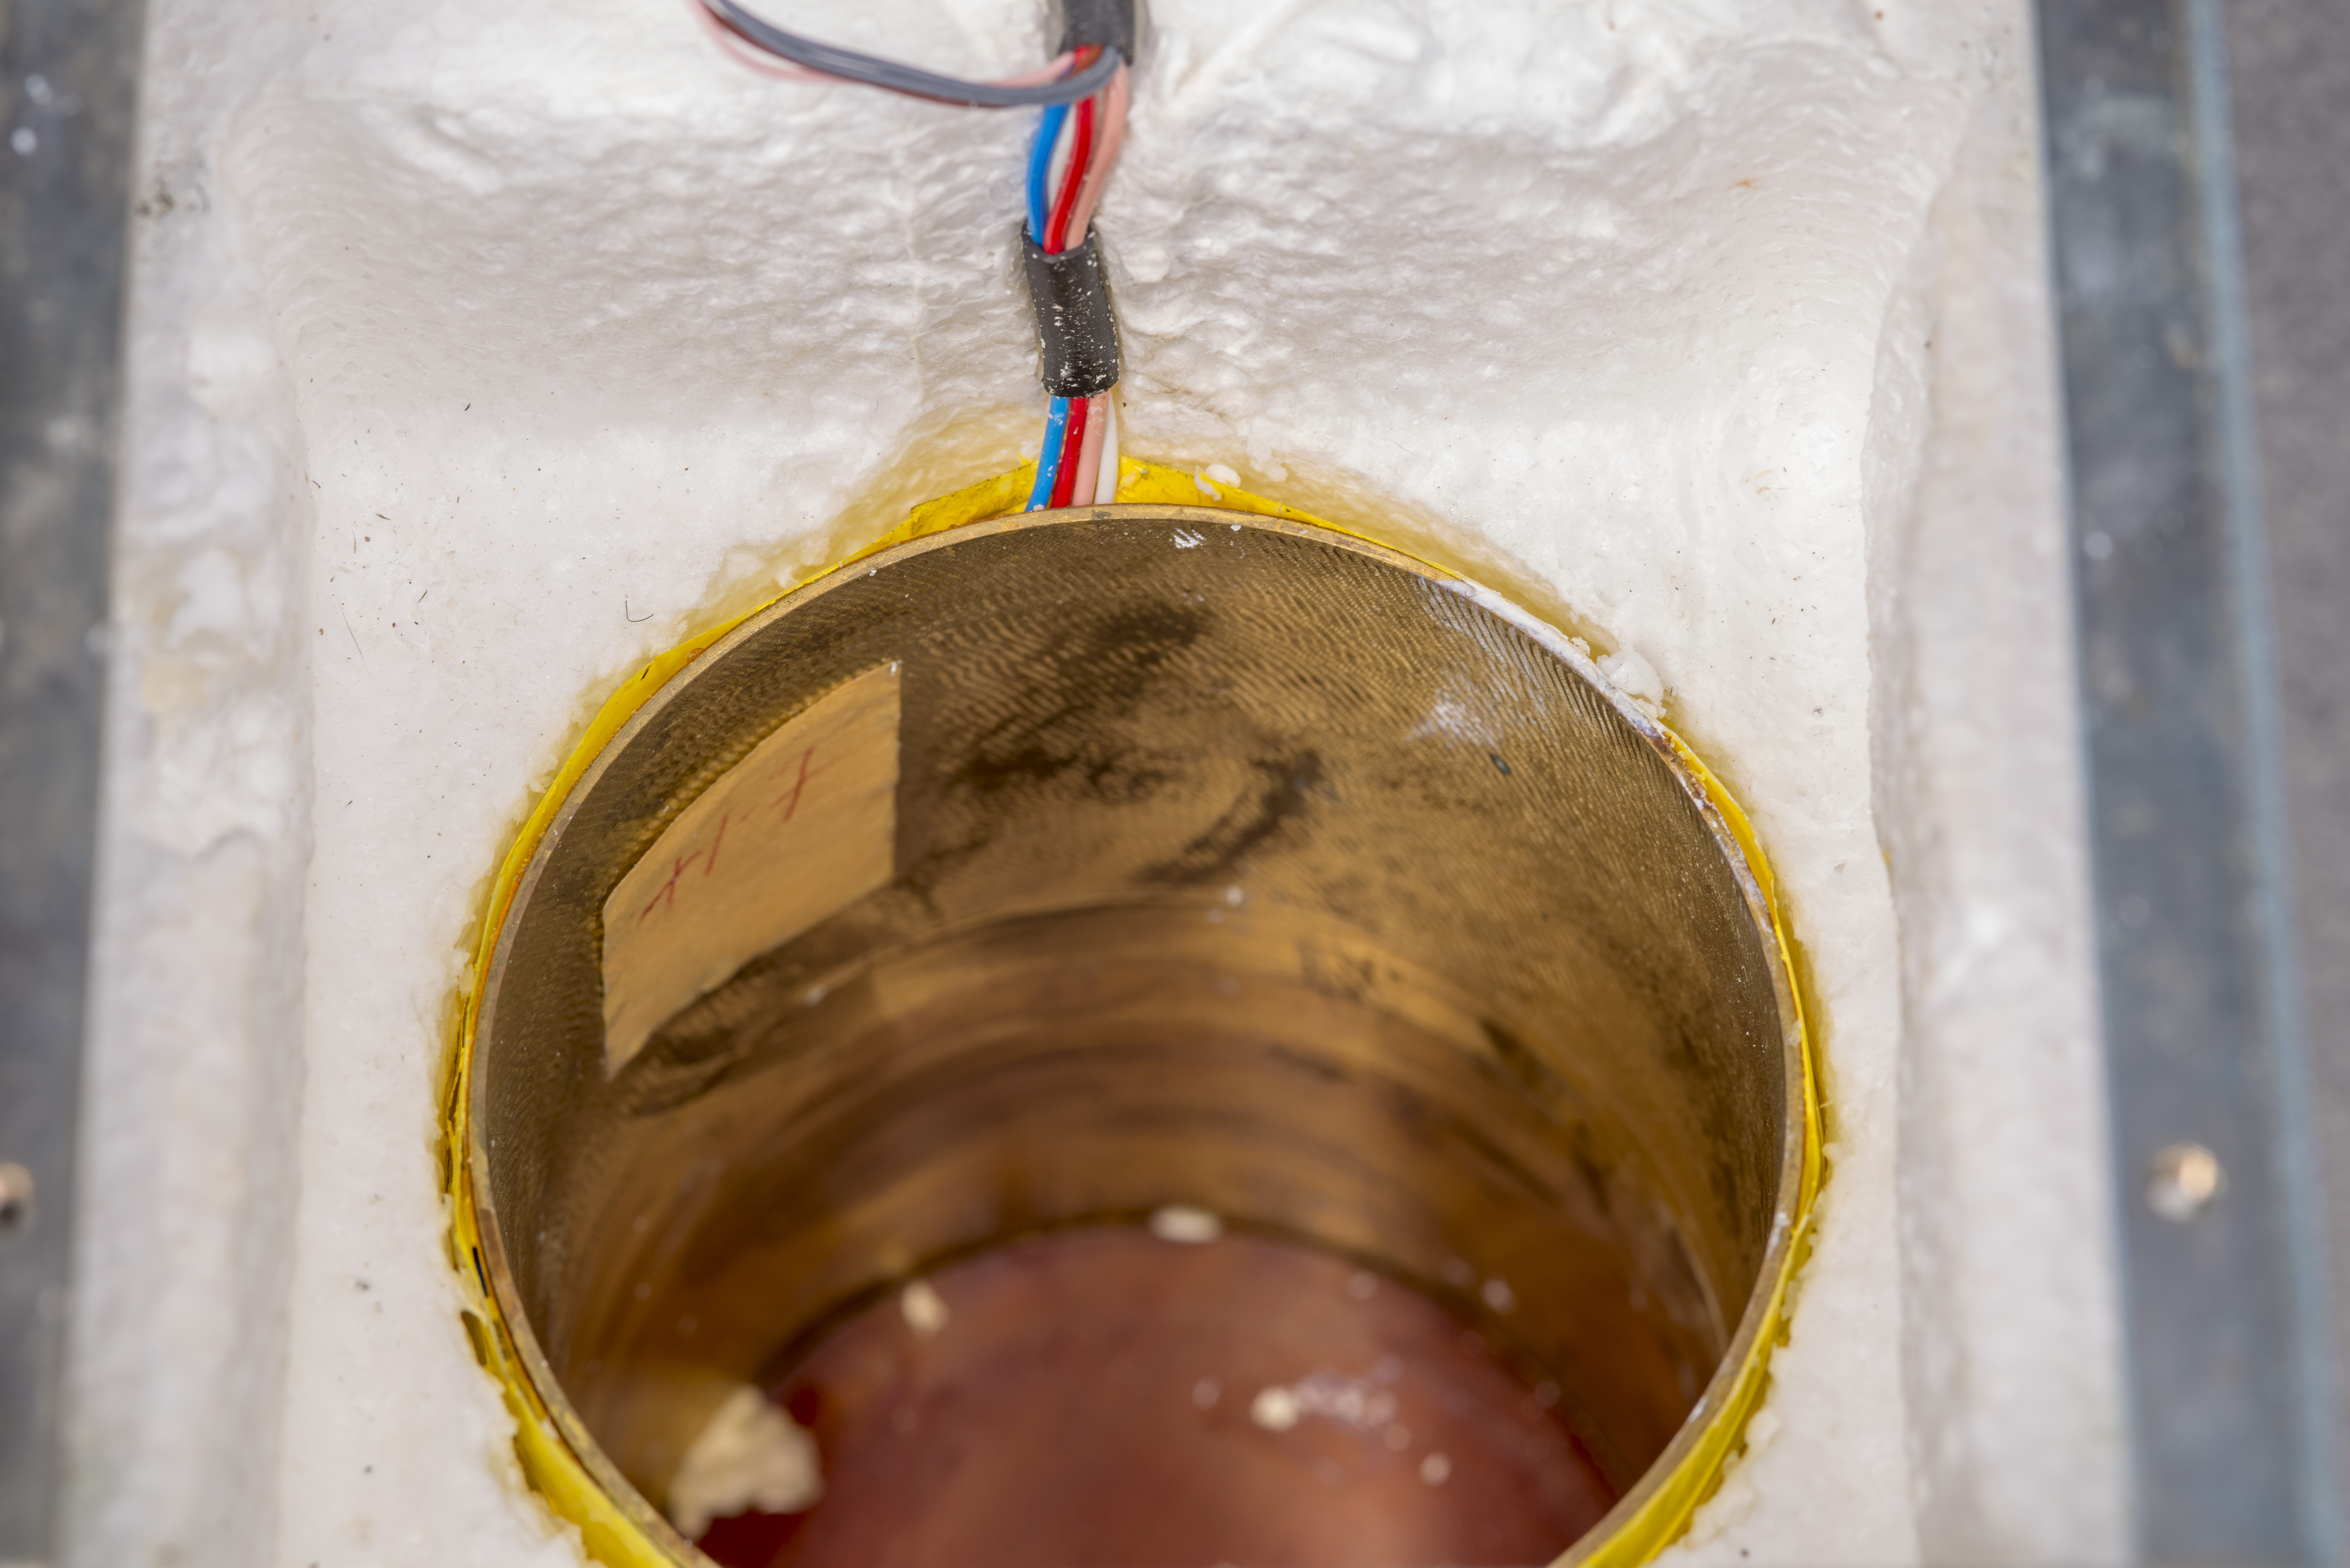
Heater coil is wrapped around 1 mm thick brass cylinder that is loosely matching T5685A resistance standard body. There is no direct thermal coupling interface between resistor body and the heated cylinder. Adding a thermal paste or similar thermal transfer compound could help with thermal transfer but is not really friendly for the ability to swap resistors from the enclosure without getting into messy cleaning and grease application.
Insulation around heated cylinder with resistance standard is usually closed cell Styrofoam with a square lid on top covering connector and formed box around heater unit.
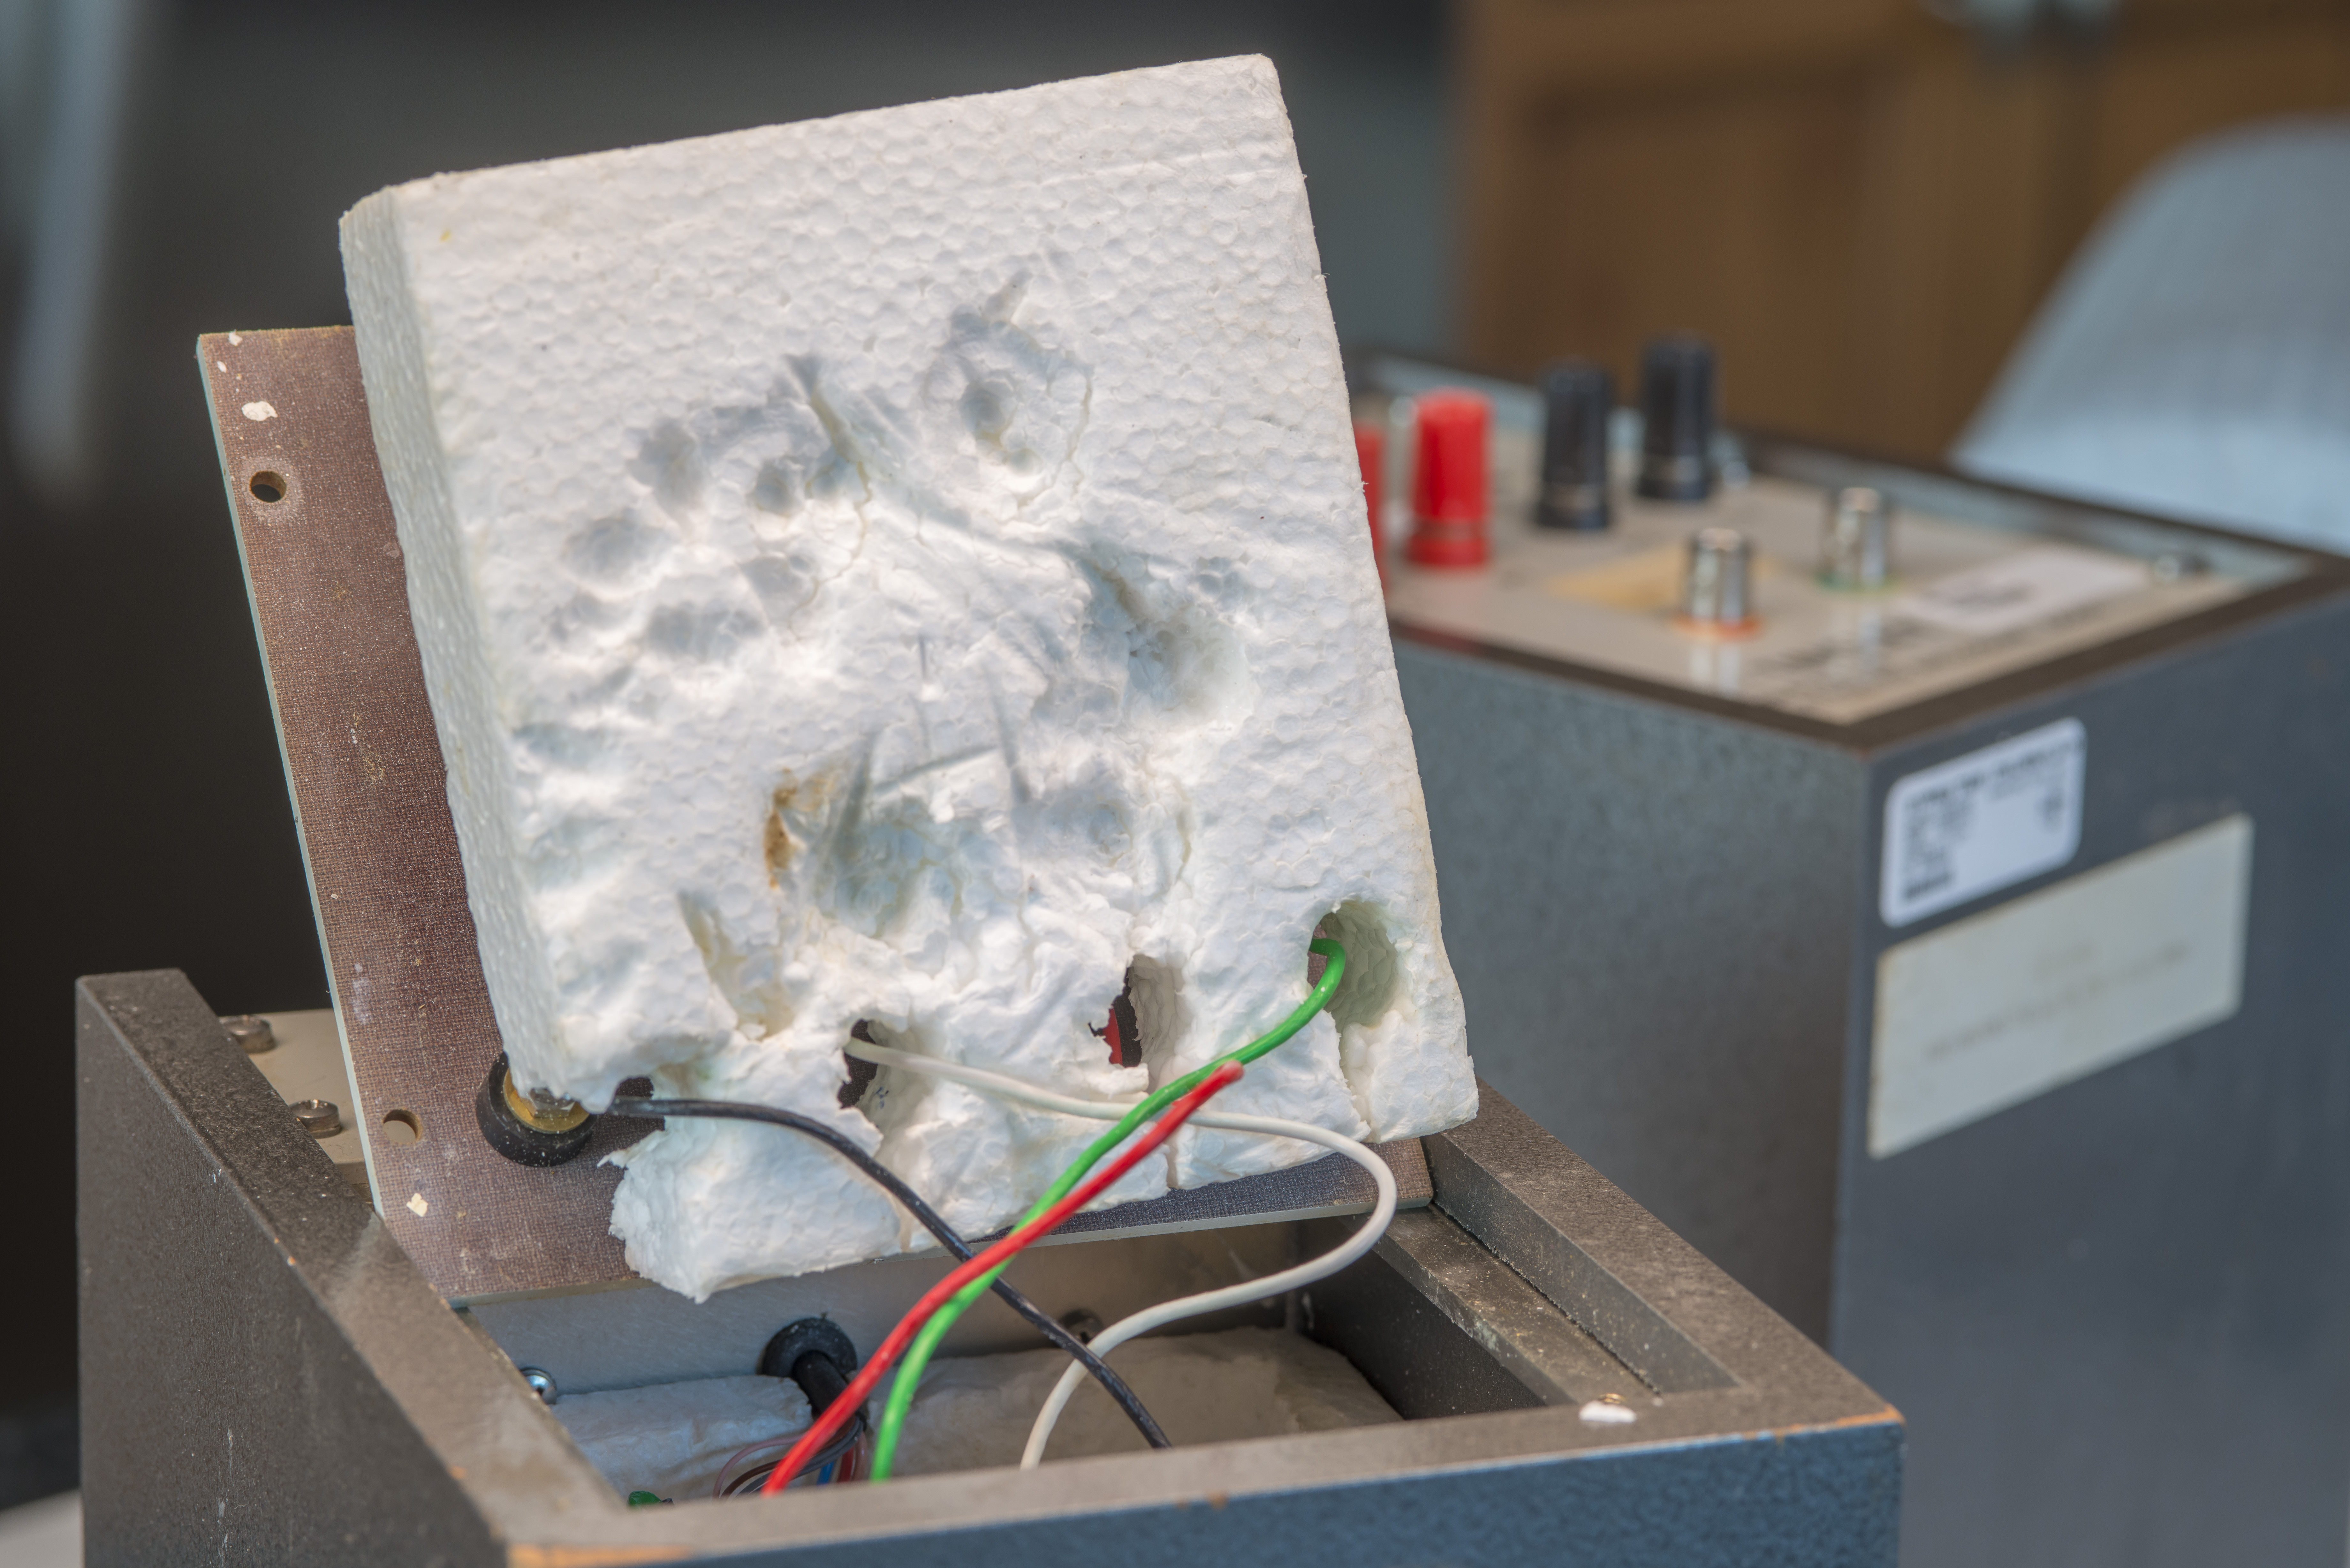
There is fiberglass pad on the bottom of the heater cylinder. Interesting to note the four wires going into the heater element, perhaps they use two separate heaters internally? I have not disassembled the unit any further as it’s still a functional device.
Resistance standard connected to wires with ring terminals. The resistance knobs are nickel plated copper and the connection ring lugs are made out of copper but have tin plating. Knobs are really tight and I was unable to undo the large terminal to inspect using finger force only. Tool marks from pliers or similar tools are also clearly visible on the knobs. This was an unusual surprise for me as I like to keep spade lugs at maximum finger strength to self-clean mated surfaces mechanically. Excessive torque is quite dangerous for Tinsley 5685A standards and could cause large shifts of resistance, as was observed and investigated by MSL before .
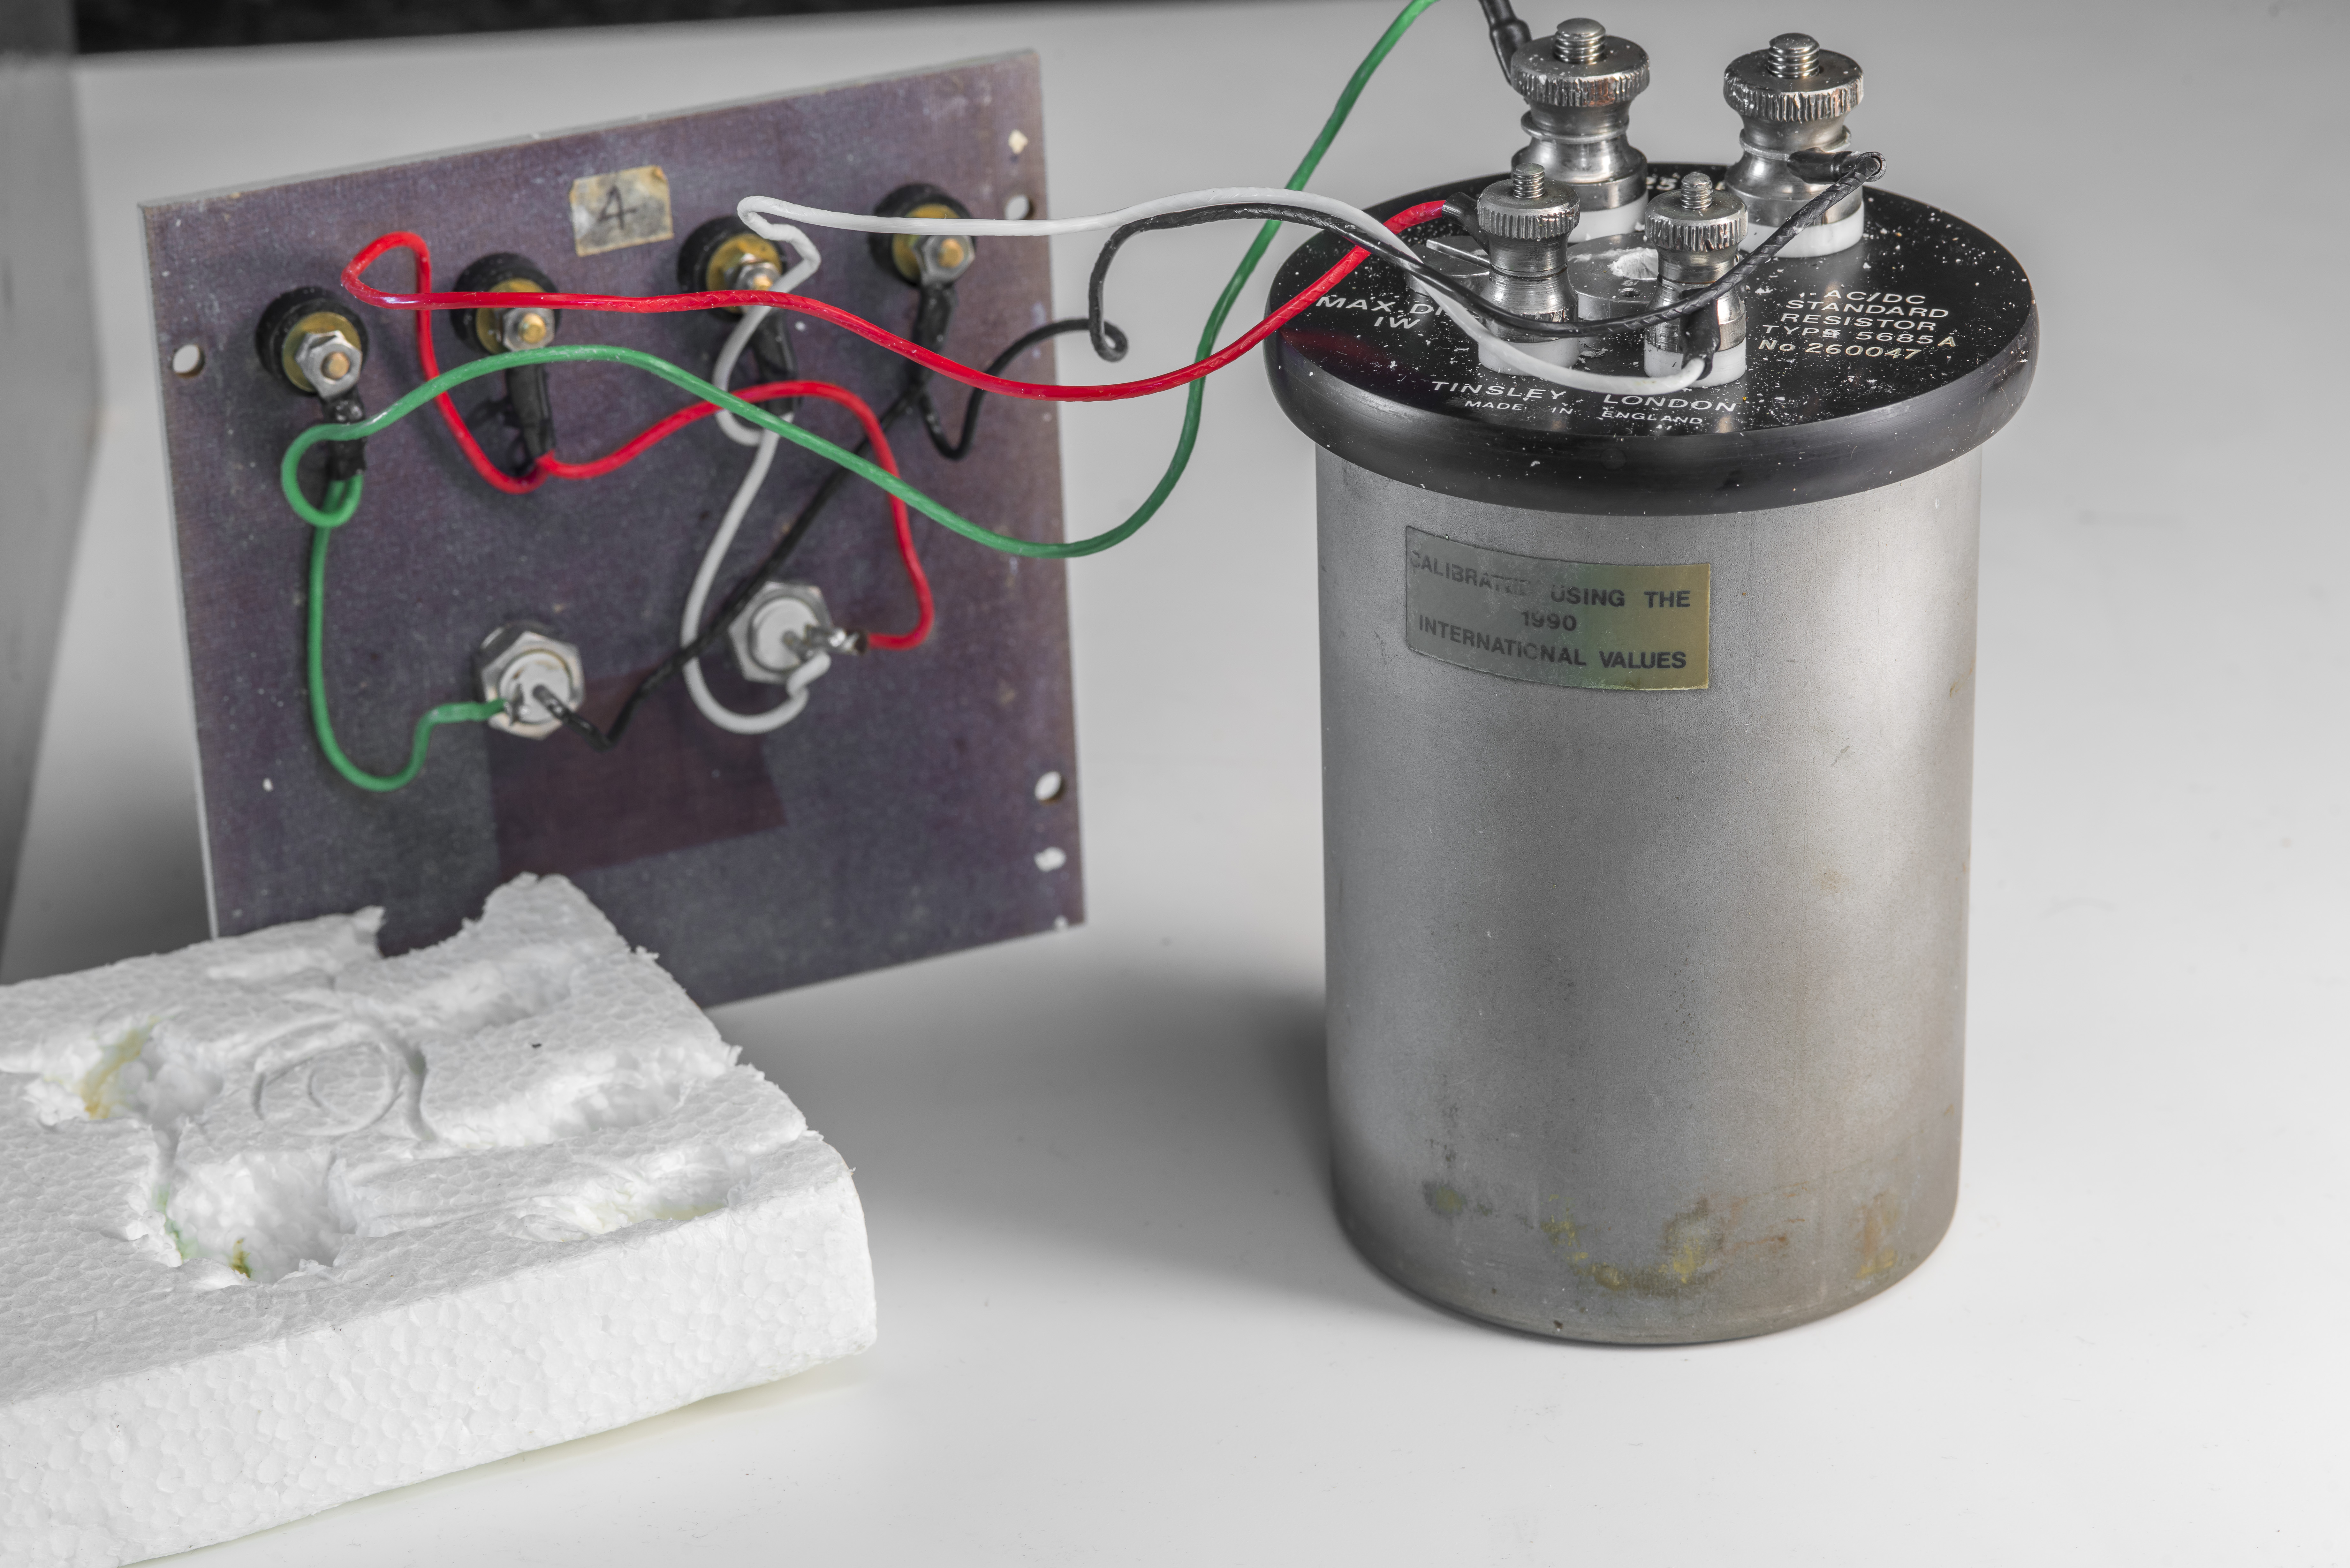
Since the standard was built after 1990 SI units metrology update, there is a note label on the standard to underline the use of new SI 1990 updated values for factory calibration values. Bit more details about historical changes of ohm units available in our SI 2019 units redefinition article when SI unit finally went away from the last physical artifact for mass – IPK. The next such redefinition of SI units is targeting the year 2030 or 2032 for switching the time unit second from cesium atom transition standards to optical clocks to obtain 100 times better uncertainty.
Reverse engineering the PCBA modules
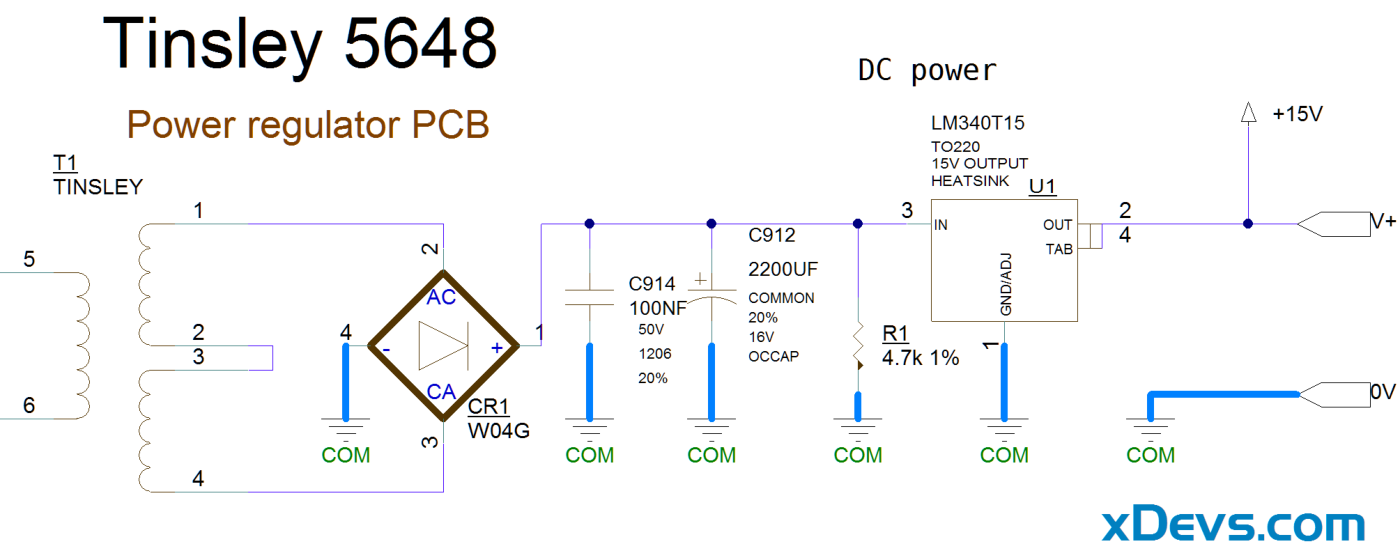
First, we can start with a simple board – DC power regulator. It is trivial diode bridge rectifier with axial 220 µF electrolytic filtering capacitor and LM340T15 regulator in TO-220 package, mounted to an aluminum chassis frame to help with heat dissipation. Bleeding resistor 4.7 kΩ installed to act as a minimum load.
Now the actual heater circuit controller. It’s a simple resistive bridge with thermistor element used in one of the arms as a sensor. Operational amplifier uP741 then compare difference between the fixed adjustable resistance network arm and arm with thermistor to determine the error signal for the heater drive. It’s purely analog circuit with a small 10 nF film capacitor in the feedback loop to avoid possible fast oscillations close to thermal equilibrium. Otherwise there’s not much else to the circuit here.
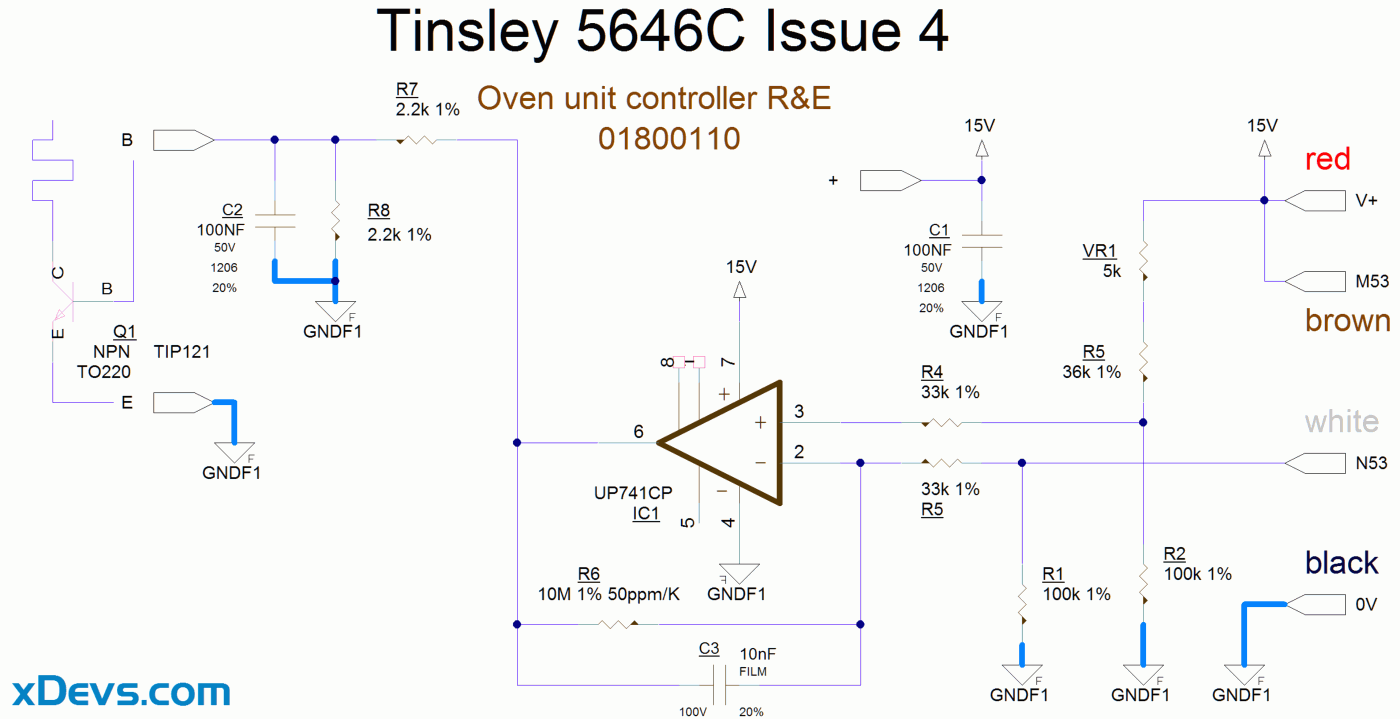
Interesting to note that PCBA with heater controller bears the model number 5646. Tinlsey 5646A is actually ovenized voltage standard with a chemical cell.
Thermistor itself is installed inside of the 5685A’s thermometer well to ensure good thermal coupling with the internal oil tank. White thermal grease compound used to improve thermal contact between thermistor capsule and metal well walls. Heater itself is embedded around a brass cylinder around the resistance standard with 1mm thick walls. It has only loose coupling to the resistance standard body, with a gap of few millimeters.
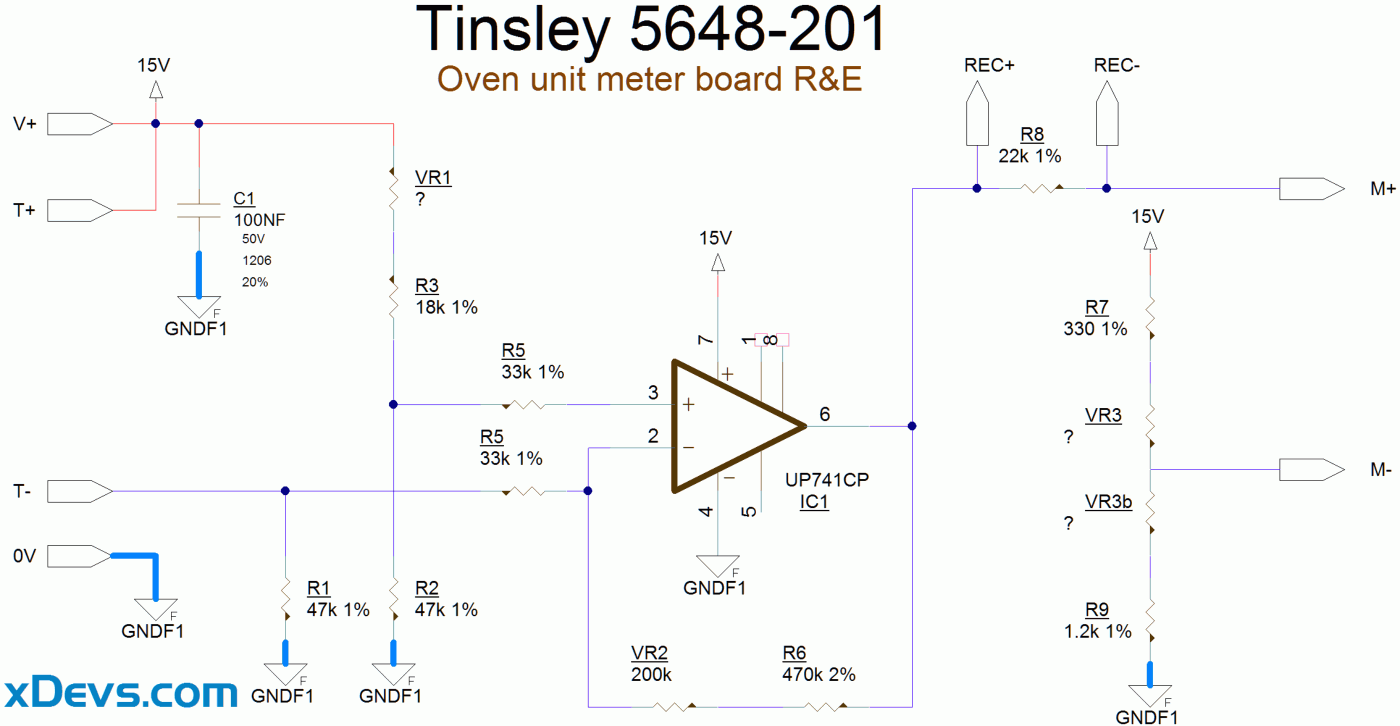
Finally, the 3rd board is used to translate thermistor value into a current to drive the meter head for indication of the temperature. This meter circuit is decoupled from the heater controller and works somewhat independently.
Overall it’s pretty simple cost-effective solution to the temperature coefficient problem that many of the older resistance standards designed for oil-bath use have and also eliminates the need for a separate precision air-bath or messy oil-bath to maintain stable resistance standards for thermometry laboratories.
It will be interesting to measure the actual performance of this oven and temperature control in the future once we get back to rechecking these Tinsley standards for a new recalibration cycle.
Conclusion
In this article we looked at construction and performance verification results of three standard resistors from Tinsley with nominal values 1, 10 and 100 Ω. Performance of 100 Ω standard is quite impressive with optimal working temperature around +28°C and good temperature stability. Sadly 10 and 1 Ω did not carry over the same performance and did not quite match factory ±2 ppm/°C specifications for TCR. We don’t know past history of these standards and no previous calibration data on them, so it is impossible to say if these resistors were overheated or mistreated otherwise to cause large TCR.
There is also significant change between initial measurements on friendly lab Measurements International 6010T bridge system and in-house Measurement International 6010B, but these could be simply attributed to the difference in temperature measurements during tests. Like with all previous resistance metrology tests at xDevs.com reference RTD sensor is placed directly in the DUT and reference standards thermal wells (or into good mechanical contact in grounding post if no thermal well is available).
Initial measurements by other lab were based off RTD sensor placed in air-bath chamber, and not inside resistor’s well. Thermal gradient and non-uniformity in air-bath could cause difference in actual resistive element temperatures over 0.5 °C, which matching TCR difference to ppms we got by deviation in 10 and 1 Ω results. This is to be confirmed and article will be also updated once we have more data.
Discussion is very welcome thru comment section or at our own IRC chat server: irc.xdevs.com (port 6010, channel: #xDevs.com). If you have information and performance reports of various resistance standards not mentioned or listed in this article, feel free to provide them and we will add them with next article update. We are looking forward to add another resistance standards into our datasets if they become available.
Projects like this are born from passion and a desire to share how things work. Education is the foundation of a healthy society - especially important in today's volatile world. xDevs began as a personal project notepad in Kherson, Ukraine back in 2008 and has grown with support of passionate readers just like you. There are no (and never will be) any ads, sponsors or shareholders behind xDevs.com, just a commitment to inspire and help learning. If you are in a position to help others like us, please consider supporting xDevs.com’s home-country Ukraine in its defense of freedom to speak, freedom to live in peace and freedom to choose their way. You can use official site to support Ukraine – United24 or Help99. Every cent counts.
Modified: Jan. 16, 2025, 1:22 a.m.