- Introduction and motivation
- Disclaimer
- CalFest 2025 xDevs key members
- Resistance transfers with TM (FL Lab) with Fluke 742A standards
- International transfer with branadic’s 10 kΩ travel resistance standard
- Keithley 2002 8½-digit DMM calibration for MK
- AC/DC transfers between three Fluke 792A kits
- AC/DC transfers and calibration with Todd’s Fluke 5790A against 792A AC/DC reference
- Repair, teardown and documenting for Fluke 9610A/9640A RF reference sources
- Conclusion and future plans
Introduction and motivation
Calibration festival is a small unofficial offline event dedicated to meet with passionate people related to science of measurements – metrology. CF’s main purpose is to share the costs of high level calibrations for electrical units such as SI Volt and Ohm into our hobby labs and personal equipment, as well as showcase what is possible to achieve for metrology applications with limited budgets.
One of the main inspiration sources – inter-lab comparisons performed on the level of NMI and reports published on BIPM KCDB. Idea is to replicate similar project but at much lower hobby-level personal budget and scale. None of us is able to cover full-featured measurement laboratory or establish direct realization of SI unit at quantum level, but teamed up together we can hopefully get pretty close to the top of the uncertainty pyramid in specific measurements.
CF2025 main meeting event was held offline in NJ, USA location during a week of 3 March 2025 – 11 March, 2025. However, preparation for experiments and measurements with equipment dedicated for event began as early as January 2025 and completed in the end of March 2025. Most of the experiments were automated with Python to allow execution in parallel and reduce risk of human-induced errors in data.
Automation was handled by compact single-board computer Raspberry Pi with communications over GPIB and Ethernet interfaces. Software used for most of experiments is written in Python language. Key tools are internal use xDevs CalKit packages, as well as publicly available xDevs TECkit package. All experiments results were recorded in CSV-type RAW data files and further processed by various analysis packages. In-house analysis Python apps and MIL 6000B software was used for 10 kΩ resistance transfers measurements with older MIL 6000A bridge system.
Disclaimer
Redistribution and use of this article or any images or files referenced in it, in source and binary forms, with or without modification, are permitted provided that the following conditions are met:
- Redistribution of articles must retain the above copyright notice, this list of conditions, link to this page (/article/cf2025/) and the following disclaimer.
- Redistribution of files in binary form must reproduce the above copyright notice, this list of conditions, link to this page (/article/cf2025/), and the following disclaimer in the documentation and/or other materials provided with the distribution, for example Readme file.
All information posted here is hosted just for education purposes and provided AS IS. In no event shall the author, xDevs.com site, or any other 3rd party, including guest lab members be liable for any special, direct, indirect, or consequential damages or any damages whatsoever resulting from loss of use, data or profits, whether in an action of contract, negligence or other tortuous action, arising out of or in connection with the use or performance of information published here.
If you are willing to contribute or add your experience regarding test equipment, repairs or provide extra information, you can do so following these simple instructions.
Performance of each particular instrument may be worse or better than shown in this article. For details consult with manufacturer specifications and perform your own testing. Don’t take data presented here as typical results from other instruments, even of the same model/year. All data presented here is NOT accredited and NOT certified to be free of errors. Proceed with this warning in mind.
CalFest 2025 xDevs key members
- Illya Tsemenko (pilot xDevs lab)
- Igor O. (NJ Lab)
- Todd M. (FL Lab)
Special guests and visits
- CS (TC Lab, PA) – visit on March 5, car road-trip
- Andre (branadic, Germany) – remote participation with 10kΩ DIY travel box
- MK (KF Lab, Norway)
Experiments performed during this CalFest meetup
- DC Voltage standards comparison at 10 V point
- Inter-comparison with resistance standards at 10 kΩ, 1 kΩ, 100 Ω, 10 Ω and 1 Ω
- Tests and teardown photoshoot for Fluke 9610A/9640A hardware during livestream
- AC/DC Fluke 792A transfer standard calibration tests
- AC/DC Fluke 5790A voltmeter calibration tests
Resistance transfers with TM (FL Lab) with Fluke 742A standards
To continue stability study in the scope of large Fluke 742A evaluation experiment number of standards from TM (FL Lab) were brought to xDevs lab to repeat measurements. High-performance Measurements International 6010B and 6000A bridge systems were used to accurately measure ratios with stability better than 0.1 µΩ/Ω. Both reference and unknown resistance standards placed in temperature controlled air baths, maintained at +23.0 °C ±0.1 °C to greatly reduce impact from temperature coefficient of each device. Results of week long measurements are presented in the traceability map below:
Image : Resistance transfers during xDevs CalFest 2025
Very stable ESI SR104 S/N G202088930104 was used as a primary reference at 10000 Ω nominal point, which was then transferred to other 10 kΩ standards using MI 6000A system. MI 6000A was connected to 10 V Fluke 732B DC voltage source and Keysight 3458A 8½-digit DMM, used as a detector. These transfers are outlined in pink arrows on the map above. Lower resistance ratio values were measured with MI 6010B DCC bridge, using freshly calibrated 10 kΩ. All measurement parameters are presented in table below. Each standard was logged for number of hours and was allowed to settle for 24 hours after transport at fixed +23.0 °C. air-bath.
| Transfer configuration | Standard | Device under test | DUT Test current | Timing delay | Detector |
|---|---|---|---|---|---|
| Primary 10 kΩ | ESI SR104 | 742A S/N 5820007 | 500 µA | 20rdg/20sec/32 | MI 6000A + 732B + 3458A |
| Primary 10 kΩ | ESI SR104 | SL935 S/N 001 | 500 µA | 20rdg/20sec/32 | MI 6000A + 732B + 3458A |
| MM742A 10 kΩ | ESI SR104 | 742A S/N 5095049 | 500 µA | 20rdg/20sec/32 | MI 6000A + 732B + 3458A |
| branadic’s 10 kΩ | ESI SR104 | UPW50-104 S/N 001 | 500 µA | 16rdg/16sec/24 | MI 6000A + 732B + 3458A |
| MM742A 1 kΩ | SL935 S/N 001 | 742A S/N 5505003 | 3.16 mA | 10 seconds | MI 6010B |
| MM742A 1 kΩ | 742A S/N 5095049 | 742A S/N 5505003 | 3.16 mA | 10 seconds | MI 6010B |
| MM742A 100 Ω | 742A S/N 5505003 | 742A S/N 5445015 | 10 mA | 10 seconds | MI 6010B |
| MM742A 10 Ω | 742A S/N 5445015 | 742A S/N 6330003 | 10 mA | 8 seconds | MI 6010B |
| Tinsley 5685A2 10 Ω | 742A S/N 6330003 | T5685A2 S/N 262283 | 10 mA | 8 seconds | MI 6010B |
| MM742A 1 Ω | 742A S/N 6330003 | 742A S/N 5175026 | 50 mA & 100 mA | 8 seconds | MI 6010B |
| xDevs 742A 1 Ω | 742A S/N 6330003 | 742A S/N 5825005 | 50 mA & 100 mA | 8 seconds | MI 6010B |
| xDevs FSL935 1 Ω | 742A S/N 6330003 | SL935 S/N 001 | 50 mA & 100 mA | 8 seconds | MI 6010B |
Table : Resistance transfers during xDevs CalFest 2025
Data for each run is also available, including runs with different currents and settings for lower resistance standards.
Transfers to Fluke 742A-1 Ω model, S/N 5175026 from Fluke 742A-10 Ω 6330003
Transfers to Fluke 742A-10 Ω model, S/N 6330003 from Fluke 742A-100 Ω S/N 5445015
Transfers to Tinsley 5685A2 10 Ω from Fluke 742-10 Ω S/N 6330003
Transfers to Fluke SL935 1 Ω from Fluke 742A-10 Ω S/N 6330003
Transfers to Fluke 742A-1 Ω model, S/N 5825005 from Fluke 742A-10 Ω model, S/N 6330003
Transfers to Fluke 742A-100 Ω model, S/N 5445015 from Fluke 742A-1 kΩ model, S/N 5505003
Transfers to Fluke 742A-1 kΩ model, S/N 5505003 from FSL935
Transfers to Fluke 742A-1 kΩ model, S/N 5505003 from S/N 5095049
Based on these measurements a bit large shift of +3.43 µΩ/Ω was detected from Fluke 742A-1kΩ S/N 5505003 standard, relative to previous calibration performed during xDevs.com CalFest 2023. We have double checked the measurement using another 10 kΩ reference standard and arrived at the same value within the noise limits below 0.1 µΩ/Ω. There is no evidence of damage or improper handling prior to explain this shift. It is still within Fluke’s annual specification for 742A-1k which is ±6 µΩ/Ω but we hoped for better stability from this well aged 742A-1k :). This observation again confirms the importance of periodic calibrations and checks on artifact standards even such expensive high-end models like the commercial Fluke 742A.
International transfer with branadic’s 10 kΩ travel resistance standard
Our friend and fellow engineer André Bülau is often busy with various sensors and metrology-related projects. This time he sent a small box with goodies, including yet another DIY 10 kΩ travel resistor standard.
Image : Items received from branadic
This build is based around inexpensive TE Connectivity UPW50B10KV. André got his resistor from RS Components and packaged it into nice sturdy metal enclosure with special TBP-2 PTFE-insulated copper binding posts. Center circular connector provided for internal NTC for temperature sensing of the resistor element, which is very useful for TCR compensation/determination.
Image : Resistance transfer unit with label
These wire wound resistors are available with standard ±5 µΩ/Ω TCR in various tolerances and power rating specs. Since TCR is quite large and can easily compromise overall transfer uncertainty additional temperature sensor was coupled to the resistor body and exposed to miniature circular connector in the center of the metal enclosure box.
André shipped his resistor box with small battery-powered temperature monitor via standard commercial postal service from Germany to xDevs HQ. Package arrived intact and lowest recorded temperature during the transit was observed at -2.5 °C. Resistor then was subjected to suite of calibration tests using our in-house DCC and BVD high-resolution automated bridges from Measurements International. These bridges provide extremely stable and low-noise sample points, suitable for calibration of 10000 Ω point with uncertainty better than ± 0.2 µΩ/Ω.
Image : Resistance transfers during measurement with MI 6000A
Both absolute resistance and temperature coefficient stability were evaluated over a duration of month. Artifact box was not altered or disassmbled to preserve the condition “as received”. The flat line at +23.0 °C after delivery on the datalogger plot is not a data glitch but actually time when artifact together with datalogger were placed in megaTEC air-bath temperature chamber during “as received” initial calibration at xDevs HQ.
Image : Temperature record from datalogger during shipment and initial testing
xDevs.com TCkit Python analytics results
Temperature stability was evaluated with automated script and resistance artifact placed in the miniTEC programmable air-bath for temperature sweep from +18 °C to +28 °C over the duration of 86 hours.
Resistance output was measured with MIL 6010B DCC resistance bridge relative to ovenized transfer xDevs.com MP1 1010.11747 Ω standard, freshly calibrated from Fluke FSL935 standard. Open-source xDevs.com TCkit software application was used for analysis. It is available here on GitHub and tested working with Python 3.9.x.
Data-file will all samples from the experiment
Generated report with results:
Image : Charts generated by xDevs TCkit script with data analysis
Actual script version used to generate the TCR report, Python 3.9
Temperature was measured by external PT sensor, plugged into grounding post.
Image : Platinum sensor position during the TCR sweep testing
Image : Resistance transfers unit main connections
Summary table with calibration results presented below. Resistance output demonstrated almost non-existant hysteresis after TCR sweep, which is great.
| Model and serial | Calibration date | Assigned value | Uncertainty | Calculated drift | TCR measured | Age/condition |
|---|---|---|---|---|---|---|
| UPW50-104 SN1 | 14.FEB.2025 by branadic | 10002.07 Ω | ± ? µΩ/Ω | µΩ/Ω, µΩ/Ω/a | α: +5.954 µΩ/Ω/K, β: -0.0667 µΩ/Ω/K^2 | Initial datapoint |
| UPW50-104 SN1 | 7.MAR.2025 by xDevs MI 6000A BVD | 10002.1079 Ω | ± 0.5 µΩ/Ω | +3.8 µΩ/Ω | Initial calibration “as received” | |
| UPW50-104 SN1 | 9.MAR.2025 by xDevs MI 6000A BVD | 10002.1068 Ω | ± 0.4 µΩ/Ω | +3.7 µΩ/Ω | Initial calibration “as received” | |
| UPW50-104 SN1 | 19.MAR.2025 by xDevs MI 6010B DCC | 10002.0977 Ω | ± 0.8 µΩ/Ω | +2.8 µΩ/Ω | α: +5.839 µΩ/Ω/K, β: -0.028 µΩ/Ω/K^2, +126.7 °C ZTC | TCR sweep |
| UPW50-104 SN1 | 31.MAR.2025 by xDevs MI 6000A BVD | 10002.1054 Ω | ± 0.26 µΩ/Ω | +3.5 µΩ/Ω, -3.8 µΩ/Ω/a | Re-calibration “as returned” |
Table : Transfer results history for branadic’s 10 kΩ travel standard
Now this resistance standard is shipped to KF Lab in Norway to continue the cycle of measurements and experiments and will be later returned to Dr. Andre for re-calibration and verification of fully completed round-trip cycle.
![]()
Image : Transfer data and all sample points with 6000A
Image : GUI during one of the measurement cycles
It would be interesting how much agreement would we establish after this international low-cost transfer. I’ll update the data in this article as it will become available.
Keithley 2002 8½-digit DMM calibration for MK (Norway Lab)
To support our friend MK in Norway xDevs decided to transfer the very first 8½-digit DMM from Keithley, Model 2002 that we got decade ago for the first Keithley 2002 article. I’ve had a lot of history and time spent with this very meter, enabling many interesting projects around DC Voltage metrology such as LTZ1000 ‘FX’ reference project and later nanovolt amplifier projects with EM A10. That Keithley 2002 used almost daily since 2014. Now it’s time to bring joy and fun to a new friend. In this article I’ll outline the calibration verification and adjustments performed on the unit prior to it’s departure to Norway. Before any adjustment Keithley 2002 DUT DMM need to be tested for calibration as outlined in service manual and INL check. This would help to gain confidence in the instrument and confirm correct operation before we spend time adjusting it and testing for overall compliance with the manufacturer performance specification.
Remote control configuration for Keithley 2002
This Keithley 2002 (and the lesser brother, 7½-digit Model 2001) is equipped only with GPIB interface for remote control and programming. To communicate with instrument GPIB to LAN bridge was used. This is perhaps the easiest and most flexible approach. HP/Agilent/Keysight E5810A and modern variant Keysight E5810B are essentially small embedded computers with multiple interfaces running simple RTOS and gateway app. These boxes work as a proxy for the GPIB data over standard Ethernet network. You can connect to same E5810A Gateway from multiple hosts and there is no need to setup or install any dedicated software/drivers on the host PC. The very light-weight python-vxi11 library allows direct access to GPIB bus thru E5810A. You do NOT need messy linux-gpib installed to use this GPIB access method.
Below is example on how to install and use Keysight E5810 series LAN/GPIB gateway to communicate with Keithley 2002 and any other GPIB instruments, such as calibrators, power supplies, oscilloscopes, etc. All this is running on a small low-power Raspberry Pi microcomputer on Raspbian OS with the preinstalled Python 3 environment.
1. Get SVN repository for python-vxi
svn checkout https://github.com/python-ivi/python-vxi11
cd python-vxi11/trunk
Enter /home/vxi/python-vxi11/trunk directory
python setup.py install
Now python-vxi should be installed on your linux platform, such as Raspbian OS on Raspberry Pi, that we use here.
Here’s example python app to talk with VXI instrument:
import vxi11
inst =  vxi11.Instrument("192.168.1.12", "gpib0,6") # IP address of E5810A and GPIB address of instrument
inst.timeout = 30                                  # Timeout for interface to wait, seconds
print(inst.ask("*IDN?"))
Make sure to type “gpib0,6” is in lowercase, and don’t put any spaces between the comma and the instrument address. Number 6 here is our GPIB instrument address, configured from front panel of Keithley 2002.
Timeout setting to 30 change the GPIB I/O timeout delay, it is important for long operations when instrument might not reply in default timeout time. This is important for example for resistance measurements with NPLC 50, enabled filters, OCOMP ON and DELAY 1.
In case of correct installation and connection reply can be as below:
KEITHLEY INSTRUMENTS INC.,MODEL 2002,1167961,A10 /A02
Now we can write more elaborate Python apps to control instruments, collect results and do post-processing and analysis.
Lab environment conditions were also recorded and monitored during all performance verifications. For this Bosch BME280 temperature/humidity/pressure sensor module was attached to same Raspberry Pi SBC and accessed with Python library. More details on how to configure BME280 for Pi is provided in this xDevs guide.
Keithley 2002 calibration results prior to adjustment, last adjustment January 19, 2023
Below are results of calibration performed on Keithley 2002 in “as received” condition with previous adjustment done in January 2023. This means the meter was calibrated (compared to known source/standards) without any adjustments or corrections applied. It is important to follow the correct terminology as outlined in metrology guidelines and standards. Calibration process never include adjustment or alterations to the device under test, despite the confusing use of term “calibration” in manufacturer manuals and documents. Even major manufacturers like Keithley, Fluke, Keysight make this mistake and misleading reader by thinking that “calibration” means process of adjusting instrument to best possible accuracy.
xDevs.com follows strict definition of metrology vocabulary, where calibration is defined only as the measurement of unit under test against verified reference standard with known uncertainty, explicitly excluding any adjustments. Adjustment procedure is clearly stated as a separate operation and not part of calibration.
List of verification and reference equipment used related to this calibration shown in table below. Our equipment matches accuracy requirements outlined in the calibration manual with a good margin to perform good quality calibration.
| Type | Manufacturer | Model P/N | Options/value | Serial number | CEID | Calibration date | Due date |
|---|---|---|---|---|---|---|---|
| MFC | Fluke | 5720A | 03/HLK | 7800202 | XHC2 | 03/23/2025 | 09/23/2025 |
| DC STD | xDevs.com | 792×[2] | 9.9999701 VDC | ±0.3 ppm | XD01 | 03/23/2025 | 04/23/2025 |
| STDR | xDevs.com/Fluke | SL935 | 1.00006495 Ω | ±0.6 ppm | XR03 | 03/08/2025 | 03/08/2026 |
| STDR | xDevs.com/Fluke | SL935 | 9999.9766 kΩ | ±0.3 ppm | XR02 | 03/20/2025 | 03/20/2026 |
| DMM | HP | 3458A | 001,X02 | MY45040325 | XD2 | 03/18/2025 | 04/18/2025 |
| Divider | Fluke | 752A | 4295200 | XR01 | SELFCAL | SELFCAL | |
| Null-meter | Keithley | 155 | 25499 | XD49 | SELF_CAL | SELF_CAL | |
| ARB | Keysight | 33522B | MEM,IQP,OCX,GPIB | MY52806638 | XG05 | N/A | N/A |
Table 1: Reference equipment list used to test Keithley 2002, as received
Keithley 2002 in natural habitat with friends and Fluke 5720A “Hulk” calibrator system. Multiple wiring options were explored but that study is a topic for another article. Sadly, Model 2002 uses shrouded banana posts so I’m unable to use my typical go-to copper low-thermal spade lug cables here.
Image 7: Typical setup with Keithley 2002 connected to multi-function Fluke 5720A calibrator
Unlike typical accredited calibration reports from commercial laboratories, main purpose of this calibration was not to provide certification of any kind if the instrument meets manufacturer specifications or not, but instead look at how much drift the meter has demonstrated since the last adjustment. Results presented here are not accredited or legally binding information, but provided only for education purposes on AS IS basis. To make the test more challenging and interesting I’ve opted for using a much tighter 24-hour specification interval for BOTH reference multi-function calibrator Fluke 5720A and Keithley 2002 under test, instead of annual limits typically used by commercial calibration services.
Calibrator was adjusted and tested to meet 24-hour specifications with help of fixed standards, Measurements International 6010B and 6000A resistance bridges and calibrated reference HP 3458A DMM. It is also important to appreciate that 8½-digit DMM demands well tested and characterized calibrator, since even high end 7½-digit calibrators like Fluke 5720A can barely meet specifications required to properly verify Model 2002 DMM. Artifact calibration of our Fluke 5720A was previously verified using resistance bridge systems for resistance and current output accuracy and with calibrated zener standard and HP3458A for voltage ranges. All this usually performed by experienced technicians with access to proper equipment, methods and training. Automation here helps huge deal, improving reproducibility and quality of results. Performing a full function test of modern multi-function multi-range instrument like long-scale DMM is still a tedious many hours’ task and automation allows to free up operator time a lot. I can’t imagine how many days all these benchmarks would take if done the old-school way with pencil and paper notepad.
There is no reason for correctly working DMM to fail to meet 24-hour specification within a short time after the adjustment. To maintain the same reference point it was decided to perform both as received and as returned calibrations using these same short-term specifications. Obviously the instrument would pass much wider 1 year specifications in the same conditions if it falls well within 24-hour spec.
Keithley 2002 does not have 24-hour interval specification for AC Voltage, AC Current, Frequency and Temperature functions. 90 days’ spec used for ACV and ACI instead.
Per legal or traceability purposes it is important to understand this calibration is automatically voided after 24 hours are lapsed, which is acceptable in this case with educational goals in mind. Now on good news – a typical high-performance instrument such as 8½-digit Keithley 2002 is built using high quality components and low drift LTZ1000A-reference, so it is common that these DMMs maintain their tight specifications with good margins compared to specifications. Based on our experience with more than nine different Keithley 2002’s these instruments can stay well within 24 hour specs for multiple months when provided with good stable environment and proper lab use without abuse.
Keithley 2002 calibration results as received
Now that we done with initial concept, time to look into actual calibration test. Suite was automated and executed using xDevs.com CalKit Python automation suite. Test was performed on March 24, 2025 and took ~15 hours to complete. Temperature in room kept at +23.0 °C ±2 °C. Test points and ranges are heavily inspired by Keithley 2002 calibration document from May 2004, Rev.D. This document is available for download below:
Model 2002 Calibration Manual, Rev D, May 2004
Model 2002 Multimeter Specifications, Rev I, Nov 2009
No testing or verification of functions using rear inputs was performed this time. No tear-downs or disassembly was performed either prior to this test since last adjustment in January 2023. If you are looking for more knowledge about Model 2002 internal design be sure to check xDevs.com’s own Keithley 2002 review and second unit repair articles. Calibration was done with Keithley 2001-TSCAN scanner card installed in the expansion bay. Fan filter grill was freshly cleaned.
Keithley provides relative uncertainty specifications in tables. Operator must perform additional analysis and use factory calibration adders (in case of Keithley own calibration data provided) or calibration laboratory standards or CMC uncertainty from calibration report to obtain absolute uncertainty for every function/range combination.
For all tests this instrument was powered on from standard 120 VAC 60 Hz mains on same rail as reference equipment, such as calibration, guard-band reference HP 3458A and resistance bridge. DMM was allowed to warm-up and settle for 24 hours before any measurements were commenced. Owner did partial point-calibration for DC Voltage functions, but all other functions were untouched, so it would be quite interesting to see results before any adjustments.
First is DC Voltage function zero calibration. This verification is specific to DC voltage measurements. The offset, or zero, is the voltage reading that the multimeter displays when it is not measuring any voltage. This is an important value to check and calibrate as a DC voltage multimeter that has a significant offset will give inaccurate calibration for gain, or suggest there are malfunctions and internal faults that may need repairs.
| Keithley 2002,1167961,A10/A02, Last adjustment date 22.JAN.2023. Performance verification xDevs.com Rev.3156/2980 24.MAR.2025 | ||||||||
|---|---|---|---|---|---|---|---|---|
| DC zero test procedure for all test points that verify offset of the DCV function. 4-wire copper short at DMM | ||||||||
| Test Description | Zero Value | DUT | Source U | Lower Limit | Upper Limit | DUT Spec | Test Status | |
| Short 0 mVDC | 0.000 | -1.46 µV | 1.4 µV | -2.6 µV | 2.6 µV | 1.2 µV | PASS | |
| Short 0.0 VDC | 0.000 | -1.55 µV | 1.4 µV | -5.4 µV | 5.4 µV | 4.0 µV | PASS | |
| Short 00.0 VDC | 0.000 | +0.10 µV | 1.4 µV | -81.4 µV | 81.4 µV | 80 µV | PASS | |
| Short 000.0 VDC | 0.000 | +65.0 µV | 1.4 µV | -601.4 µV | 601.4 µV | 0.6 mV | PASS | |
| Short 0000.0 VDC | 0.000 | +20.0 µV | 1.4 µV | -6001.4 µV | 6001.4 µV | 6 mV | PASS | |
Table 2: DC Zero offset performance, as received
DC voltage for multimeter verification is an important step in ensuring accurate measurements. Internally multimeter is relying on accurate and stable DCV functionality to operate other functions as well. Performance verification involves comparing the readings of the multimeter to a known standard, such as high accuracy and stability Fluke 5720A calibrator reference here. Calibration does NOT involve adjusting the multimeter’s internal components or corrections to the known standard. Performance verification and calibration should be performed regularly to ensure the accuracy of the multimeter, typically within 1 year periods.
| Keithley 2002,1167961,A10/A02, Last adjustment date 22.JAN.2023. Performance verification xDevs.com Rev.3156/2980 24.MAR.2025 | ||||||||
|---|---|---|---|---|---|---|---|---|
| DC Voltage test procedure for all test points that verify gain of the DCV function. 2-wire low-thermal connection MFC to DMM | ||||||||
| DCV Test 0.1V-1000V | DUT | Source U | Low Limit | Hi limit | Measured | 24h spec | Result | |
| 0.02 VDC (0.2 Range) | 0.019999941 | 22.5 µV/V | 0.01999888 | 0.02000112 | -3.0 µV/V | 33.5 µV/V | PASS 7.31 % | |
| 0.1 VDC (0.2 Range) | 0.099999749 | 9.5 µV/V | 0.0999981 | 0.1000019 | -2.5 µV/V | 9.5 µV/V | PASS 18.68 % | |
| 0.2 VDC (0.2 Range) | 0.19999943 | 4.5 µV/V | 0.1999978 | 0.2000022 | -2.8 µV/V | 6.5 µV/V | PASS 35.92 % | |
| -0.02 VDC (0.2 Range) | -0.02 | 22.5 µV/V | -0.02000112 | -0.01999888 | 0.0 µV/V | 33.5 µV/V | PASS 0.00 % | |
| -0.1 VDC (0.2 Range) | -0.09999957 | 9.5 µV/V | -0.1000019 | -0.0999981 | -4.3 µV/V | 9.5 µV/V | PASS 32.01 % | |
| -0.2 VDC (0.2 Range) | -0.1999992 | 4.5 µV/V | -0.2000022 | -0.1999978 | -4.0 µV/V | 6.5 µV/V | PASS 50.66 % | |
| 0.2 VDC (2.0 Range) | 0.19999922 | 6.0 µV/V | 0.19999796 | 0.20000204 | -3.9 µV/V | 4.2 µV/V | PASS 53.25 % | |
| 1.0 VDC (2.0 Range) | 1.000002 | 3.2 µV/V | 0.999995 | 1.000005 | 2.0 µV/V | 1.8 µV/V | PASS 54.47 % | |
| 1.9 VDC (2.0 Range) | 1.9000029 | 2.9 µV/V | 1.8999917 | 1.9000083 | 1.5 µV/V | 1.5 µV/V | PASS 46.38 % | |
| 2.0 VDC (2.0 Range) | 2.0000032 | 2.9 µV/V | 1.9999913 | 2.0000087 | 1.6 µV/V | 1.5 µV/V | PASS 49.68 % | |
| -0.2 VDC (2.0 Range) | -0.19999979 | 6.0 µV/V | -0.20000204 | -0.19999796 | -1.0 µV/V | 4.2 µV/V | PASS 14.34 % | |
| -1.0 VDC (2.0 Range) | -1.0000044 | 3.2 µV/V | -1.000005 | -0.999995 | 4.4 µV/V | 1.8 µV/V | FAIL 120.93 % | |
| -1.9 VDC (2.0 Range) | -1.9000082 | 2.9 µV/V | -1.9000083 | -1.8999917 | 4.3 µV/V | 1.5 µV/V | FAIL 133.13 % | |
| -2.0 VDC (2.0 Range) | -2.0000103 | 2.9 µV/V | -2.0000087 | -1.9999913 | 5.2 µV/V | 1.5 µV/V | FAIL 160.53 % | |
| 1.0 VDC (20.0 Range) | 1.0000072 | 7.0 µV/V | 0.9999898 | 1.0000102 | 7.2 µV/V | 3.2 µV/V | PASS 93.55 % | |
| 10.0 VDC (20.0 Range) | 10.000013 | 1.9 µV/V | 9.999967 | 10.000033 | 1.4 µV/V | 1.4 µV/V | PASS 57.20 % | |
| 19.0 VDC (20.0 Range) | 19.00002 | 1.7 µV/V | 18.999943 | 19.000057 | 1.1 µV/V | 1.3 µV/V | PASS 49.67 % | |
| 20.0 VDC (20.0 Range) | 20.000022 | 1.7 µV/V | 19.99994 | 20.00006 | 1.1 µV/V | 1.3 µV/V | PASS 51.40 % | |
| -1.0 VDC (20.0 Range) | -1.0000075 | 7.0 µV/V | -1.0000102 | -0.9999898 | 7.5 µV/V | 3.2 µV/V | PASS 97.44 % | |
| -10.0 VDC (20.0 Range) | -10.00003 | 1.9 µV/V | -10.000033 | -9.999967 | 3.0 µV/V | 1.4 µV/V | FAIL 125.84 % | |
| -19.0 VDC (20.0 Range) | -19.000053 | 1.7 µV/V | -19.000057 | -18.999943 | 2.8 µV/V | 1.3 µV/V | FAIL 130.16 % | |
| -20.0 VDC (20.0 Range) | -20.000057 | 1.7 µV/V | -20.00006 | -19.99994 | 2.8 µV/V | 1.3 µV/V | FAIL 132.24 % | |
| 10 VDC (200.0 Range) | 10.000256 | 6.5 µV/V | 9.999805 | 10.000195 | 25.6 µV/V | 13.0 µV/V | FAIL 176.13 % | |
| 100 VDC (200.0 Range) | 100.00189 | 2.9 µV/V | 99.99913 | 100.00087 | 18.9 µV/V | 5.8 µV/V | FAIL 290.84 % | |
| 200 VDC (200.0 Range) | 200.00361 | 2.7 µV/V | 199.99838 | 200.00162 | 18.0 µV/V | 5.4 µV/V | FAIL 298.89 % | |
| -10 VDC (200.0 Range) | -10.00015 | 6.5 µV/V | -10.000195 | -9.999805 | 15.0 µV/V | 13.0 µV/V | FAIL 103.20 % | |
| -100 VDC (200.0 Range) | -100.00201 | 2.9 µV/V | -100.00087 | -99.99913 | 20.1 µV/V | 5.8 µV/V | FAIL 309.97 % | |
| -200 VDC (200.0 Range) | -200.00394 | 2.7 µV/V | -200.00162 | -199.99838 | 19.7 µV/V | 5.4 µV/V | FAIL 325.89 % | |
| 100 VDC (1000.0 Range) | 100.00184 | 7.0 µV/V | 99.99872 | 100.00128 | 18.4 µV/V | 5.8 µV/V | FAIL 202.41 % | |
| 200 VDC (1000.0 Range) | 200.0035 | 5.0 µV/V | 199.99792 | 200.00208 | 17.5 µV/V | 5.4 µV/V | FAIL 237.79 % | |
| 1000 VDC (1000.0 Range) | 1000.0221 | 3.4 µV/V | 999.98152 | 1000.0185 | 22.1 µV/V | 5.1 µV/V | FAIL 208.86 % | |
| -100 VDC (1000.0 Range) | -100.00182 | 7.0 µV/V | -100.00128 | -99.99872 | 18.2 µV/V | 5.8 µV/V | FAIL 200.21 % | |
| -200 VDC (1000.0 Range) | -200.0037 | 5.0 µV/V | -200.00208 | -199.99792 | 18.5 µV/V | 5.4 µV/V | FAIL 251.38 % | |
| -1000 VDC (1000.0 Range) | -1000.0241 | 3.4 µV/V | -1000.0185 | -999.98152 | 24.1 µV/V | 5.1 µV/V | FAIL 228.55 % | |
Table 3: DC Voltage gain performance, as received
Lot of fail points, but it was expected since we are testing to 24-hour specifications on the meter that was last adjusted 801 days ago. Interesting to note that positive voltages at core 20 VDC range still meet 24 hour spec, even with such conditions. Overall worst error is 326% of the spec on a negative -200 VDC point in 200 V range. Yet another confirmation of excellent long-term stability that these 8½-digit DMM demonstrate, even if not frequently adjusted.
Next is resistance calibration. This procedure used to verify the accuracy of resistance measurements performed by DMM. Model 2002 DMM resistance function is based on measuring the voltage across and the known current sourced by DMM into the external resistance being measured, using four separate wires for resistances below 2 MΩ. The traditional 2-wire method uses only two wires, one for current and one for voltage, but it can be affected by lead resistance. This lead resistance can introduce significant errors in the resistance measurement, particularly when measuring low resistance values below 100 kΩ.
| Keithley 2002,1167961,A10/A02, Last adjustment date 22.JAN.2023. Performance verification xDevs.com Rev.3156/2980 24.MAR.2025 | ||||||||
|---|---|---|---|---|---|---|---|---|
| 4-wire Zero test procedure for all test points that verify Zero offset of the OHMF function. 4-wire kelvin short installed at DMM | ||||||||
| OHM ZERO 4-wire FRONT | Maximum specification | Low Limit | Hi limit | DUT Measured | Result | |||
| 20 Ω Range (4w FRONT) | 5E-05 Ω | -5e-05 | 5e-05 | 0.0000006 Ω | PASS | |||
| 200 Ω Range (4w FRONT) | 5E-05 Ω | -5e-05 | 5e-05 | 0.0000490 Ω | PASS | |||
| 2 kΩ Range (4w FRONT) | 0.0005 Ω | -0.0005 | 0.0005 | -0.0000400 Ω | PASS | |||
| 20 kΩ Range (4w FRONT) | 0.005 Ω | -0.005 | 0.005 | -0.0005000 Ω | PASS | |||
| 200 kΩ Range (4w FRONT) | 0.05 Ω | -0.05 | 0.05 | 0.0009000 Ω | PASS | |||
| OHM ZERO 2-wire FRONT | Maximum specification | Low Limit | Hi limit | DUT Measured | Result | |||
| 20 Ω Range (2w FRONT) | 0.5 Ω | -0.5 | 0.5 | -0.2421141 Ω | PASS | |||
| 200 Ω Range (2w FRONT) | 0.5 Ω | -0.5 | 0.5 | -0.2475600 Ω | PASS | |||
| 2 kΩ Range (2w FRONT) | 0.5 Ω | -0.5 | 0.5 | -0.2526900 Ω | PASS | |||
| 20 kΩ Range (2w FRONT) | 0.5 Ω | -0.5 | 0.5 | -0.2669000 Ω | PASS | |||
| 200 kΩ Range (2w FRONT) | 0.5 Ω | -0.5 | 0.5 | -0.3730000 Ω | PASS | |||
| 2 MΩ Range (2w FRONT) | 5 Ω | -5.0 | 5.0 | -0.8800000 Ω | PASS | |||
| 20 MΩ Range (2w FRONT) | 5 Ω | -5.0 | 5.0 | -0.3000000 Ω | PASS | |||
| 200 MΩ Range (2w FRONT) | 50 Ω | -50.0 | 50.0 | 0.0000000 Ω | PASS | |||
| 1 GΩ Range (2w FRONT) | 50 Ω | -50.0 | 50.0 | 0.0000000 Ω | PASS | |||
Table 4: Resistance zero offset performance, as received
In the test below 4-wire method used for resistances between 1 Ω and 1.9 MΩ. 2-wire method used for resistances 10 MΩ and higher. Precision resistance standards with a known value and four-wire connections are needed or a multi-range calibrator such as 5720A or 5450A. The multimeter should be set in 4-wire mode and connect the four wires to the precision resistance standard, the multimeter will measure the voltage across and the current through the resistance and calculate the resistance. The measurement should be compared with the known value of the precision resistance standard, if the measurement is not within the tolerance then the multimeter should be calibrated or repaired.
Offset Compensation (OCOMP) function is used for resistance values 19 kΩ and below. OCOMP is not supported by Model 2002 for higher ranges. In all cases NPLC 20 was used.
| Keithley 2002,1167961,A10/A02, Last adjustment date 22.JAN.2023. Performance verification xDevs.com Rev.3156/2980 24.MAR.2025 | ||||||||
|---|---|---|---|---|---|---|---|---|
| 4-wire resistance test procedure for all test points that verify gain of the OHMF function. 4-wire connection MFC to DMM | ||||||||
| OHM Test | Reference | DUT | Source unc. | Low Limit | Hi limit | Measured | 24h spec | Result |
| 1 Ω | 0.9996892 Ω | 0.9996474 Ω | 32.0 µΩ/Ω | 0.999562211 | 0.999816189 | -41.8 µΩ/Ω | 95.0 µΩ/Ω | PASS, 41.70 % of 100.3 µΩ/Ω |
| 1.9 Ω | 1.8996598 Ω | 1.8995602 Ω | 25.0 µΩ/Ω | 1.89951281 | 1.89980679 | -52.4 µΩ/Ω | 52.4 µΩ/Ω | PASS, 91.00 % of 57.6 µΩ/Ω |
| 10 Ω | 10.000988 Ω | 10.0010534 Ω | 5.0 µΩ/Ω | 10.000798 | 10.001178 | 6.5 µΩ/Ω | 14.0 µΩ/Ω | PASS, 44.92 % of 14.6 µΩ/Ω |
| 19 Ω | 18.99842 Ω | 18.9985622 Ω | 4.0 µΩ/Ω | 18.998159 | 18.998681 | 7.5 µΩ/Ω | 9.7 µΩ/Ω | PASS, 71.10 % of 10.5 µΩ/Ω |
| 100 Ω | 99.99348 Ω | 0.099994 kΩ | 1.7 µΩ/Ω | 99.99221 | 99.99475 | 2.5 µΩ/Ω | 11.0 µΩ/Ω | PASS, 22.55 % of 11.1 µΩ/Ω |
| 190 Ω | 189.99451 Ω | 0.189994 kΩ | 1.7 µΩ/Ω | 189.992637 | 189.996383 | -0.4 µΩ/Ω | 8.2 µΩ/Ω | PASS, 4.86 % of 8.3 µΩ/Ω |
| 1.0 kΩ | 999.9297 Ω | 0.9999273 kΩ | 1.7 µΩ/Ω | 999.9249 | 999.9345 | -2.4 µΩ/Ω | 3.1 µΩ/Ω | PASS, 68.73 % of 3.5 µΩ/Ω |
| 1.9 kΩ | 1899.8786 Ω | 1.8998749 kΩ | 1.7 µΩ/Ω | 1899.87002 | 1899.88718 | -2.0 µΩ/Ω | 2.8 µΩ/Ω | PASS, 60.01 % of 3.3 µΩ/Ω |
| 10 kΩ | 9999.644 Ω | 9.9996235 kΩ | 1.6 µΩ/Ω | 9999.597 | 9999.691 | -2.1 µΩ/Ω | 3.1 µΩ/Ω | PASS, 58.77 % of 3.5 µΩ/Ω |
| 19 kΩ | 18999.605 Ω | 18.9995621 kΩ | 1.7 µΩ/Ω | 18999.5192 | 18999.6908 | -2.3 µΩ/Ω | 2.8 µΩ/Ω | PASS, 68.65 % of 3.3 µΩ/Ω |
| 100 kΩ | 99993.64 Ω | 99.99325 kΩ | 2.0 µΩ/Ω | 99992.79 | 99994.49 | -3.9 µΩ/Ω | 6.5 µΩ/Ω | PASS, 57.94 % of 6.8 µΩ/Ω |
| 190 kΩ | 190009.43 Ω | 190.00846 kΩ | 2.0 µΩ/Ω | 190007.905 | 190010.955 | -5.1 µΩ/Ω | 6.0 µΩ/Ω | PASS, 80.23 % of 6.3 µΩ/Ω |
| 1.0 MΩ | 999903.1 Ω | 0.999903 MΩ | 2.5 µΩ/Ω | 999888.001 | 999918.199 | -0.4 µΩ/Ω | 12.6 µΩ/Ω | PASS, 2.88 % of 12.8 µΩ/Ω |
| 1.9 MΩ | 1900021.1 Ω | 1.900011 MΩ | 3.0 µΩ/Ω | 1899992 | 1900050.2 | -5.5 µΩ/Ω | 12.3 µΩ/Ω | PASS, 43.70 % of 12.5 µΩ/Ω |
| 10 MΩ 2W | 9998310 Ω | 9.998151 MΩ | 10.0 µΩ/Ω | 9997706.1 | 9998913.9 | -15.9 µΩ/Ω | 50.4 µΩ/Ω | PASS, 31.01 % of 51.4 µΩ/Ω |
| 19 MΩ 2W | 19000418 Ω | 19.000200 MΩ | 20.0 µΩ/Ω | 18999084 | 19001752 | -11.5 µΩ/Ω | 50.2 µΩ/Ω | PASS, 21.19 % of 54.0 µΩ/Ω |
| 100 MΩ 2W | 100006340 Ω | 100.01044 MΩ | 50.0 µΩ/Ω | 99986138.7 | 100026541 | 41.0 µΩ/Ω | 152.0 µΩ/Ω | PASS, 25.63 % of 160.0 µΩ/Ω |
Table 5: Resistance gain performance, as received
Resistance is shows all good on this instrument calibration. 1.9 Ω and 190 kΩ points are close to failing, but rest is very good, still meeting 24 hours specification after 801 days since last adjustment. Highest 1 GΩ range was not verified during this calibration, because it is a manual calibration step procedure. Fluke 5720A cannot generate 1 GΩ output due to leakage limitations, so this range requires an external fixed resistance standard.
Worth to note that all measurement points are checked and recorded over multiple samples, not just recording the first reading that shows up on display. Because all measurements are automated we have a full log of each RAW data point for statistical checks and analysis if such needs arise. Below is excerpt of measurement at 10 kΩ data point from calkit log-file:
03242025-10:24:24 HWR[20]: OPER
03242025-10:24:24 HWR[20]: EXTSENSE ON
03242025-10:24:24 HWR[6]: :SENS:FUNC 'FRES'
03242025-10:24:24 HWR[6]: :SENS:FRES:DIG 9
03242025-10:24:24 HWR[6]: :SENS:FRES:RANG 1.000000e+04
03242025-10:24:24 HWR[6]: :SENS:FRES:NPLC 10.0000
03242025-10:24:34 HWR[6]: :SENS:RES:AVER:STAT OFF
03242025-10:24:34 HWR[6]: :SENS:FRES:AVER:STAT OFF
03242025-10:24:35 RDr[20]: +9.9996440E+03,OHM,0.0000E+00
03242025-10:24:35 ERD[20]: +9.9996440E+03,OHM,0.0000E+00
03242025-10:24:39 RDr[6]: +9.9996255E+03
03242025-10:24:42 RDr[6]: +9.9996209E+03
03242025-10:24:46 RDr[6]: +9.9996221E+03
03242025-10:24:49 RDr[6]: +9.9996220E+03
03242025-10:24:53 RDr[6]: +9.9996252E+03
03242025-10:24:57 RDr[6]: +9.9996232E+03
03242025-10:25:00 RDr[6]: +9.9996239E+03
03242025-10:25:04 RDr[6]: +9.9996266E+03
03242025-10:25:08 RDr[6]: +9.9996228E+03
03242025-10:25:11 RDr[6]: +9.9996235E+03
Next test is AC voltage points verification at multiple points. I’ve also included a measurement test of 10% of the lowest range on K2002, which is 220mV. This data can be handy for low signal AC signal measurements. Keithley 2002 is using AD637-based solid state RMS converter chip to provide AC voltage measurements so it is not a competition to specialized instruments like fluke 5790A, Wavetek 4920/4920M or thermal converters.
| Keithley 2002,1167961,A10/A02, Last adjustment date 22.JAN.2023. Performance verification xDevs.com Rev.3156/2980 24.MAR.2025 | ||||||||
|---|---|---|---|---|---|---|---|---|
| Procedure for all test points that verify Gain & flatness of the AC Voltage. 2-wire connection at LO and ACV is used between DMM and MFC | ||||||||
| ACV Test | DUT | Source U | Low Limit | Hi limit | Measured | 24h spec | Result, % spec | |
| 0.02 V AC+DC @ 10 Hz | 0.02003095 | 0.0400 % | 0.0199055 | 0.0200945 | 0.1547 % | 0.4325 % | PASS, 35.63 % of 4343 µV/V | |
| 0.02 V AC+DC @ 20 Hz | 0.02002929 | 0.0280 % | 0.0199079 | 0.0200921 | 0.1464 % | 0.4325 % | PASS, 33.79 % of 4334 µV/V | |
| 0.02 V AC+DC @ 50 Hz | 0.02002885 | 0.0270 % | 0.0199081 | 0.0200919 | 0.1443 % | 0.4325 % | PASS, 33.29 % of 4333 µV/V | |
| 0.02 V AC+DC @ 60 Hz | 0.02003534 | 0.0270 % | 0.0199081 | 0.0200919 | 0.1767 % | 0.4325 % | PASS, 40.78 % of 4333 µV/V | |
| 0.02 V AC+DC @ 100 Hz | 0.02002869 | 0.0270 % | 0.0199081 | 0.0200919 | 0.1434 % | 0.4325 % | PASS, 33.10 % of 4333 µV/V | |
| 0.02 V AC+DC @ 1.0 kHz | 0.02002855 | 0.0270 % | 0.0199081 | 0.0200919 | 0.1427 % | 0.4325 % | PASS, 32.94 % of 4333 µV/V | |
| 0.02 V AC+DC @ 6.25 kHz | 0.02002232 | 0.0270 % | 0.0199081 | 0.0200919 | 0.1116 % | 0.4325 % | PASS, 25.75 % of 4333 µV/V | |
| 0.02 V AC+DC @ 10.0 kHz | 0.020022 | 0.0270 % | 0.0199081 | 0.0200919 | 0.1100 % | 0.4325 % | PASS, 25.38 % of 4333 µV/V | |
| 0.02 V AC+DC @ 20.0 kHz | 0.02002135 | 0.0270 % | 0.0199081 | 0.0200919 | 0.1067 % | 0.4325 % | PASS, 24.63 % of 4333 µV/V | |
| 0.02 V AC+DC @ 50.0 kHz | 0.02002017 | 0.0370 % | 0.0199061 | 0.0200939 | 0.1008 % | 0.4325 % | PASS, 23.23 % of 4341 µV/V | |
| 0.02 V AC+DC @ 100.0 kHz | 0.02000152 | 0.0650 % | 0.0199205 | 0.0200795 | 0.0076 % | 0.3325 % | PASS, 2.24 % of 3388 µV/V | |
| 0.02 V AC+DC @ 200.0 kHz | 0.0199588 | 0.0800 % | 0.0198275 | 0.0201725 | -0.2060 % | 0.7825 % | PASS, 26.19 % of 7866 µV/V | |
| 0.02 V AC+DC @ 300.0 kHz | 0.01992973 | 0.0800 % | 0.0198275 | 0.0201725 | -0.3514 % | 0.7825 % | PASS, 44.67 % of 7866 µV/V | |
| 0.2 V AC+DC @ 10 Hz | 0.19998313 | 0.0260 % | 0.199418 | 0.200582 | -0.0084 % | 0.2650 % | PASS, 3.17 % of 2663 µV/V | |
| 0.2 V AC+DC @ 20 Hz | 0.19998855 | 0.0115 % | 0.199447 | 0.200553 | -0.0057 % | 0.2650 % | PASS, 2.16 % of 2652 µV/V | |
| 0.2 V AC+DC @ 50 Hz | 0.19999084 | 0.0105 % | 0.199899 | 0.200101 | -0.0046 % | 0.0400 % | PASS, 11.08 % of 413 µV/V | |
| 0.2 V AC+DC @ 60 Hz | 0.19998823 | 0.0105 % | 0.199899 | 0.200101 | -0.0059 % | 0.0400 % | PASS, 14.24 % of 413 µV/V | |
| 0.2 V AC+DC @ 100 Hz | 0.19999036 | 0.0105 % | 0.199899 | 0.200101 | -0.0048 % | 0.0400 % | PASS, 11.66 % of 413 µV/V | |
| 0.2 V AC+DC @ 1.0 kHz | 0.19999066 | 0.0105 % | 0.199899 | 0.200101 | -0.0047 % | 0.0400 % | PASS, 11.30 % of 413 µV/V | |
| 0.2 V AC+DC @ 6.25 kHz | 0.19999466 | 0.0105 % | 0.199889 | 0.200111 | -0.0027 % | 0.0450 % | PASS, 5.78 % of 462 µV/V | |
| 0.2 V AC+DC @ 10.0 kHz | 0.19999571 | 0.0105 % | 0.199889 | 0.200111 | -0.0021 % | 0.0450 % | PASS, 4.64 % of 462 µV/V | |
| 0.2 V AC+DC @ 20.0 kHz | 0.19999621 | 0.0105 % | 0.199889 | 0.200111 | -0.0019 % | 0.0450 % | PASS, 4.10 % of 462 µV/V | |
| 0.2 V AC+DC @ 50.0 kHz | 0.19997685 | 0.0205 % | 0.199819 | 0.200181 | -0.0116 % | 0.0700 % | PASS, 15.88 % of 729 µV/V | |
| 0.2 V AC+DC @ 100.0 kHz | 0.19980667 | 0.0485 % | 0.199273 | 0.200727 | -0.0967 % | 0.3150 % | PASS, 30.33 % of 3187 µV/V | |
| 0.2 V AC+DC @ 200.0 kHz | 0.19935048 | 0.0800 % | 0.19579 | 0.20421 | -0.3248 % | 2.0250 % | PASS, 16.03 % of 20266 µV/V | |
| 0.2 V AC+DC @ 300.0 kHz | 0.19902814 | 0.0800 % | 0.19579 | 0.20421 | -0.4859 % | 2.0250 % | PASS, 23.98 % of 20266 µV/V | |
| 0.2 V AC+DC @ 500.0 kHz | 0.19905835 | 0.1200 % | 0.19536 | 0.20464 | -0.4708 % | 2.2000 % | PASS, 21.37 % of 22033 µV/V | |
| 0.2 V AC+DC @ 1.0 MHz | 0.20066271 | 0.2600 % | 0.19508 | 0.20492 | 0.3314 % | 2.2000 % | PASS, 14.96 % of 22153 µV/V | |
| 2.0 V AC+DC @ 10 Hz | 2.0003234 | 0.0220 % | 1.99426 | 2.00574 | 0.0162 % | 0.2650 % | PASS, 6.08 % of 2659 µV/V | |
| 2.0 V AC+DC @ 20 Hz | 2.0003647 | 0.0083 % | 1.994535 | 2.005465 | 0.0182 % | 0.2650 % | PASS, 6.88 % of 2651 µV/V | |
| 2.0 V AC+DC @ 50 Hz | 2.0003607 | 0.0041 % | 1.999118 | 2.000882 | 0.0180 % | 0.0400 % | PASS, 44.86 % of 402 µV/V | |
| 2.0 V AC+DC @ 60 Hz | 2.0003633 | 0.0041 % | 1.999118 | 2.000882 | 0.0182 % | 0.0400 % | PASS, 45.19 % of 402 µV/V | |
| 2.0 V AC+DC @ 100 Hz | 2.0003288 | 0.0041 % | 1.999118 | 2.000882 | 0.0164 % | 0.0400 % | PASS, 40.90 % of 402 µV/V | |
| 2.0 V AC+DC @ 1.0 kHz | 2.000272 | 0.0041 % | 1.999118 | 2.000882 | 0.0136 % | 0.0400 % | PASS, 33.83 % of 402 µV/V | |
| 2.0 V AC+DC @ 6.25 kHz | 2.0002932 | 0.0041 % | 1.999018 | 2.000982 | 0.0147 % | 0.0450 % | PASS, 32.45 % of 452 µV/V | |
| 2.0 V AC+DC @ 10.0 kHz | 2.0003155 | 0.0041 % | 1.999018 | 2.000982 | 0.0158 % | 0.0450 % | PASS, 34.92 % of 452 µV/V | |
| 2.0 V AC+DC @ 20.0 kHz | 2.0002858 | 0.0041 % | 1.999018 | 2.000982 | 0.0143 % | 0.0450 % | PASS, 31.63 % of 452 µV/V | |
| 2.0 V AC+DC @ 50.0 kHz | 1.9999036 | 0.0070 % | 1.99846 | 2.00154 | -0.0048 % | 0.0700 % | PASS, 6.85 % of 703 µV/V | |
| 2.0 V AC+DC @ 100.0 kHz | 1.9982042 | 0.0115 % | 1.99347 | 2.00653 | -0.0898 % | 0.3150 % | PASS, 28.49 % of 3152 µV/V | |
| 2.0 V AC+DC @ 200.0 kHz | 1.9936805 | 0.0340 % | 1.95882 | 2.04118 | -0.3160 % | 2.0250 % | PASS, 15.60 % of 20253 µV/V | |
| 2.0 V AC+DC @ 300.0 kHz | 1.9906774 | 0.0340 % | 1.95882 | 2.04118 | -0.4661 % | 2.0250 % | PASS, 23.02 % of 20253 µV/V | |
| 2.0 V AC+DC @ 500.0 kHz | 1.9889176 | 0.0900 % | 1.9542 | 2.0458 | -0.5541 % | 2.2000 % | PASS, 25.17 % of 22018 µV/V | |
| 2.0 V AC+DC @ 1.0 MHz | 1.9928667 | 0.1500 % | 1.953 | 2.047 | -0.3567 % | 2.2000 % | PASS, 16.17 % of 22051 µV/V | |
| 20 V AC+DC @ 10 Hz | 19.999679 | 0.0220 % | 19.9156 | 20.0844 | -0.0016 % | 0.4000 % | PASS, 0.40 % of 4006 µV/V | |
| 20 V AC+DC @ 20 Hz | 20.00035 | 0.0083 % | 19.91835 | 20.08165 | 0.0018 % | 0.4000 % | PASS, 0.44 % of 4001 µV/V | |
| 20 V AC+DC @ 50 Hz | 20.000717 | 0.0040 % | 19.96321 | 20.03679 | 0.0036 % | 0.1800 % | PASS, 1.99 % of 1800 µV/V | |
| 20 V AC+DC @ 60 Hz | 20.000674 | 0.0040 % | 19.96321 | 20.03679 | 0.0034 % | 0.1800 % | PASS, 1.87 % of 1800 µV/V | |
| 20 V AC+DC @ 100 Hz | 20.000398 | 0.0040 % | 19.96321 | 20.03679 | 0.0020 % | 0.1800 % | PASS, 1.11 % of 1800 µV/V | |
| 20 V AC+DC @ 1.0 kHz | 19.999725 | 0.0040 % | 19.96321 | 20.03679 | -0.0014 % | 0.1800 % | PASS, 0.76 % of 1800 µV/V | |
| 20 V AC+DC @ 6.25 kHz | 19.996545 | 0.0040 % | 19.95921 | 20.04079 | -0.0173 % | 0.2000 % | PASS, 8.64 % of 2000 µV/V | |
| 20 V AC+DC @ 10.0 kHz | 19.996903 | 0.0040 % | 19.95921 | 20.04079 | -0.0155 % | 0.2000 % | PASS, 7.74 % of 2000 µV/V | |
| 20 V AC+DC @ 20.0 kHz | 19.999002 | 0.0040 % | 19.95921 | 20.04079 | -0.0050 % | 0.2000 % | PASS, 2.49 % of 2000 µV/V | |
| 20 V AC+DC @ 50.0 kHz | 20.002196 | 0.0070 % | 19.9546 | 20.0454 | 0.0110 % | 0.2200 % | PASS, 4.99 % of 2201 µV/V | |
| 20 V AC+DC @ 100.0 kHz | 19.994488 | 0.0100 % | 19.908 | 20.092 | -0.0276 % | 0.4500 % | PASS, 6.12 % of 4501 µV/V | |
| 20 V AC+DC @ 200.0 kHz | 19.971909 | 0.0280 % | 19.1444 | 20.8556 | -0.1405 % | 4.2500 % | PASS, 3.30 % of 42501 µV/V | |
| 20 V AC+DC @ 300.0 kHz | 19.971272 | 0.0280 % | 19.1444 | 20.8556 | -0.1436 % | 4.2500 % | PASS, 3.38 % of 42501 µV/V | |
| 20 V AC+DC @ 500.0 kHz | 20.027629 | 0.0900 % | 18.782 | 21.218 | 0.1381 % | 6.0000 % | PASS, 2.30 % of 60007 µV/V | |
| 20 V AC+DC @ 1.0 MHz | 20.460149 | 0.1400 % | 18.772 | 21.228 | 2.3007 % | 6.0000 % | PASS, 38.34 % of 60016 µV/V | |
| 200.0 V AC+DC @ 10 Hz | 200.03152 | 0.0220 % | 199.426 | 200.574 | 0.0158 % | 0.2650 % | PASS, 5.93 % of 2659 µV/V | |
| 200.0 V AC+DC @ 20 Hz | 200.04262 | 0.0083 % | 199.4535 | 200.5465 | 0.0213 % | 0.2650 % | PASS, 8.04 % of 2651 µV/V | |
| 200.0 V AC+DC @ 50 Hz | 200.04108 | 0.0048 % | 199.9004 | 200.0996 | 0.0205 % | 0.0450 % | PASS, 45.39 % of 453 µV/V | |
| 200.0 V AC+DC @ 60 Hz | 200.04255 | 0.0048 % | 199.9004 | 200.0996 | 0.0213 % | 0.0450 % | PASS, 47.01 % of 453 µV/V | |
| 200.0 V AC+DC @ 100 Hz | 200.03861 | 0.0048 % | 199.9004 | 200.0996 | 0.0193 % | 0.0450 % | PASS, 42.66 % of 453 µV/V | |
| 200.0 V AC+DC @ 1.0 kHz | 200.02427 | 0.0048 % | 199.9004 | 200.0996 | 0.0121 % | 0.0450 % | PASS, 26.81 % of 453 µV/V | |
| 200.0 V AC+DC @ 6.25 kHz | 200.00452 | 0.0048 % | 199.8604 | 200.1396 | 0.0023 % | 0.0650 % | PASS, 3.47 % of 652 µV/V | |
| 200.0 V AC+DC @ 10.0 kHz | 200.01371 | 0.0048 % | 199.8604 | 200.1396 | 0.0069 % | 0.0650 % | PASS, 10.52 % of 652 µV/V | |
| 200.0 V AC+DC @ 20.0 kHz | 200.03287 | 0.0048 % | 199.8604 | 200.1396 | 0.0164 % | 0.0650 % | PASS, 25.22 % of 652 µV/V | |
| 200.0 V AC+DC @ 50.0 kHz | 200.0135 | 0.0075 % | 199.815 | 200.185 | 0.0067 % | 0.0850 % | PASS, 7.91 % of 853 µV/V | |
| 200.0 V AC+DC @ 100.0 kHz | 199.85519 | 0.0133 % | 199.3435 | 200.6565 | -0.0724 % | 0.3150 % | PASS, 22.97 % of 3153 µV/V | |
| 700.0 V AC+DC @ 50 Hz | 700.3325 | 0.0079 % | 699.445 | 700.555 | 0.0475 % | 0.0714 % | PASS, 66.10 % of 719 µV/V | |
| 700.0 V AC+DC @ 60 Hz | 700.3439 | 0.0079 % | 699.445 | 700.555 | 0.0491 % | 0.0714 % | PASS, 68.37 % of 719 µV/V | |
| 700.0 V AC+DC @ 100 Hz | 700.3506 | 0.0079 % | 699.445 | 700.555 | 0.0501 % | 0.0714 % | PASS, 69.70 % of 719 µV/V | |
| 700.0 V AC+DC @ 1.0 kHz | 700.3535 | 0.0079 % | 699.445 | 700.555 | 0.0505 % | 0.0714 % | PASS, 70.28 % of 719 µV/V | |
Table 6: AC Voltage gain and flatness performance, as received
AC Voltage meets all specs quite nicely. Keithley 2002 has an AC auto-calibration function which uses internal DAC to perform self-adjustment of flatness. No external equipment is required for this procedure and it’s recommended to run any time when 2002 used for high precision AC measurements.
Next test is current. Timing of the test for higher 2A current range is important, since high currents cause small but noticeable heating of the power shunt used in Keithley 2002. As a result, warm-up time for self-heating was set at 5 minutes, after which measurement values are recorded in the dataset. This will be shown in more detail later after adjustment.
| Keithley 2002,1167961,A10/A02, Last adjustment date 22.JAN.2023. Performance verification xDevs.com Rev.3156/2980 24.MAR.2025 | ||||||||
|---|---|---|---|---|---|---|---|---|
| Procedure for all test points that verify Gain of the DC Current ACI. 2-wire connection at LO and DCI is used between DMM and MFC. | ||||||||
| DCI Test 100nA-1A | DUT | Source unc. | Low Limit | Hi limit | Measured | 24h spec | Result | |
| Zero µADC | 0.2100 nA | INFO | ||||||
| 1 µADC | 1.00010 µA | 0.162 % | 9.971306E-07 | 1.002869E-06 | 0.0100 % | 1250 µA/A | PASS, 4.89 % of 0.205 % | |
| 2 µADC | 2.00013 µA | 0.082 % | 1.997057E-06 | 2.002943E-06 | 65.0 µA/A | 650 µA/A | PASS, 6.21 % of 0.105 % | |
| -1 µADC | -0.99988 µA | 0.162 % | -1.002869E-06 | -9.971306E-07 | -0.0120 % | 1250 µA/A | PASS, 5.87 % of 0.205 % | |
| -2 µADC | -1.99989 µA | 0.082 % | -2.002943E-06 | -1.997057E-06 | -55.0 µA/A | 650 µA/A | PASS, 5.25 % of 0.105 % | |
| Zero 00 µADC | 0.3200 nA | INFO | ||||||
| 10 µADC | 10.00047 µA | 182.0 µA/A | 9.99648E-06 | 1.000352E-05 | 47.0 µA/A | 170 µA/A | PASS, 18.87 % of 249 µA/A | |
| 20 µADC | 20.00061 µA | 102.0 µA/A | 1.999576E-05 | 2.000424E-05 | 30.5 µA/A | 110 µA/A | PASS, 20.33 % of 150 µA/A | |
| -10 µADC | -9.99995 µA | 182.0 µA/A | -1.000352E-05 | -9.99648E-06 | -5.0 µA/A | 170 µA/A | PASS, 2.01 % of 249 µA/A | |
| 20 µADC | -20.00020 µA | 102.0 µA/A | -2.000424E-05 | -1.999576E-05 | 10.0 µA/A | 110 µA/A | PASS, 6.67 % of 150 µA/A | |
| Zero 000 µADC | 0.3600 nA | INFO | ||||||
| 100 µADC | 100.00175 µA | 38.0 µA/A | 9.999E-05 | 0.00010001 | 17.5 µA/A | 62 µA/A | PASS, 24.07 % of 73 µA/A | |
| 200 µADC | 200.00308 µA | 30.0 µA/A | 0.0001999828 | 0.0002000172 | 15.4 µA/A | 56 µA/A | PASS, 24.24 % of 64 µA/A | |
| -100 µADC | -100.00215 µA | 38.0 µA/A | -0.00010001 | -9.999E-05 | 21.5 µA/A | 62 µA/A | PASS, 29.57 % of 73 µA/A | |
| -200 µADC | -200.00452 µA | 30.0 µA/A | -0.0002000172 | -0.0001999828 | 22.6 µA/A | 56 µA/A | PASS, 35.57 % of 64 µA/A | |
| Zero mADC | 4.0000 nA | INFO | ||||||
| 1.0 mADC | 1.000026 mA | 26.0 µA/A | 0.000999914 | 0.001000086 | 25.9 µA/A | 60 µA/A | PASS, 39.61 % of 65 µA/A | |
| 2.0 mADC | 2.000047 mA | 24.0 µA/A | 0.001999842 | 0.002000158 | 23.5 µA/A | 55 µA/A | PASS, 39.16 % of 60 µA/A | |
| -1.0 mADC | -1.000031 mA | 26.0 µA/A | -0.001000086 | -0.000999914 | 31.2 µA/A | 60 µA/A | PASS, 47.71 % of 65 µA/A | |
| -2.0 mADC | -2.000063 mA | 24.0 µA/A | -0.002000158 | -0.001999842 | 31.4 µA/A | 55 µA/A | PASS, 52.33 % of 60 µA/A | |
| Zero 00 mADC | 41.0000 nA | INFO | ||||||
| 10 mADC | 10.001130 mA | 26.0 µA/A | 0.00999914 | 0.01000086 | 113.0 µA/A | 60 µA/A | FAIL 172.81 % | |
| 20 mADC | 20.002244 mA | 24.0 µA/A | 0.01999842 | 0.02000158 | 112.2 µA/A | 55 µA/A | FAIL 186.97 % | |
| -10 mADC | -10.001211 mA | 26.0 µA/A | -0.01000086 | -0.00999914 | 121.1 µA/A | 60 µA/A | FAIL 185.19 % | |
| -20 mADC | -20.002417 mA | 24.0 µA/A | -0.02000158 | -0.01999842 | 120.9 µA/A | 55 µA/A | FAIL 201.39 % | |
| Zero 000 mADC | 430.0000 nA | INFO | ||||||
| 100 mADC | 100.00613 mA | 27.5 µA/A | 0.09998875 | 0.1000112 | 61.3 µA/A | 85 µA/A | PASS, 68.62 % of 89 µA/A | |
| 200 mADC | 200.01089 mA | 26.2 µA/A | 0.1999788 | 0.2000212 | 54.4 µA/A | 80 µA/A | PASS, 64.67 % of 84 µA/A | |
| -100 mADC | -100.00695 mA | 27.5 µA/A | -0.1000113 | -0.09998875 | 69.5 µA/A | 85 µA/A | PASS, 77.79 % of 89 µA/A | |
| -200 mADC | -200.01348 mA | 26.2 µA/A | -0.2000213 | -0.1999787 | 67.4 µA/A | 80 µA/A | PASS?, 80.05 % of 84 µA/A | |
| Zero ADC | 4.10000 µA | INFO | ||||||
| 2 ADC | 1.9998011 A | 43.0 µA/A | 1.999204 | 2.000796 | -99.5 µA/A | 355 µA/A | PASS, 27.81 % of 358 µA/A | |
| -2 ADC | -1.9997494 A | 43.0 µA/A | -2.000796 | -1.999204 | -125.3 µA/A | 355 µA/A | PASS, 35.04 % of 358 µA/A | |
| -1 ADC | -1.0003384 A | 46.0 µA/A | -1.000406 | -0.999594 | 338.4 µA/A | 360 µA/A | PASS?, 93.24 % of 363 µA/A | |
| 1 ADC | 1.0003560 A | 46.0 µA/A | 0.999594 | 1.000406 | 356.0 µA/A | 360 µA/A | PASS?, 98.09 % of 363 µA/A | |
Table 7: DC Current gain performance, as received
All DC Current ranges except 20mA and 2A meet specifications with decent margin. 1A points in both polarities on 2A range is in the gray zone, barely making it. Next test – AC Current, for which specifications of Model 2002 are quite relaxed, so they are easier to pass with great margins.
| Keithley 2002,1167961,A10/A02, Last adjustment date 22.JAN.2023. Performance verification xDevs.com Rev.3156/2980 24.MAR.2025 | ||||||||
|---|---|---|---|---|---|---|---|---|
| Procedure for all test points that verify Gain of the AC Current ACI. 2-wire connection at LO and ACI is used between DMM and MFC. | ||||||||
| ACI Test 200µA-2A | DUT | Source unc. | Low Limit | Hi limit | Measured | 24h spec | Result, % spec | |
| 50 µA AC @ 50 Hz | 4.99413E-05 | 0.0165 % | 4.98017275e-05 | 5.01982725e-05 | -0.1174 % | 0.380 % | PASS, 15.43 % of 7607 µA/A | |
| 100 µA AC @ 50 Hz | 9.99663E-05 | 0.0165 % | 9.9618455e-05 | 0.000100381545 | -0.0337 % | 0.365 % | PASS, 4.61 % of 7307 µA/A | |
| 200 µA AC @ 50 Hz | 0.0001999118 | 0.0165 % | 0.00019925191 | 0.00020074809 | -0.0441 % | 0.357 % | PASS, 6.16 % of 7158 µA/A | |
| 1.0 mA AC @ 50 Hz | 0.000999596 | 0.0138 % | 0.00099671182 | 0.00100328818 | -0.0404 % | 0.315 % | PASS, 6.41 % of 6306 µA/A | |
| 2.0 mA AC @ 50 Hz | 0.001999628 | 0.0138 % | 0.00199357364 | 0.00200642636 | -0.0186 % | 0.307 % | PASS, 3.03 % of 6156 µA/A | |
| 10 mA AC @ 50 Hz | 0.009997353 | 0.0138 % | 0.0099671182 | 0.0100328818 | -0.0265 % | 0.315 % | PASS, 4.20 % of 6306 µA/A | |
| 20 mA AC @ 50 Hz | 0.01999921 | 0.0138 % | 0.0199357364 | 0.0200642636 | -0.0039 % | 0.308 % | PASS, 0.64 % of 6156 µA/A | |
| 100 mA AC @ 50 Hz | 0.1000209 | 0.0134 % | 0.099671636 | 0.100328364 | 0.0209 % | 0.315 % | PASS, 3.31 % of 6306 µA/A | |
| 200 mA AC @ 50 Hz | 0.2000852 | 0.0134 % | 0.199358272 | 0.200641728 | 0.0426 % | 0.307 % | PASS, 6.92 % of 6156 µA/A | |
| 1.0 A AC @ 50 Hz | 1.000951 | 0.0308 % | 0.99604182 | 1.00395818 | 0.0951 % | 0.365 % | PASS, 12.99 % of 7326 µA/A | |
| 2.0 A AC @ 50 Hz | 2.001996 | 0.0308 % | 1.99223364 | 2.00776636 | 0.0998 % | 0.358 % | PASS, 13.91 % of 7177 µA/A | |
| 50 µA AC @ 60 Hz | 4.99637E-05 | 0.0165 % | 4.98767275e-05 | 5.01232725e-05 | -0.0726 % | 0.230 % | PASS, 15.74 % of 4612 µA/A | |
| 100 µA AC @ 60 Hz | 9.9976E-05 | 0.0165 % | 9.9768455e-05 | 0.000100231545 | -0.0240 % | 0.215 % | PASS, 5.56 % of 4313 µA/A | |
| 200 µA AC @ 60 Hz | 0.0001999246 | 0.0165 % | 0.00019955191 | 0.00020044809 | -0.0377 % | 0.208 % | PASS, 9.06 % of 4163 µA/A | |
| 1.0 mA AC @ 60 Hz | 0.0009996635 | 0.0138 % | 0.00099821182 | 0.00100178818 | -0.0337 % | 0.165 % | PASS, 10.16 % of 3312 µA/A | |
| 2.0 mA AC @ 60 Hz | 0.001999762 | 0.0138 % | 0.00199657364 | 0.00200342636 | -0.0119 % | 0.157 % | PASS, 3.76 % of 3162 µA/A | |
| 10 mA AC @ 60 Hz | 0.009998196 | 0.0138 % | 0.0099821182 | 0.0100178818 | -0.0180 % | 0.165 % | PASS, 5.45 % of 3312 µA/A | |
| 20 mA AC @ 60 Hz | 0.02000082 | 0.0138 % | 0.0199657364 | 0.0200342636 | 0.0041 % | 0.158 % | PASS, 1.30 % of 3162 µA/A | |
| 100 mA AC @ 60 Hz | 0.1000287 | 0.0134 % | 0.099821636 | 0.100178364 | 0.0287 % | 0.165 % | PASS, 8.66 % of 3311 µA/A | |
| 200 mA AC @ 60 Hz | 0.2001004 | 0.0134 % | 0.199658272 | 0.200341728 | 0.0502 % | 0.157 % | PASS, 15.88 % of 3161 µA/A | |
| 1.0 A AC @ 60 Hz | 1.001021 | 0.0308 % | 0.99754182 | 1.00245818 | 0.1021 % | 0.215 % | PASS, 23.50 % of 4344 µA/A | |
| 2.0 A AC @ 60 Hz | 2.002141 | 0.0308 % | 1.99523364 | 2.00476636 | 0.1070 % | 0.208 % | PASS, 25.51 % of 4196 µA/A | |
| 50 µA AC @ 1.0 kHz | 4.99387E-05 | 0.0165 % | 4.97267275e-05 | 5.02732725e-05 | -0.1226 % | 0.530 % | PASS, 11.56 % of 10605 µA/A | |
| 100 µA AC @ 1.0 kHz | 9.99673E-05 | 0.0165 % | 9.9468455e-05 | 0.000100531545 | -0.0327 % | 0.515 % | PASS, 3.17 % of 10305 µA/A | |
| 200 µA AC @ 1.0 kHz | 0.0001999242 | 0.0165 % | 0.00019895191 | 0.00020104809 | -0.0379 % | 0.507 % | PASS, 3.73 % of 10155 µA/A | |
| 1.0 mA AC @ 1.0 kHz | 0.0009997139 | 0.0138 % | 0.00099851182 | 0.00100148818 | -0.0286 % | 0.135 % | PASS, 10.54 % of 2714 µA/A | |
| 2.0 mA AC @ 1.0 kHz | 0.001999858 | 0.0138 % | 0.00199717364 | 0.00200282636 | -0.0071 % | 0.127 % | PASS, 2.78 % of 2565 µA/A | |
| 10 mA AC @ 1.0 kHz | 0.009999381 | 0.0138 % | 0.0099851182 | 0.0100148818 | -0.0062 % | 0.135 % | PASS, 2.28 % of 2714 µA/A | |
| 20 mA AC @ 1.0 kHz | 0.02000332 | 0.0138 % | 0.0199717364 | 0.0200282636 | 0.0166 % | 0.128 % | PASS, 6.47 % of 2565 µA/A | |
| 100 mA AC @ 1.0 kHz | 0.1000427 | 0.0134 % | 0.099821636 | 0.100178364 | 0.0427 % | 0.165 % | PASS, 12.89 % of 3311 µA/A | |
| 200 mA AC @ 1.0 kHz | 0.2001278 | 0.0134 % | 0.199658272 | 0.200341728 | 0.0639 % | 0.157 % | PASS, 20.22 % of 3161 µA/A | |
| 1.0 A AC @ 1.0 kHz | 1.001156 | 0.0308 % | 0.99504182 | 1.00495818 | 0.1156 % | 0.465 % | PASS, 12.40 % of 9320 µA/A | |
| 2.0 A AC @ 1.0 kHz | 2.00245 | 0.0308 % | 1.99023364 | 2.00976636 | 0.1225 % | 0.457 % | PASS, 13.36 % of 9171 µA/A | |
| 50 µA AC @ 10.0 kHz | 4.98372E-05 | 0.1400 % | 4.974e-05 | 5.026e-05 | -0.3256 % | 0.380 % | PASS, 40.20 % of 8099 µA/A | |
| 100 µA AC @ 10.0 kHz | 9.97799E-05 | 0.1400 % | 9.9495e-05 | 0.000100505 | -0.2201 % | 0.365 % | PASS, 28.15 % of 7819 µA/A | |
| 200 µA AC @ 10.0 kHz | 0.0001995493 | 0.1400 % | 0.000199005 | 0.000200995 | -0.2254 % | 0.357 % | PASS, 29.35 % of 7679 µA/A | |
| 1.0 mA AC @ 10.0 kHz | 0.000999991 | 0.1400 % | 0.00099595 | 0.00100405 | -0.0009 % | 0.265 % | PASS, 0.15 % of 5994 µA/A | |
| 2.0 mA AC @ 10.0 kHz | 0.002000168 | 0.1400 % | 0.00199205 | 0.00200795 | 0.0084 % | 0.257 % | PASS, 1.43 % of 5862 µA/A | |
| 10 mA AC @ 10.0 kHz | 0.01000163 | 0.1300 % | 0.0099605 | 0.0100395 | 0.0163 % | 0.265 % | PASS, 2.76 % of 5903 µA/A | |
| 20 mA AC @ 10.0 kHz | 0.02000505 | 0.1300 % | 0.0199225 | 0.0200775 | 0.0252 % | 0.258 % | PASS, 4.38 % of 5769 µA/A | |
| 100 mA AC @ 10.0 kHz | 0.1001151 | 0.1100 % | 0.099375 | 0.100625 | 0.1151 % | 0.515 % | PASS, 10.93 % of 10532 µA/A | |
| 200 mA AC @ 10.0 kHz | 0.2002475 | 0.1100 % | 0.198765 | 0.201235 | 0.1238 % | 0.507 % | PASS, 11.92 % of 10386 µA/A | |
| 1.0 A AC @ 10.0 kHz | 1.001476 | 0.6100 % | 0.97875 | 1.02125 | 0.1476 % | 1.515 % | PASS, 4.52 % of 32664 µA/A | |
| 2.0 A AC @ 10.0 kHz | 2.003674 | 0.6100 % | 1.95765 | 2.04235 | 0.1837 % | 1.507 % | PASS, 5.65 % of 32525 µA/A | |
Table 8: AC Current gain and flatness performance, as received
No problems were observed on either of the range or frequency here. Additional functions, such as frequency, temperature, in-circuit current and scanner card calibration were not tested. Now the initial performance test and calibration for the meter prior to adjustments is concluded. Number of ranges and points were detected outside of 24-hour specification as expected due to old adjustment more than 800 days ago. And now it is time to proceed with new round of adjustments per Keithley’s service manual and re-calibrate all the same points.
Keithley 2002 calibration results as returned, March 28 2025
List of verification and reference equipment used related to this calibration and adjustment is shown in table below. It is essentially the same equipment as used earlier in but with fresh verification against laboratory reference standards and 3458A. Calibrator was extensively tested prior to adjustment of Keithley 2002. This was a large project on it’s own and will be highlighted in future articles in better detail if there is such interest from readers. For now just some information about DC Voltage and resistance functions is persented from past data few years back.
Image 9: DC Voltage specifications for Fluke 5720A
Stability and correct operation of 5720A is evaluated periodically, usually with interval less than 30 days between points. This is done automatically with reference 3458A and spot intercomparisons to fixed standards.
Image 10: Stability of Fluke 5720A DC Voltage function, against 24 hour k=2 spec
At first glance graph does not look so good, but actually it is very impressive if we dig deeper. Vertical axis show percentage of the tight 24 hour 95% Fluke 5720A specification. To determine absolute shift one you need multiply published absolute accuracy specification to percent value from the plot. For example base range 11V maximum deviation math shown below.
U11VDC = 2.75 ppm * 50% = 1.375 ppm.
Even worst range, which is passively divided 220mV offers stability better than 4.5 ppm over term more than a year, thanks to proper support with external standards and good calibrator care. In fact this confirms the widely known experience from calibration labs and previous publications, showing these instruments rather conservatively specified and offering much better performance. Especially with help of modern metrology software and historical statistic analysis and some scripting.
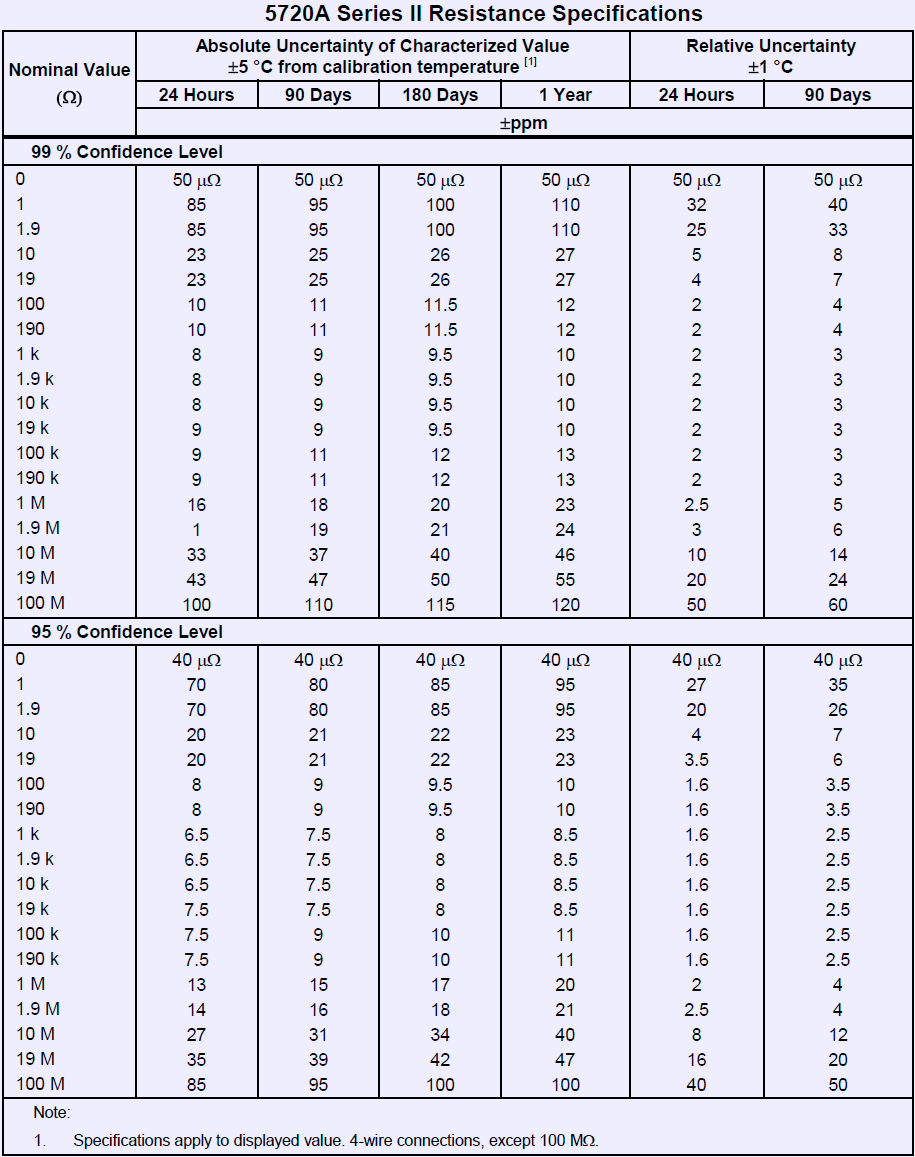
Image 11: Resistance output specifications for Fluke 5720A
Next test is resistance stability for every resistance output available from Fluke 5720A.
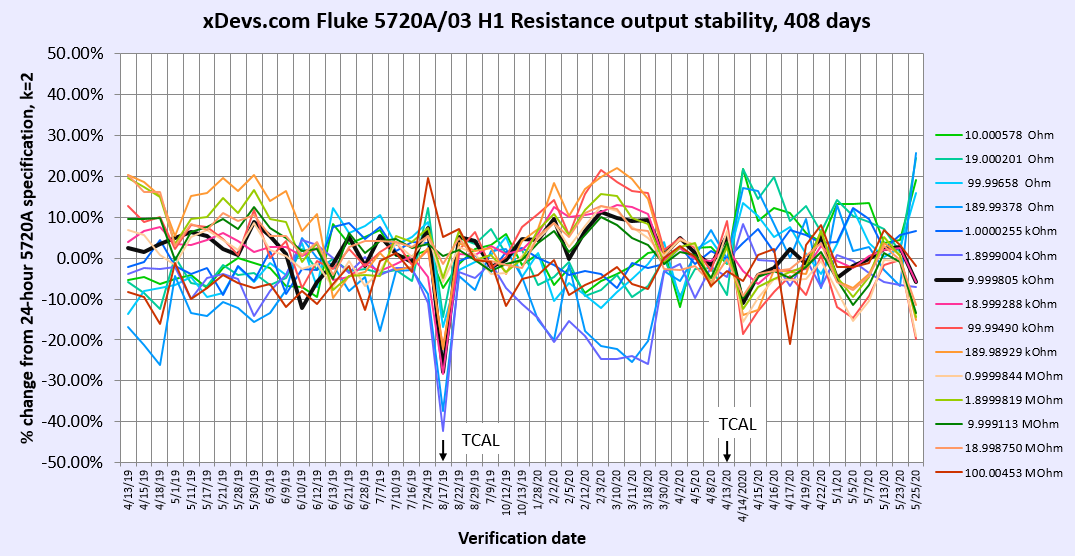
Image 12: Stability of Fluke 5720A resistance function, against 24 hour k=2 spec
Full factory low-level adjustment procedure was performed on this Keithley 2002 to bring it within best possible accuracy on all functions and ranges. Calibration adjustment procedure was performed using the same calibrator with remote GPIB control to automate both instruments. Low level adjustment procedure can be only done with GPIB remote control, while user level comprehensive calibration adjustment can be performed by an operator from the front panel. Now to the actual calibration results after adjustments. Same procedures and calibration settings with minor bug fixes were used before in previous adjustment cycle 2 years ago.
| Keithley 2002,1167961,A10/A02, Last adjustment date 27.MAR.2025. Performance verification xDevs.com Rev.3170/3158 28.MAR.2025 | ||||||||
|---|---|---|---|---|---|---|---|---|
| DC zero test procedure for all test points that verify offset of the DCV function. 4-wire copper short at DMM | ||||||||
| Test Description | Zero Value | DUT | Source U | Lower Limit | Upper Limit | DUT Spec | Test Status | |
| Short 0 mVDC | 0.000 | -1.10 µV | 1.4 µV | -2.6 µV | 2.6 µV | 1.2 µV | PASS | |
| Short 0.0 VDC | 0.000 | -1.03 µV | 1.4 µV | -5.4 µV | 5.4 µV | 4 µV | PASS | |
| Short 00.0 VDC | 0.000 | -0.90 µV | 1.4 µV | -81.4 µV | 81.4 µV | 80 µV | PASS | |
| Short 000.0 VDC | 0.000 | -11 µV | 1.4 µV | -601.4 µV | 601.4 µV | 0.6 mV | PASS | |
| Short 0000.0 VDC | 0.000 | -10 µV | 1.4 µV | -6001.4 µV | 6001.4 µV | 6 mV | PASS | |
Table 11: DC Zero offset performance, as adjusted and returned
Below are Keithley’s specifications for DC Voltage that we verify performance against. Check ranges and interval under calibration is marked in blue.
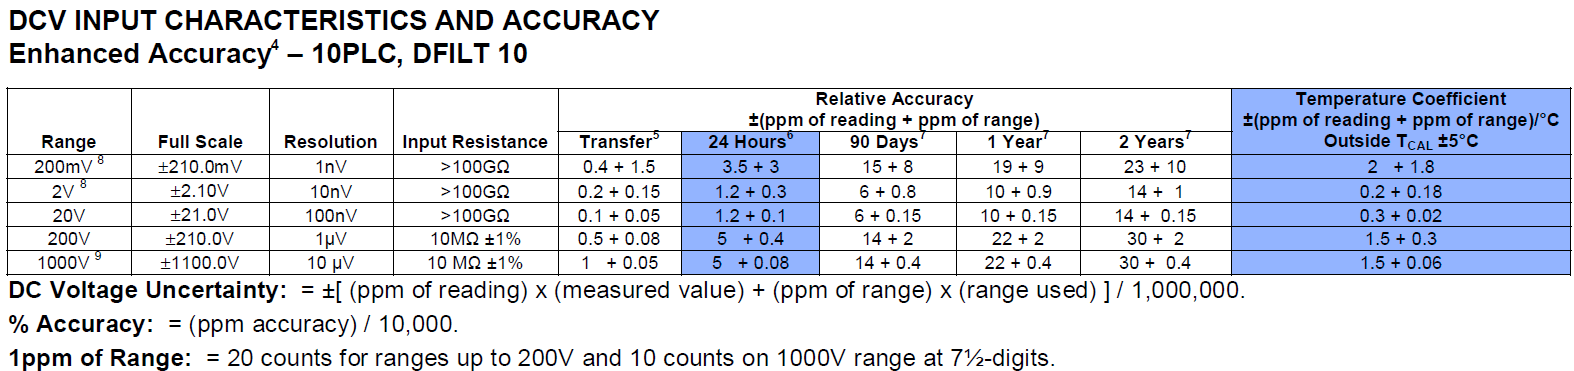
Image 15: Tested DC Voltage specifications marked in blue
All ranges zero offset for DC Voltage was well under 5% of expected allowed error, no problems here. Next step is verify gain, per procedure outlined in the calibration manual from the manufacturer. As a bonus I’ve added some additional points, especially on main 20 V range to take a quick look on DC voltage linearity performance.
| Keithley 2002,1167961,A10/A02, Last adjustment date 27.MAR.2025. Performance verification xDevs.com Rev.3170/3158 28.MAR.2025 | ||||||||
|---|---|---|---|---|---|---|---|---|
| DCV Test 0.1V-1000V | DUT | Source U | Low Limit | Hi limit | Measured | 24h spec | Result | |
| 0.02 VDC (0.20 Range) | 0.020000075 | 22.5 µV/V | 0.01999888 | 0.02000112 | 3.7 µV/V | 33.5 µV/V | PASS 9.29 % | |
| 0.1 VDC (0.20 Range) | 0.10000037 | 9.5 µV/V | 0.0999981 | 0.1000019 | 3.7 µV/V | 9.5 µV/V | PASS 27.47 % | |
| 0.2 VDC (0.20 Range) | 0.20000072 | 4.5 µV/V | 0.1999978 | 0.2000022 | 3.6 µV/V | 6.5 µV/V | PASS 45.73 % | |
| -0.02 VDC (0.20 Range) | -0.020000118 | 22.5 µV/V | -0.02000112 | -0.01999888 | 5.9 µV/V | 33.5 µV/V | PASS 14.62 % | |
| -0.1 VDC (0.20 Range) | -0.10000024 | 9.5 µV/V | -0.1000019 | -0.0999981 | 2.4 µV/V | 9.5 µV/V | PASS 18.16 % | |
| -0.2 VDC (0.20 Range) | -0.20000042 | 4.5 µV/V | -0.2000022 | -0.1999978 | 2.1 µV/V | 6.5 µV/V | PASS 26.75 % | |
| 0.2 VDC (2 Range) | 0.20000083 | 6.0 µV/V | 0.19999796 | 0.20000204 | 4.1 µV/V | 4.2 µV/V | PASS 56.66 % | |
| 1.0 VDC (2 Range) | 1.0000002 | 3.7 µV/V | 0.9999945 | 1.0000055 | 0.2 µV/V | 1.8 µV/V | PASS 5.59 % | |
| 1.9 VDC (2 Range) | 1.8999995 | 3.4 µV/V | 1.8999907 | 1.9000093 | -0.3 µV/V | 1.5 µV/V | PASS 7.41 % | |
| 2.0 VDC (2 Range) | 1.9999996 | 3.4 µV/V | 1.9999903 | 2.0000097 | -0.2 µV/V | 1.5 µV/V | PASS 4.77 % | |
| -0.2 VDC (2 Range) | -0.20000093 | 6.0 µV/V | -0.20000204 | -0.19999796 | 4.6 µV/V | 4.2 µV/V | PASS 63.49 % | |
| -1.0 VDC (2 Range) | -1.0000023 | 3.7 µV/V | -1.0000055 | -0.9999945 | 2.3 µV/V | 1.8 µV/V | PASS 55.90 % | |
| -1.9 VDC (2 Range) | -1.9000048 | 3.4 µV/V | -1.9000093 | -1.8999907 | 2.5 µV/V | 1.5 µV/V | PASS 68.23 % | |
| -2.0 VDC (2 Range) | -2.0000064 | 3.4 µV/V | -2.0000097 | -1.9999903 | 3.2 µV/V | 1.5 µV/V | PASS? 87.05 % | |
| 1.0 VDC (20 Range) | 1.0000002 | 6.0 µV/V | 0.9999908 | 1.0000092 | 0.2 µV/V | 3.2 µV/V | PASS 2.94 % | |
| 2 VDC (20 Range) | 1.9999981 | 4.0 µV/V | 1.9999876 | 2.0000124 | -0.9 µV/V | 2.2 µV/V | PASS 20.81 % | |
| 3 VDC (20 Range) | 2.9999961 | 3.3 µV/V | 2.9999844 | 3.0000156 | -1.3 µV/V | 1.9 µV/V | PASS 34.05 % | |
| 4 VDC (20 Range) | 3.9999954 | 3.0 µV/V | 3.9999812 | 4.0000188 | -1.2 µV/V | 1.7 µV/V | PASS 43.81 % | |
| 5 VDC (20 Range) | 4.9999943 | 2.8 µV/V | 4.999978 | 5.000022 | -1.1 µV/V | 1.6 µV/V | PASS 35.35 % | |
| 6 VDC (20 Range) | 5.9999933 | 2.7 µV/V | 5.9999748 | 6.0000252 | -1.1 µV/V | 1.5 µV/V | PASS 36.37 % | |
| 7 VDC (20 Range) | 6.9999929 | 2.6 µV/V | 6.9999716 | 7.0000284 | -1.0 µV/V | 1.5 µV/V | PASS 34.17 % | |
| 8 VDC (20 Range) | 7.9999915 | 2.5 µV/V | 7.9999684 | 8.0000316 | -1.1 µV/V | 1.5 µV/V | PASS 36.76 % | |
| 9 VDC (20 Range) | 8.9999925 | 2.4 µV/V | 8.9999652 | 9.0000348 | -0.8 µV/V | 1.4 µV/V | PASS 29.51 % | |
| 10.0 VDC (20 Range) | 9.9999918 | 2.4 µV/V | 9.999962 | 10.000038 | -0.8 µV/V | 1.4 µV/V | PASS 29.51 % | |
| 11 VDC (20 Range) | 10.99999 | 2.4 µV/V | 10.999959 | 11.000041 | -0.9 µV/V | 1.4 µV/V | PASS 32.58 % | |
| 12 VDC (20 Range) | 11.999989 | 2.3 µV/V | 11.999956 | 12.000044 | -0.9 µV/V | 1.4 µV/V | PASS 34.86 % | |
| 13 VDC (20 Range) | 12.999987 | 2.3 µV/V | 12.999952 | 13.000048 | -1.0 µV/V | 1.4 µV/V | PASS 36.77 % | |
| 14 VDC (20 Range) | 13.999985 | 2.3 µV/V | 13.999949 | 14.000051 | -1.0 µV/V | 1.3 µV/V | PASS 39.55 % | |
| 15 VDC (20 Range) | 14.999985 | 2.3 µV/V | 14.999946 | 15.000054 | -1.0 µV/V | 1.3 µV/V | PASS 38.74 % | |
| 16 VDC (20 Range) | 15.999985 | 2.2 µV/V | 15.999943 | 16.000057 | -0.9 µV/V | 1.3 µV/V | PASS 35.90 % | |
| 17 VDC (20 Range) | 16.999984 | 2.2 µV/V | 16.99994 | 17.00006 | -0.9 µV/V | 1.3 µV/V | PASS 36.22 % | |
| 18 VDC (20 Range) | 17.999988 | 2.2 µV/V | 17.999936 | 18.000064 | -0.7 µV/V | 1.3 µV/V | PASS 26.07 % | |
| 19.0 VDC (20 Range) | 18.999984 | 2.2 µV/V | 18.999933 | 19.000067 | -0.9 µV/V | 1.3 µV/V | PASS 33.42 % | |
| 20.0 VDC (20 Range) | 19.999984 | 2.2 µV/V | 19.99993 | 20.00007 | -0.8 µV/V | 1.3 µV/V | PASS 31.31 % | |
| -1.0 VDC (20 Range) | -1.0000012 | 6.0 µV/V | -1.0000092 | -0.9999908 | 1.2 µV/V | 3.2 µV/V | PASS 17.65 % | |
| -2 VDC (20 Range) | -2.0000028 | 4.0 µV/V | -2.0000124 | -1.9999876 | 1.4 µV/V | 2.2 µV/V | PASS 30.67 % | |
| -3 VDC (20 Range) | -3.0000031 | 3.3 µV/V | -3.0000156 | -2.9999844 | 1.0 µV/V | 1.9 µV/V | PASS 27.07 % | |
| -4 VDC (20 Range) | -4.0000041 | 3.0 µV/V | -4.0000188 | -3.9999812 | 1.0 µV/V | 1.7 µV/V | PASS 39.05 % | |
| -5 VDC (20 Range) | -5.0000044 | 2.8 µV/V | -5.000022 | -4.999978 | 0.9 µV/V | 1.6 µV/V | PASS 27.29 % | |
| -6 VDC (20 Range) | -6.0000055 | 2.7 µV/V | -6.0000252 | -5.9999748 | 0.9 µV/V | 1.5 µV/V | PASS 29.86 % | |
| -7 VDC (20 Range) | -7.0000061 | 2.6 µV/V | -7.0000284 | -6.9999716 | 0.9 µV/V | 1.5 µV/V | PASS 29.36 % | |
| -8 VDC (20 Range) | -8.000006 | 2.5 µV/V | -8.0000316 | -7.9999684 | 0.8 µV/V | 1.5 µV/V | PASS 25.95 % | |
| -9 VDC (20 Range) | -9.0000081 | 2.4 µV/V | -9.0000348 | -8.9999652 | 0.9 µV/V | 1.4 µV/V | PASS 31.87 % | |
| -10.0 VDC (20 Range) | -10.000008 | 2.4 µV/V | -10.000038 | -9.999962 | 0.8 µV/V | 1.4 µV/V | PASS 30.59 % | |
| -11 VDC (20 Range) | -11.00001 | 2.4 µV/V | -11.000041 | -10.999959 | 0.9 µV/V | 1.4 µV/V | PASS 33.91 % | |
| -12 VDC (20 Range) | -12.00001 | 2.3 µV/V | -12.000044 | -11.999956 | 0.8 µV/V | 1.4 µV/V | PASS 29.31 % | |
| -13 VDC (20 Range) | -13.000011 | 2.3 µV/V | -13.000048 | -12.999952 | 0.9 µV/V | 1.4 µV/V | PASS 32.18 % | |
| -14 VDC (20 Range) | -14.00001 | 2.3 µV/V | -14.000051 | -13.999949 | 0.7 µV/V | 1.3 µV/V | PASS 27.44 % | |
| -15 VDC (20 Range) | -15.00001 | 2.3 µV/V | -15.000054 | -14.999946 | 0.6 µV/V | 1.3 µV/V | PASS 24.56 % | |
| -16 VDC (20 Range) | -16.000013 | 2.2 µV/V | -16.000057 | -15.999943 | 0.8 µV/V | 1.3 µV/V | PASS 31.83 % | |
| -17 VDC (20 Range) | -17.000017 | 2.2 µV/V | -17.000203 | -16.999797 | 1.0 µV/V | 1.3 µV/V | PASS 10.04 % | |
| -18 VDC (20 Range) | -18.000015 | 2.2 µV/V | -18.000064 | -17.999936 | 0.9 µV/V | 1.3 µV/V | PASS 33.40 % | |
| -19.0 VDC (20 Range) | -19.000014 | 2.2 µV/V | -19.000067 | -18.999933 | 0.7 µV/V | 1.3 µV/V | PASS 27.68 % | |
| -20.0 VDC (20 Range) | -20.000017 | 2.2 µV/V | -20.00007 | -19.99993 | 0.8 µV/V | 1.3 µV/V | PASS 32.48 % | |
| 10 VDC (200 Range) | 10.000016 | 6.5 µV/V | 9.999805 | 10.000195 | 1.6 µV/V | 13.0 µV/V | PASS 11.01 % | |
| 100 VDC (200 Range) | 99.999994 | 2.9 µV/V | 99.99913 | 100.00087 | -0.1 µV/V | 5.8 µV/V | PASS 0.93 % | |
| 200 VDC (200 Range) | 199.99991 | 2.7 µV/V | 199.99838 | 200.00162 | -0.5 µV/V | 5.4 µV/V | PASS 7.54 % | |
| -10 VDC (200 Range) | -10.000009 | 6.5 µV/V | -10.000195 | -9.999805 | 0.9 µV/V | 13.0 µV/V | PASS 6.19 % | |
| -100 VDC (200 Range) | -100.00026 | 2.9 µV/V | -100.00087 | -99.99913 | 2.6 µV/V | 5.8 µV/V | PASS 40.87 % | |
| -200 VDC (200 Range) | -200.00043 | 2.7 µV/V | -200.00162 | -199.99838 | 2.1 µV/V | 5.4 µV/V | PASS 35.45 % | |
| 100 VDC (1000 Range) | 99.99994 | 7.0 µV/V | 99.99872 | 100.00128 | -0.6 µV/V | 5.8 µV/V | PASS 6.60 % | |
| 200 VDC (1000 Range) | 199.99982 | 5.0 µV/V | 199.99792 | 200.00208 | -0.9 µV/V | 5.4 µV/V | PASS 12.23 % | |
| 1000 VDC (1000 Range) | 1000.0042 | 3.4 µV/V | 999.98152 | 1000.0185 | 4.2 µV/V | 5.1 µV/V | PASS 39.67 % | |
| -100 VDC (1000 Range) | -100.00016 | 7.0 µV/V | -100.00128 | -99.99872 | 1.6 µV/V | 5.8 µV/V | PASS 17.60 % | |
| -200 VDC (1000 Range) | -200.00017 | 5.0 µV/V | -200.00208 | -199.99792 | 0.8 µV/V | 5.4 µV/V | PASS 11.55 % | |
| -1000 VDC (1000 Range) | -1000.0064 | 3.4 µV/V | -1000.0185 | -999.98152 | 6.4 µV/V | 5.1 µV/V | PASS 60.59 % | |
Table 12: DC Gain performance, as adjusted and returned
Now all ranges and functions are in solid green after adjustment, with worst deviation at negative 2V point on 2V range (87% of the combined 24 hour specification). Base 20 V range points are all demonstrating excellent deviation around 1 ppm, compared to Keithley 2002 specification ±3.2 to 1.3 ppm.
Below are Keithley’s specifications for resistance that we verify performance against. Temperature coefficient of 1 GΩ range was not tested. I don’t think that Keithley 2002 is typically used much on this range, since it is typically in the realm of electrometers and special high resistance equipment. Best ranges of 2002 are 2 kΩ and 20 kΩ thanks to high stability Vishay BMF resistors used internally for those ranges.
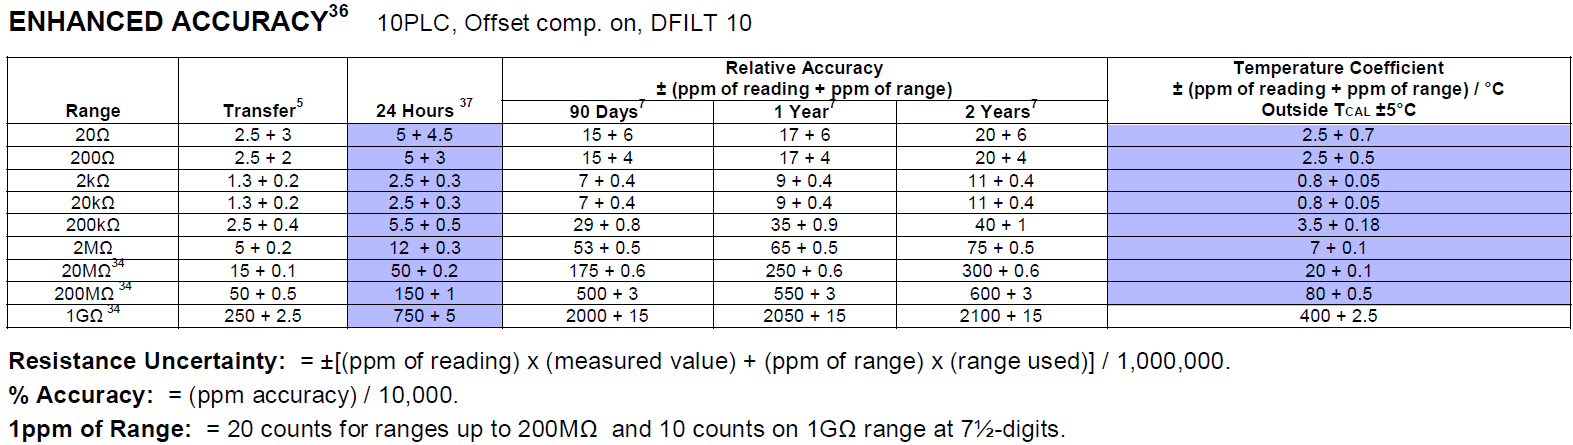
Image 16: Tested Resistance specifications marked in blue
1 GΩ resistance range is verified by using external Ohm-Labs Inc. fixed standard, calibrated by Measurements International at 1.000037 GΩ with uncertainty 9 ppm.
| Keithley 2002,1167961,A10/A02, Last adjustment date 27.MAR.2025. Performance verification xDevs.com Rev.3170/3158 28.MAR.2025 | |||||||
|---|---|---|---|---|---|---|---|
| OHM ZERO 4-wire FRONT | Maximum specification | Low Limit | Hi limit | DUT Measured | Result | ||
| 20 Ω Range (4w FRONT) | 5E-05 Ω | -5e-05 | 5e-05 | 0.0000291 Ω | PASS | ||
| 200 Ω Range (4w FRONT) | 5E-05 Ω | -5e-05 | 5e-05 | 0.0000030 Ω | PASS | ||
| 2 kΩ Range (4w FRONT) | 0.0005 Ω | -0.0005 | 0.0005 | 0.0000100 Ω | PASS | ||
| 20 kΩ Range (4w FRONT) | 0.005 Ω | -0.005 | 0.005 | 0.0002000 Ω | PASS | ||
| 200 kΩ Range (4w FRONT) | 0.05 Ω | -0.05 | 0.05 | -0.0023000 Ω | PASS | ||
| OHM ZERO 2-wire FRONT | Maximum specification | Low Limit | Hi limit | DUT Measured | Result | ||
| 20 Ω Range (2w FRONT) | 0.5 Ω | -0.5 | 0.5 | 0.0003587 Ω | PASS | ||
| 200 Ω Range (2w FRONT) | 0.5 Ω | -0.5 | 0.5 | 0.0004680 Ω | PASS | ||
| 2 kΩ Range (2w FRONT) | 0.5 Ω | -0.5 | 0.5 | 0.0002500 Ω | PASS | ||
| 20 kΩ Range (2w FRONT) | 0.5 Ω | -0.5 | 0.5 | -0.0006000 Ω | PASS | ||
| 200 kΩ Range (2w FRONT) | 0.5 Ω | -0.5 | 0.5 | 0.0120000 Ω | PASS | ||
| 2 MΩ Range (2w FRONT) | 5 Ω | -5.0 | 5.0 | 0.0200000 Ω | PASS | ||
| 20 MΩ Range (2w FRONT) | 5 Ω | -5.0 | 5.0 | 0.1000000 Ω | PASS | ||
| 200 MΩ Range (2w FRONT) | 50 Ω | -50.0 | 50.0 | 0.0000000 Ω | PASS | ||
| 1 GΩ Range (2w FRONT) | 50 Ω | -50.0 | 50.0 | 0.0000000 Ω | PASS | ||
Table 13: Resistance zero offset performance, as adjusted and returned
Zero offset for resistance ranges is good, and even 2-wire offset is improved quite noticeably after adjustment. So a solid pass on these points and now ready to move on to a test that had a lot of failures on meter as received.
| Keithley 2002,1167961,A10/A02, Last adjustment date 27.MAR.2025. Performance verification xDevs.com Rev.3170/3158 28.MAR.2025 | ||||||||
|---|---|---|---|---|---|---|---|---|
| 4-wire resistance test procedure for all test points that verify gain of the OHMF function. 4-wire connection MFC to DMM | ||||||||
| 1 Ω OCOMP | 0.9996375 Ω | 0.9996578 Ω | 40.0 µΩ/Ω | 0.999502516 | 0.999772484 | 20.3 µΩ/Ω | 95.0 µΩ/Ω | PASS, 19.70 % of 103.1 µΩ/Ω |
| 1.9 Ω OCOMP | 1.8996186 Ω | 1.8995518 Ω | 33.0 µΩ/Ω | 1.89945641 | 1.89978079 | -35.2 µΩ/Ω | 52.4 µΩ/Ω | PASS, 57.29 % of 61.4 µΩ/Ω |
| 10 Ω OCOMP | 10.000992 Ω | 10.0010315 Ω | 5.0 µΩ/Ω | 10.000802 | 10.001182 | 3.9 µΩ/Ω | 14.0 µΩ/Ω | PASS, 27.13 % of 14.6 µΩ/Ω |
| 19 Ω OCOMP | 18.99843 Ω | 18.9984763 Ω | 4.0 µΩ/Ω | 18.998169 | 18.998691 | 2.4 µΩ/Ω | 9.7 µΩ/Ω | PASS, 23.15 % of 10.5 µΩ/Ω |
| 100 Ω OCOMP | 99.99358 Ω | 0.099994 kΩ | 1.7 µΩ/Ω | 99.99231 | 99.99485 | 1.4 µΩ/Ω | 11.0 µΩ/Ω | PASS, 12.76 % of 11.1 µΩ/Ω |
| 190 Ω OCOMP | 189.99437 Ω | 0.189994 kΩ | 1.7 µΩ/Ω | 189.992497 | 189.996243 | 0.5 µΩ/Ω | 8.2 µΩ/Ω | PASS, 6.19 % of 8.3 µΩ/Ω |
| 1.0 kΩ OCOMP | 999.9295 Ω | 0.9999291 kΩ | 1.7 µΩ/Ω | 999.9247 | 999.9343 | -0.4 µΩ/Ω | 3.1 µΩ/Ω | PASS, 12.45 % of 3.5 µΩ/Ω |
| 1.9 kΩ OCOMP | 1899.8782 Ω | 1.8998777 kΩ | 1.7 µΩ/Ω | 1899.86962 | 1899.88678 | -0.3 µΩ/Ω | 2.8 µΩ/Ω | PASS, 7.68 % of 3.3 µΩ/Ω |
| 10 kΩ OCOMP | 9999.638 Ω | 9.9996426 kΩ | 1.6 µΩ/Ω | 9999.591 | 9999.685 | 0.5 µΩ/Ω | 3.1 µΩ/Ω | PASS, 13.19 % of 3.5 µΩ/Ω |
| 19 kΩ OCOMP | 18999.593 Ω | 18.9996020 kΩ | 1.7 µΩ/Ω | 18999.5072 | 18999.6788 | 0.5 µΩ/Ω | 2.8 µΩ/Ω | PASS, 14.40 % of 3.3 µΩ/Ω |
| 100 kΩ | 99993.53 Ω | 99.99342 kΩ | 2.0 µΩ/Ω | 99992.68 | 99994.38 | -1.1 µΩ/Ω | 6.5 µΩ/Ω | PASS, 16.62 % of 6.8 µΩ/Ω |
| 190 kΩ | 190009.24 Ω | 190.00907 kΩ | 2.0 µΩ/Ω | 190007.715 | 190010.765 | -0.9 µΩ/Ω | 6.0 µΩ/Ω | PASS, 14.01 % of 6.3 µΩ/Ω |
| 1.0 MΩ | 999901.9 Ω | 0.999900 MΩ | 2.5 µΩ/Ω | 999886.801 | 999916.999 | -2.2 µΩ/Ω | 12.6 µΩ/Ω | PASS, 17.05 % of 12.8 µΩ/Ω |
| 1.9 MΩ | 1900019 Ω | 1.900013 MΩ | 3.0 µΩ/Ω | 1899989.9 | 1900048.1 | -3.2 µΩ/Ω | 12.3 µΩ/Ω | PASS, 25.60 % of 12.5 µΩ/Ω |
| 10 MΩ 2W | 9998293 Ω | 9.998281 MΩ | 10.0 µΩ/Ω | 9997689.1 | 9998896.9 | -1.2 µΩ/Ω | 50.4 µΩ/Ω | PASS, 2.30 % of 51.4 µΩ/Ω |
| 19 MΩ 2W | 19000400 Ω | 19.000385 MΩ | 20.0 µΩ/Ω | 18999066 | 19001734 | -0.8 µΩ/Ω | 50.2 µΩ/Ω | PASS, 1.42 % of 54.0 µΩ/Ω |
| 100 MΩ 2W | 100006170 Ω | 100.00451 MΩ | 50.0 µΩ/Ω | 99985968.8 | 100026371 | -16.5 µΩ/Ω | 152.0 µΩ/Ω | PASS, 10.34 % of 160.0 µΩ/Ω |
Table 14: Resistance gain performance, as adjusted and returned
All is green now in the resistance realm. Worst deviation is on the 20 Ω range at 1.8 Ω point. All measurements from 100 Ω to 1 MΩ now fall to less than 2.2 ppm deviation from the well-known standard. Next are the AC voltage tests. Below are Keithley’s specifications for AC Voltage that we verify performance against.
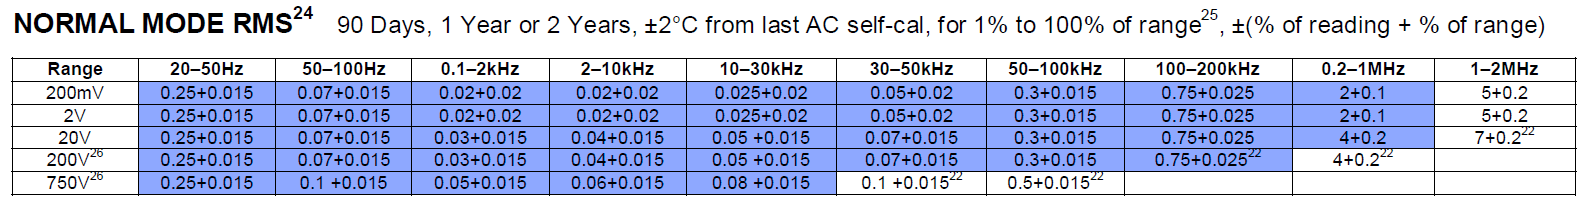
Image 17: Tested AC Voltage specifications marked in blue
Frequency bands above 1 kHz for high voltage range (700V points) were not tested since there was no 5725A attached to calibrator used in these calibration experiments. Same reason to limit frequency to below 100 kHz on 200 V point. Calibrator is unable to source frequencies higher than 1.1999 MHz so points above 1 MHz weren’t tested at lower ranges either.
| Keithley 2002,1167961,A10/A02, Last adjustment date 27.MAR.2025. Performance verification xDevs.com Rev.3170/3158 28.MAR.2025 | ||||||||
|---|---|---|---|---|---|---|---|---|
| Procedure for all test points that verify Gain & flatness of the AC Voltage. 2-wire connection at LO and ACV is used between DMM and MFC | ||||||||
| 0.02 V AC+DC @ 10 Hz | 0.02002701 | 0.0400 % | 0.0199055 | 0.0200945 | 0.1351 % | 0.4325 % | PASS, 31.09 % of 4343 µV/V | |
| 0.02 V AC+DC @ 20 Hz | 0.02002532 | 0.0280 % | 0.0199079 | 0.0200921 | 0.1266 % | 0.4325 % | PASS, 29.21 % of 4334 µV/V | |
| 0.02 V AC+DC @ 50 Hz | 0.02002488 | 0.0270 % | 0.0199081 | 0.0200919 | 0.1244 % | 0.4325 % | PASS, 28.71 % of 4333 µV/V | |
| 0.02 V AC+DC @ 60 Hz | 0.02001815 | 0.0270 % | 0.0199081 | 0.0200919 | 0.0907 % | 0.4325 % | PASS, 20.94 % of 4333 µV/V | |
| 0.02 V AC+DC @ 100 Hz | 0.02002416 | 0.0270 % | 0.0199081 | 0.0200919 | 0.1208 % | 0.4325 % | PASS, 27.88 % of 4333 µV/V | |
| 0.02 V AC+DC @ 1.0 kHz | 0.02002453 | 0.0270 % | 0.0199081 | 0.0200919 | 0.1227 % | 0.4325 % | PASS, 28.30 % of 4333 µV/V | |
| 0.02 V AC+DC @ 6.25 kHz | 0.02001991 | 0.0270 % | 0.0199081 | 0.0200919 | 0.0995 % | 0.4325 % | PASS, 22.97 % of 4333 µV/V | |
| 0.02 V AC+DC @ 10.0 kHz | 0.02001931 | 0.0270 % | 0.0199081 | 0.0200919 | 0.0965 % | 0.4325 % | PASS, 22.28 % of 4333 µV/V | |
| 0.02 V AC+DC @ 20.0 kHz | 0.02001906 | 0.0270 % | 0.0199081 | 0.0200919 | 0.0953 % | 0.4325 % | PASS, 21.99 % of 4333 µV/V | |
| 0.02 V AC+DC @ 50.0 kHz | 0.02001374 | 0.0370 % | 0.0199061 | 0.0200939 | 0.0687 % | 0.4325 % | PASS, 15.83 % of 4341 µV/V | |
| 0.02 V AC+DC @ 100.0 kHz | 0.01998947 | 0.0650 % | 0.0199205 | 0.0200795 | -0.0527 % | 0.3325 % | PASS, 15.54 % of 3388 µV/V | |
| 0.02 V AC+DC @ 200.0 kHz | 0.01992622 | 0.0800 % | 0.0198275 | 0.0201725 | -0.3689 % | 0.7825 % | PASS, 46.90 % of 7866 µV/V | |
| 0.02 V AC+DC @ 300.0 kHz | 0.01987319 | 0.0800 % | 0.0198275 | 0.0201725 | -0.6341 % | 0.7825 % | PASS, 80.61 % of 7866 µV/V | |
| 0.2 V AC+DC @ 10 Hz | 0.2000085 | 0.0260 % | 0.199418 | 0.200582 | 0.0042 % | 0.2650 % | PASS, 1.60 % of 2663 µV/V | |
| 0.2 V AC+DC @ 20 Hz | 0.20000542 | 0.0115 % | 0.199447 | 0.200553 | 0.0027 % | 0.2650 % | PASS, 1.02 % of 2652 µV/V | |
| 0.2 V AC+DC @ 50 Hz | 0.20000469 | 0.0105 % | 0.199899 | 0.200101 | 0.0023 % | 0.0400 % | PASS, 5.67 % of 413 µV/V | |
| 0.2 V AC+DC @ 60 Hz | 0.19999627 | 0.0105 % | 0.199899 | 0.200101 | -0.0019 % | 0.0400 % | PASS, 4.51 % of 413 µV/V | |
| 0.2 V AC+DC @ 100 Hz | 0.20000308 | 0.0105 % | 0.199899 | 0.200101 | 0.0015 % | 0.0400 % | PASS, 3.73 % of 413 µV/V | |
| 0.2 V AC+DC @ 1.0 kHz | 0.20000337 | 0.0105 % | 0.199899 | 0.200101 | 0.0017 % | 0.0400 % | PASS, 4.08 % of 413 µV/V | |
| 0.2 V AC+DC @ 6.25 kHz | 0.20000759 | 0.0105 % | 0.199889 | 0.200111 | 0.0038 % | 0.0450 % | PASS, 8.22 % of 462 µV/V | |
| 0.2 V AC+DC @ 10.0 kHz | 0.2000084 | 0.0105 % | 0.199889 | 0.200111 | 0.0042 % | 0.0450 % | PASS, 9.09 % of 462 µV/V | |
| 0.2 V AC+DC @ 20.0 kHz | 0.20000808 | 0.0105 % | 0.199889 | 0.200111 | 0.0040 % | 0.0450 % | PASS, 8.75 % of 462 µV/V | |
| 0.2 V AC+DC @ 50.0 kHz | 0.19998548 | 0.0205 % | 0.199819 | 0.200181 | -0.0073 % | 0.0700 % | PASS, 9.96 % of 729 µV/V | |
| 0.2 V AC+DC @ 100.0 kHz | 0.19981151 | 0.0485 % | 0.199273 | 0.200727 | -0.0942 % | 0.3150 % | PASS, 29.57 % of 3187 µV/V | |
| 0.2 V AC+DC @ 200.0 kHz | 0.19933722 | 0.0800 % | 0.19579 | 0.20421 | -0.3314 % | 2.0250 % | PASS, 16.35 % of 20266 µV/V | |
| 0.2 V AC+DC @ 300.0 kHz | 0.19897994 | 0.0800 % | 0.19579 | 0.20421 | -0.5100 % | 2.0250 % | PASS, 25.17 % of 20266 µV/V | |
| 0.2 V AC+DC @ 500.0 kHz | 0.19904004 | 0.1200 % | 0.19536 | 0.20464 | -0.4800 % | 2.2000 % | PASS, 21.78 % of 22033 µV/V | |
| 0.2 V AC+DC @ 1.0 MHz | 0.20062926 | 0.2600 % | 0.19508 | 0.20492 | 0.3146 % | 2.2000 % | PASS, 14.20 % of 22153 µV/V | |
| 2.0 V AC+DC @ 10 Hz | 2.0003593 | 0.0220 % | 1.99426 | 2.00574 | 0.0180 % | 0.2650 % | PASS, 6.76 % of 2659 µV/V | |
| 2.0 V AC+DC @ 20 Hz | 2.0003567 | 0.0083 % | 1.994535 | 2.005465 | 0.0178 % | 0.2650 % | PASS, 6.73 % of 2651 µV/V | |
| 2.0 V AC+DC @ 50 Hz | 2.0003746 | 0.0041 % | 1.999118 | 2.000882 | 0.0187 % | 0.0400 % | PASS, 46.59 % of 402 µV/V | |
| 2.0 V AC+DC @ 60 Hz | 2.0003652 | 0.0041 % | 1.999118 | 2.000882 | 0.0183 % | 0.0400 % | PASS, 45.42 % of 402 µV/V | |
| 2.0 V AC+DC @ 100 Hz | 2.0003301 | 0.0041 % | 1.999118 | 2.000882 | 0.0165 % | 0.0400 % | PASS, 41.06 % of 402 µV/V | |
| 2.0 V AC+DC @ 1.0 kHz | 2.0002642 | 0.0041 % | 1.999118 | 2.000882 | 0.0132 % | 0.0400 % | PASS, 32.86 % of 402 µV/V | |
| 2.0 V AC+DC @ 6.25 kHz | 2.0002789 | 0.0041 % | 1.999018 | 2.000982 | 0.0139 % | 0.0450 % | PASS, 30.87 % of 452 µV/V | |
| 2.0 V AC+DC @ 10.0 kHz | 2.0002994 | 0.0041 % | 1.999018 | 2.000982 | 0.0150 % | 0.0450 % | PASS, 33.14 % of 452 µV/V | |
| 2.0 V AC+DC @ 20.0 kHz | 2.0002751 | 0.0041 % | 1.999018 | 2.000982 | 0.0138 % | 0.0450 % | PASS, 30.45 % of 452 µV/V | |
| 2.0 V AC+DC @ 50.0 kHz | 1.9998792 | 0.0070 % | 1.99846 | 2.00154 | -0.0060 % | 0.0700 % | PASS, 8.59 % of 703 µV/V | |
| 2.0 V AC+DC @ 100.0 kHz | 1.9981808 | 0.0115 % | 1.99347 | 2.00653 | -0.0910 % | 0.3150 % | PASS, 28.86 % of 3152 µV/V | |
| 2.0 V AC+DC @ 200.0 kHz | 1.9936257 | 0.0340 % | 1.95882 | 2.04118 | -0.3187 % | 2.0250 % | PASS, 15.74 % of 20253 µV/V | |
| 2.0 V AC+DC @ 300.0 kHz | 1.9905985 | 0.0340 % | 1.95882 | 2.04118 | -0.4701 % | 2.0250 % | PASS, 23.21 % of 20253 µV/V | |
| 2.0 V AC+DC @ 500.0 kHz | 1.9886512 | 0.0900 % | 1.9542 | 2.0458 | -0.5674 % | 2.2000 % | PASS, 25.77 % of 22018 µV/V | |
| 2.0 V AC+DC @ 1.0 MHz | 1.9919418 | 0.1500 % | 1.953 | 2.047 | -0.4029 % | 2.2000 % | PASS, 18.27 % of 22051 µV/V | |
| 20 V AC+DC @ 10 Hz | 20.001831 | 0.0220 % | 19.9156 | 20.0844 | 0.0092 % | 0.4000 % | PASS, 2.29 % of 4006 µV/V | |
| 20 V AC+DC @ 20 Hz | 20.002021 | 0.0083 % | 19.91835 | 20.08165 | 0.0101 % | 0.4000 % | PASS, 2.53 % of 4001 µV/V | |
| 20 V AC+DC @ 50 Hz | 20.001966 | 0.0040 % | 19.96321 | 20.03679 | 0.0098 % | 0.1800 % | PASS, 5.46 % of 1800 µV/V | |
| 20 V AC+DC @ 60 Hz | 20.001877 | 0.0040 % | 19.96321 | 20.03679 | 0.0094 % | 0.1800 % | PASS, 5.21 % of 1800 µV/V | |
| 20 V AC+DC @ 100 Hz | 20.001659 | 0.0040 % | 19.96321 | 20.03679 | 0.0083 % | 0.1800 % | PASS, 4.61 % of 1800 µV/V | |
| 20 V AC+DC @ 1.0 kHz | 20.000826 | 0.0040 % | 19.96321 | 20.03679 | 0.0041 % | 0.1800 % | PASS, 2.29 % of 1800 µV/V | |
| 20 V AC+DC @ 6.25 kHz | 19.9977 | 0.0040 % | 19.95921 | 20.04079 | -0.0115 % | 0.2000 % | PASS, 5.75 % of 2000 µV/V | |
| 20 V AC+DC @ 10.0 kHz | 19.99791 | 0.0040 % | 19.95921 | 20.04079 | -0.0104 % | 0.2000 % | PASS, 5.22 % of 2000 µV/V | |
| 20 V AC+DC @ 20.0 kHz | 19.999571 | 0.0040 % | 19.95921 | 20.04079 | -0.0021 % | 0.2000 % | PASS, 1.07 % of 2000 µV/V | |
| 20 V AC+DC @ 50.0 kHz | 20.00249 | 0.0070 % | 19.9546 | 20.0454 | 0.0125 % | 0.2200 % | PASS, 5.66 % of 2201 µV/V | |
| 20 V AC+DC @ 100.0 kHz | 19.994727 | 0.0100 % | 19.908 | 20.092 | -0.0264 % | 0.4500 % | PASS, 5.86 % of 4501 µV/V | |
| 20 V AC+DC @ 200.0 kHz | 19.971582 | 0.0280 % | 19.1444 | 20.8556 | -0.1421 % | 4.2500 % | PASS, 3.34 % of 42501 µV/V | |
| 20 V AC+DC @ 300.0 kHz | 19.970549 | 0.0280 % | 19.1444 | 20.8556 | -0.1473 % | 4.2500 % | PASS, 3.46 % of 42501 µV/V | |
| 20 V AC+DC @ 500.0 kHz | 20.024632 | 0.0900 % | 18.782 | 21.218 | 0.1232 % | 6.0000 % | PASS, 2.05 % of 60007 µV/V | |
| 20 V AC+DC @ 1.0 MHz | 20.410256 | 0.1400 % | 18.772 | 21.228 | 2.0513 % | 6.0000 % | PASS, 34.18 % of 60016 µV/V | |
| 200.0 V AC+DC @ 10 Hz | 200.04117 | 0.0220 % | 199.426 | 200.574 | 0.0206 % | 0.2650 % | PASS, 7.74 % of 2659 µV/V | |
| 200.0 V AC+DC @ 20 Hz | 200.03915 | 0.0083 % | 199.4535 | 200.5465 | 0.0196 % | 0.2650 % | PASS, 7.38 % of 2651 µV/V | |
| 200.0 V AC+DC @ 50 Hz | 200.03994 | 0.0048 % | 199.9004 | 200.0996 | 0.0200 % | 0.0450 % | PASS, 44.13 % of 453 µV/V | |
| 200.0 V AC+DC @ 60 Hz | 200.04042 | 0.0048 % | 199.9004 | 200.0996 | 0.0202 % | 0.0450 % | PASS, 44.66 % of 453 µV/V | |
| 200.0 V AC+DC @ 100 Hz | 200.0358 | 0.0048 % | 199.9004 | 200.0996 | 0.0179 % | 0.0450 % | PASS, 39.55 % of 453 µV/V | |
| 200.0 V AC+DC @ 1.0 kHz | 200.02126 | 0.0048 % | 199.9004 | 200.0996 | 0.0106 % | 0.0450 % | PASS, 23.49 % of 453 µV/V | |
| 200.0 V AC+DC @ 6.25 kHz | 199.99989 | 0.0048 % | 199.8604 | 200.1396 | -0.0001 % | 0.0650 % | PASS, 0.08 % of 652 µV/V | |
| 200.0 V AC+DC @ 10.0 kHz | 200.00705 | 0.0048 % | 199.8604 | 200.1396 | 0.0035 % | 0.0650 % | PASS, 5.41 % of 652 µV/V | |
| 200.0 V AC+DC @ 20.0 kHz | 200.0231 | 0.0048 % | 199.8604 | 200.1396 | 0.0115 % | 0.0650 % | PASS, 17.72 % of 652 µV/V | |
| 200.0 V AC+DC @ 50.0 kHz | 200.00058 | 0.0075 % | 199.815 | 200.185 | 0.0003 % | 0.0850 % | PASS, 0.34 % of 853 µV/V | |
| 200.0 V AC+DC @ 100.0 kHz | 199.83159 | 0.0133 % | 199.3435 | 200.6565 | -0.0842 % | 0.3150 % | PASS, 26.71 % of 3153 µV/V | |
| 700.0 V AC+DC @ 50 Hz | 700.0663 | 0.0079 % | 699.445 | 700.555 | 0.0095 % | 0.0714 % | PASS, 13.18 % of 719 µV/V | |
| 700.0 V AC+DC @ 60 Hz | 700.0711 | 0.0079 % | 699.445 | 700.555 | 0.0102 % | 0.0714 % | PASS, 14.13 % of 719 µV/V | |
| 700.0 V AC+DC @ 100 Hz | 700.0688 | 0.0079 % | 699.445 | 700.555 | 0.0098 % | 0.0714 % | PASS, 13.68 % of 719 µV/V | |
| 700.0 V AC+DC @ 1.0 kHz | 700.0741 | 0.0079 % | 699.445 | 700.555 | 0.0106 % | 0.0714 % | PASS, 14.73 % of 719 µV/V | |
Table 15: AC Voltage gain and flatness performance, as adjusted and returned
Everything passed in solid green for AC Voltage, with the worst deviation 80% for 20 mV 300 kHz test point. Even challenging 20 mV point (10% of 210mV range) is able to meet specs well. Next test is DC current. Below are Keithley’s specifications for DC Current that we verify performance against.
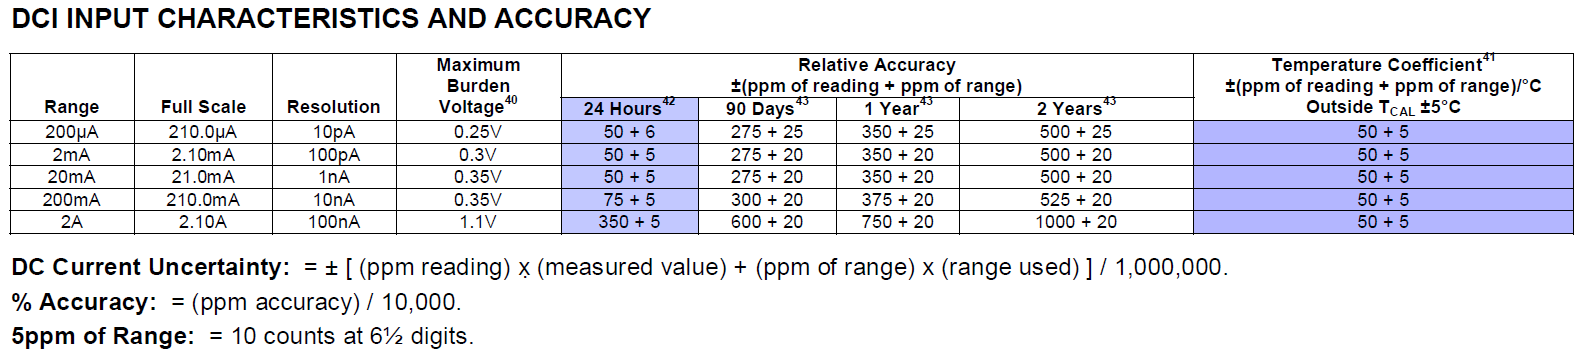
Image 18: Tested DC Current specifications marked in blue
Important change on this test was implemented compared to previous “as received” verification. There was noticeable slope of the DC current readout from 2002 with applied test current 1.0 and 2.0 A. This is due to self-heating of the current shunt and circuits around it when such large current is constantly applied.
| Keithley 2002,1167961,A10/A02, Last adjustment date 27.MAR.2025. Performance verification xDevs.com Rev.3170/3158 28.MAR.2025 | ||||||||
|---|---|---|---|---|---|---|---|---|
| Procedure for all test points that verify Gain of the DC Current DCI. 2-wire connection at LO and DCI is used between DMM and MFC. | ||||||||
| Zero µADC | 0.5800 nA | INFO | ||||||
| 1 µADC | 1.00041 µA | 0.162 % | 9.971306E-07 | 1.002869E-06 | 0.0410 % | 1250 µA/A | PASS, 20.04 % of 0.205 % | |
| 2 µADC | 2.00043 µA | 0.082 % | 1.997057E-06 | 2.002943E-06 | 215.0 µA/A | 650 µA/A | PASS, 20.53 % of 0.105 % | |
| -1 µADC | -0.99962 µA | 0.162 % | -1.002869E-06 | -9.971306E-07 | -0.0380 % | 1250 µA/A | PASS, 18.58 % of 0.205 % | |
| -2 µADC | -1.99959 µA | 0.082 % | -2.002943E-06 | -1.997057E-06 | -205.0 µA/A | 650 µA/A | PASS, 19.57 % of 0.105 % | |
| Zero 00 µADC | 0.6000 nA | INFO | ||||||
| 10 µADC | 10.00051 µA | 182.0 µA/A | 9.99648E-06 | 1.000352E-05 | 51.0 µA/A | 170 µA/A | PASS, 20.48 % of 249 µA/A | |
| 20 µADC | 20.00042 µA | 102.0 µA/A | 1.999576E-05 | 2.000424E-05 | 21.0 µA/A | 110 µA/A | PASS, 14.00 % of 150 µA/A | |
| -10 µADC | -9.99961 µA | 182.0 µA/A | -1.000352E-05 | -9.99648E-06 | -39.0 µA/A | 170 µA/A | PASS, 15.66 % of 249 µA/A | |
| 20 µADC | -19.99967 µA | 102.0 µA/A | -2.000424E-05 | -1.999576E-05 | -16.5 µA/A | 110 µA/A | PASS, 11.00 % of 150 µA/A | |
| Zero 000 µADC | 0.6600 nA | INFO | ||||||
| 100 µADC | 100.00012 µA | 38.0 µA/A | 9.999E-05 | 0.00010001 | 1.2 µA/A | 62 µA/A | PASS, 1.65 % of 73 µA/A | |
| 200 µADC | 199.99950 µA | 30.0 µA/A | 0.0001999828 | 0.0002000172 | -2.5 µA/A | 56 µA/A | PASS, 3.94 % of 64 µA/A | |
| -100 µADC | -100.00005 µA | 38.0 µA/A | -0.00010001 | -9.999E-05 | 0.5 µA/A | 62 µA/A | PASS, 0.69 % of 73 µA/A | |
| -200 µADC | -200.00062 µA | 30.0 µA/A | -0.0002000172 | -0.0001999828 | 3.1 µA/A | 56 µA/A | PASS, 4.88 % of 64 µA/A | |
| Zero mADC | 1.2000 nA | INFO | ||||||
| 1.0 mADC | 0.999999 mA | 26.0 µA/A | 0.000999914 | 0.001000086 | -1.3 µA/A | 60 µA/A | PASS, 1.99 % of 65 µA/A | |
| 2.0 mADC | 1.999995 mA | 24.0 µA/A | 0.001999842 | 0.002000158 | -2.4 µA/A | 55 µA/A | PASS, 4.00 % of 60 µA/A | |
| -1.0 mADC | -1.000010 mA | 26.0 µA/A | -0.001000086 | -0.000999914 | 10.0 µA/A | 60 µA/A | PASS, 15.29 % of 65 µA/A | |
| -2.0 mADC | -2.000020 mA | 24.0 µA/A | -0.002000158 | -0.001999842 | 9.8 µA/A | 55 µA/A | PASS, 16.25 % of 60 µA/A | |
| Zero 00 mADC | 16.0000 nA | INFO | ||||||
| 10 mADC | 9.999817 mA | 26.0 µA/A | 0.00999914 | 0.01000086 | -18.3 µA/A | 60 µA/A | PASS, 27.99 % of 65 µA/A | |
| 20 mADC | 19.999646 mA | 24.0 µA/A | 0.01999842 | 0.02000158 | -17.7 µA/A | 55 µA/A | PASS, 29.50 % of 60 µA/A | |
| -10 mADC | -9.999934 mA | 26.0 µA/A | -0.01000086 | -0.00999914 | -6.6 µA/A | 60 µA/A | PASS, 10.09 % of 65 µA/A | |
| -20 mADC | -19.999856 mA | 24.0 µA/A | -0.02000158 | -0.01999842 | -7.2 µA/A | 55 µA/A | PASS, 12.00 % of 60 µA/A | |
| Zero 000 mADC | 100.0000 nA | INFO | ||||||
| 100 mADC | 99.99978 mA | 27.5 µA/A | 0.09998875 | 0.1000112 | -2.2 µA/A | 85 µA/A | PASS, 2.46 % of 89 µA/A | |
| 200 mADC | 199.99869 mA | 26.2 µA/A | 0.1999788 | 0.2000212 | -6.6 µA/A | 80 µA/A | PASS, 7.78 % of 84 µA/A | |
| -100 mADC | -100.00162 mA | 27.5 µA/A | -0.1000113 | -0.09998875 | 16.2 µA/A | 85 µA/A | PASS, 18.13 % of 89 µA/A | |
| -200 mADC | -200.00226 mA | 26.2 µA/A | -0.2000213 | -0.1999787 | 11.3 µA/A | 80 µA/A | PASS, 13.42 % of 84 µA/A | |
| Zero ADC | 600.0000 nA | INFO | ||||||
| 1 ADC | 1.0003249 A | 62.0 µA/A | 0.999578 | 1.000422 | 324.9 µA/A | 360 µA/A | PASS, 88.94 % of 365 µA/A | |
| -1 ADC | -1.0003198 A | 62.0 µA/A | -1.000422 | -0.999578 | 319.8 µA/A | 360 µA/A | PASS, 87.54 % of 365 µA/A | |
| 2 ADC | 1.9997159 A | 96.0 µA/A | 1.999098 | 2.000902 | -142.1 µA/A | 355 µA/A | PASS, 38.63 % of 368 µA/A | |
| -2 ADC | -1.9996960 A | 96.0 µA/A | -2.000902 | -1.999098 | -152.0 µA/A | 355 µA/A | PASS, 41.33 % of 368 µA/A | |
Table 16: DC current gain and zero offset performance, as adjusted and returned
Original calibration program had 5 minute soak time to allow the shunt to stabilize under power, but as additional checks showed this 2002 needed much more time. So new procedure was modified to accommodate for additional time during the warm-up stage. Since our Calkit Python application logs all readings and timestamps of every single GPIB-command sent to calibrator and DMM I’ve plotted a chart to demonstrate observed results.
Three different Keithley 2002 were tested for 2A range heating effects and all three show similar behavior. Based on this it is deemed to be typical for these instruments. Perhaps Keithley 2001 is also the same as DALE SPU-52-1 2W current shunt for high current range is identical between these instruments.
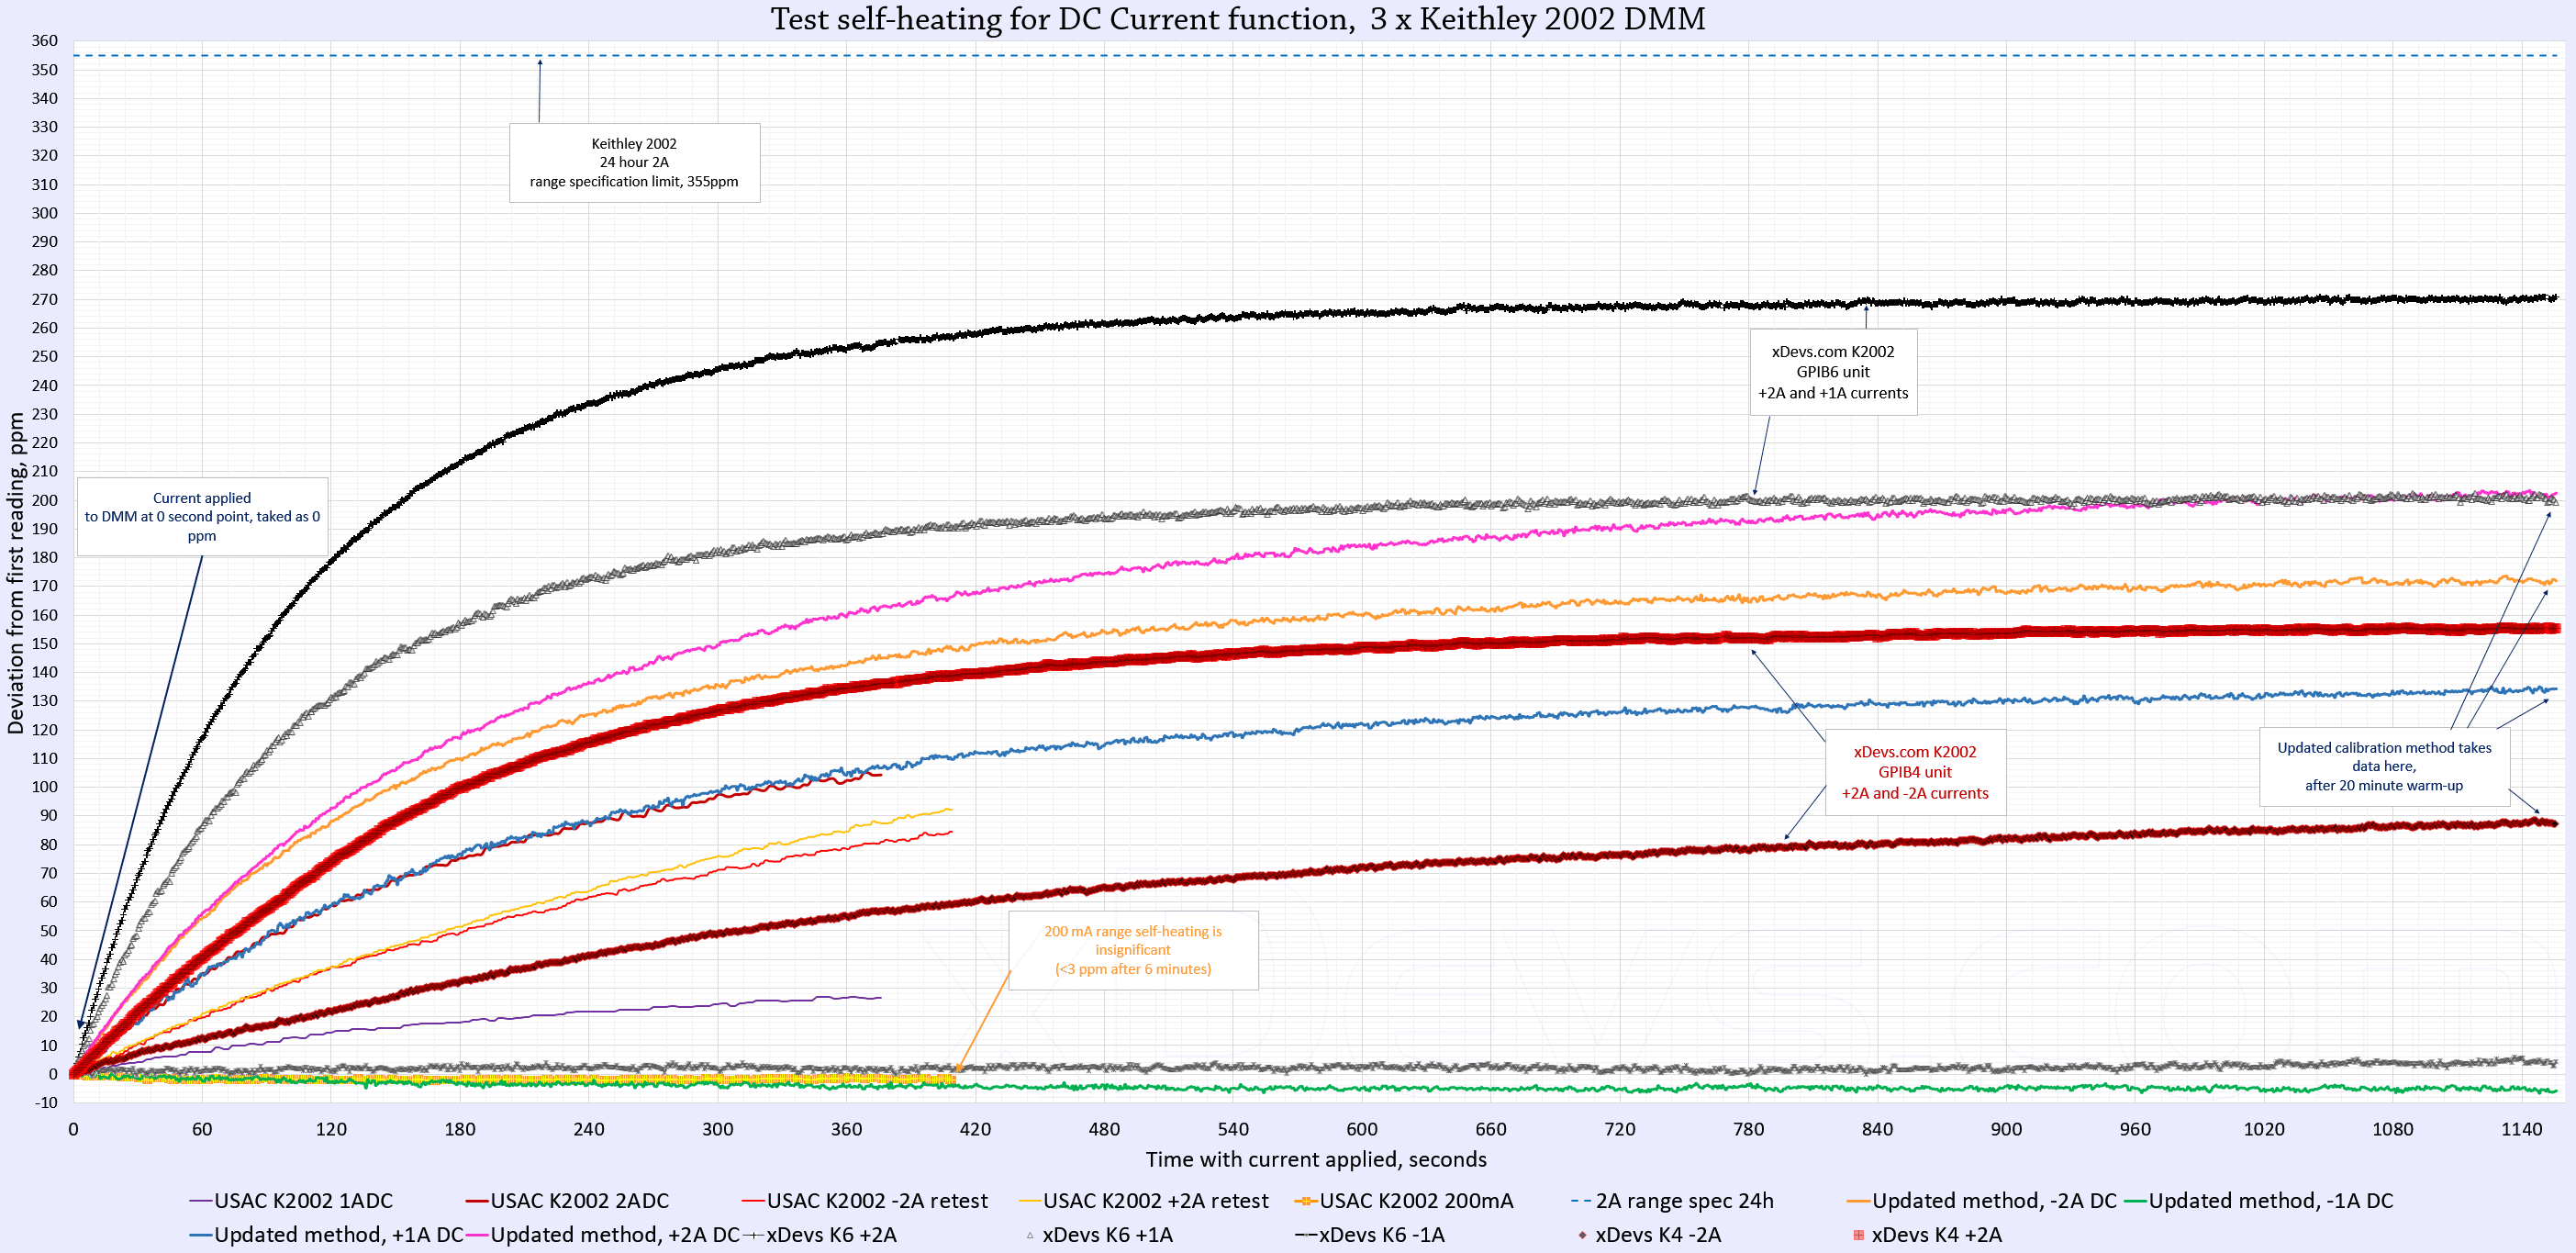
Image 19: Self-heating effect at higher currents due to shunt PCR/TCR
New method has a new test order for the higher 2A range of K2002. First -2A DC applied and calibrator is allowed to settle to steady state. Then DMM is configured to log current measurements during 20 minutes (vs 5 minutes for old script) which is about 3000 readings at NPLC10. After this, median of last 15 readings is saved as the final point. There was still small residual readings drift but it was already under 2 ppm/minute, so considered as acceptable.
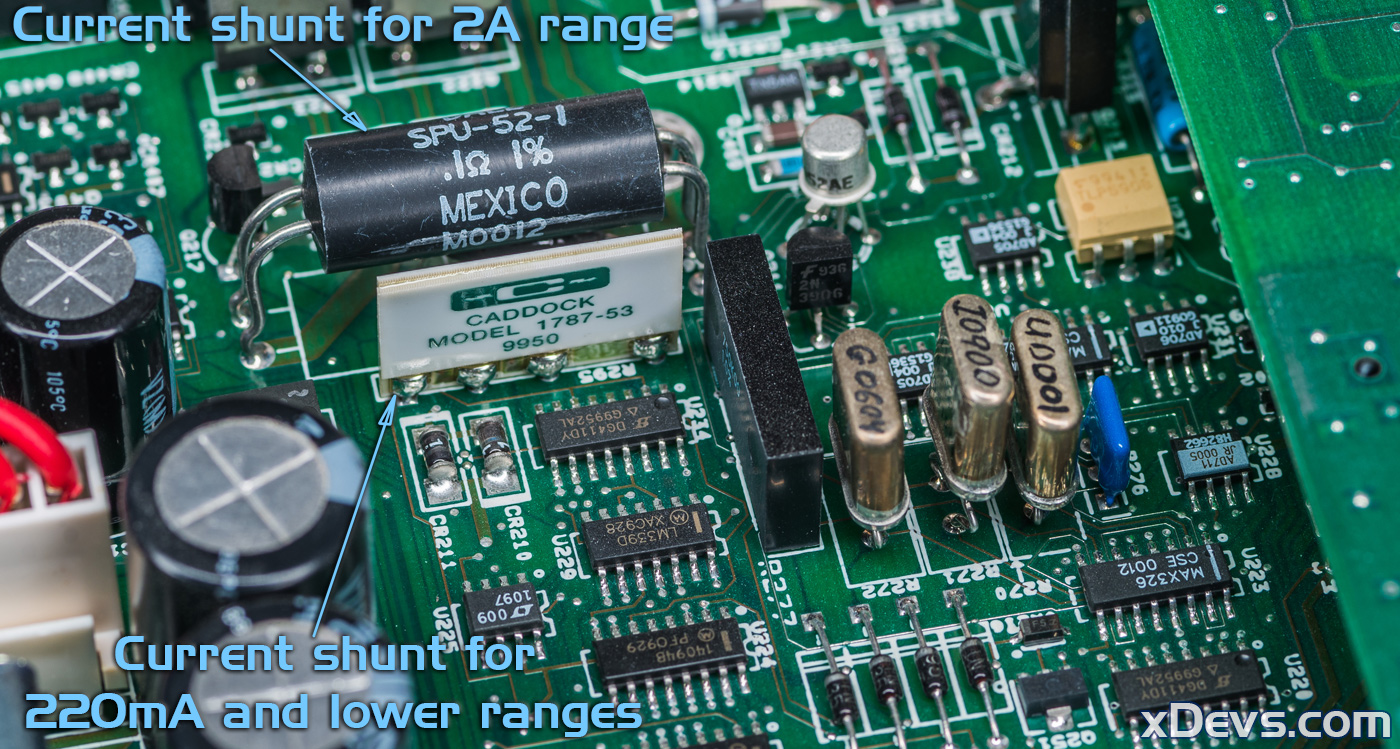
Image 20: Shunts used in Keithley 2002 (photo of different unit shown for reference)
Please note, that while this sounds like a problem, it is actually normal for condition for benchtop DMM. This self-heating effect is still well inside even strict 24-hour specifications of the instrument’s 2A DCI range, as one can guess from the dashed blue line of spec limit, all the way on the top of the plot. Keithley already accounted for possible self-heating errors and included them in a generous 360 ppm specification for 24 hrs. period. Even very expensive high-end DMMs like Model 2002 use real-world imperfect components which change parameters under applied power due material physics and design constrains. That is also why high-end calibrators that are capable of testing 7½-digit DMMs are filled with custom components, precision ovens and high stability resistive networks. All this results in a large size (Wavetek 4808 is 32kg, Fluke 5720A is 27kg), lot of power consumption and prices just slightly below $100k USD.
Obviously benchtop DMM like Keithley 2002 is designed to be a practical instrument at a lower price point, so performance here is less demanding. This is why DALE SPU-52-1 2W is still used in this bench DMM, despite it’s ±100 ppm/°C specification.
Below are Keithley’s specifications for AC Current that we verify performance against. Sourcing currents with frequency above 10 kHz is outside of 5720A capabilities so those points were not tested.
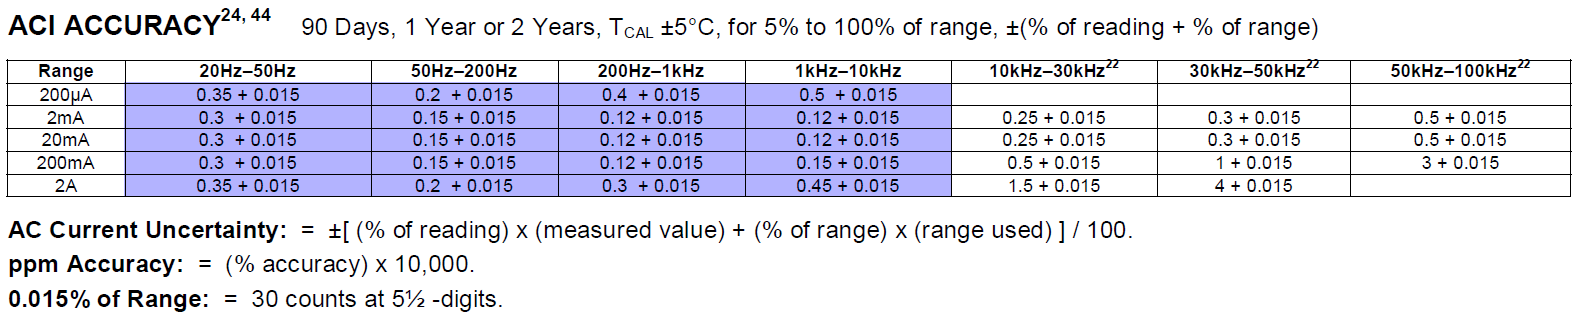
Image 21: Tested AC Current specifications marked in blue
| Keithley 2002,1167961,A10/A02, Last adjustment date 27.MAR.2025. Performance verification xDevs.com Rev.3170/3158 28.MAR.2025 | ||||||||
|---|---|---|---|---|---|---|---|---|
| Procedure for all test points that verify Gain of the AC Current ACI. 2-wire connection at LO and ACI is used between DMM and MFC. | ||||||||
| ACI Test 200µA-2A | DUT | Source unc. | Low Limit | Hi limit | Measured | 24h spec | Result, % spec | |
| 50 µA AC @ 50 Hz | 4.99621E-05 | 0.0165 % | 4.98017275e-05 | 5.01982725e-05 | -0.0758 % | 0.380 % | PASS, 9.96 % of 7607 µA/A | |
| 100 µA AC @ 50 Hz | 9.99793E-05 | 0.0165 % | 9.9618455e-05 | 0.000100381545 | -0.0207 % | 0.365 % | PASS, 2.83 % of 7307 µA/A | |
| 200 µA AC @ 50 Hz | 0.0001999232 | 0.0165 % | 0.00019925191 | 0.00020074809 | -0.0384 % | 0.357 % | PASS, 5.36 % of 7158 µA/A | |
| 1.0 mA AC @ 50 Hz | 0.0009996489 | 0.0138 % | 0.00099671182 | 0.00100328818 | -0.0351 % | 0.315 % | PASS, 5.57 % of 6306 µA/A | |
| 2.0 mA AC @ 50 Hz | 0.001999728 | 0.0138 % | 0.00199357364 | 0.00200642636 | -0.0136 % | 0.307 % | PASS, 2.21 % of 6156 µA/A | |
| 10 mA AC @ 50 Hz | 0.009996954 | 0.0138 % | 0.0099671182 | 0.0100328818 | -0.0305 % | 0.315 % | PASS, 4.83 % of 6306 µA/A | |
| 20 mA AC @ 50 Hz | 0.01999837 | 0.0138 % | 0.0199357364 | 0.0200642636 | -0.0081 % | 0.308 % | PASS, 1.32 % of 6156 µA/A | |
| 100 mA AC @ 50 Hz | 0.1000228 | 0.0134 % | 0.099671636 | 0.100328364 | 0.0228 % | 0.315 % | PASS, 3.61 % of 6306 µA/A | |
| 200 mA AC @ 50 Hz | 0.2000899 | 0.0134 % | 0.199358272 | 0.200641728 | 0.0449 % | 0.307 % | PASS, 7.30 % of 6156 µA/A | |
| 1.0 A AC @ 50 Hz | 1.001119 | 0.0308 % | 0.99604182 | 1.00395818 | 0.1119 % | 0.365 % | PASS, 15.28 % of 7326 µA/A | |
| 2.0 A AC @ 50 Hz | 2.002303 | 0.0308 % | 1.99223364 | 2.00776636 | 0.1151 % | 0.358 % | PASS, 16.04 % of 7177 µA/A | |
| 50 µA AC @ 60 Hz | 4.99764E-05 | 0.0165 % | 4.98767275e-05 | 5.01232725e-05 | -0.0472 % | 0.230 % | PASS, 10.23 % of 4612 µA/A | |
| 100 µA AC @ 60 Hz | 9.99944E-05 | 0.0165 % | 9.9768455e-05 | 0.0001002315 | -0.0056 % | 0.215 % | PASS, 1.30 % of 4313 µA/A | |
| 200 µA AC @ 60 Hz | 0.0001999244 | 0.0165 % | 0.000199551 | 0.000200448 | -0.0378 % | 0.208 % | PASS, 9.08 % of 4163 µA/A | |
| 1.0 mA AC @ 60 Hz | 0.0009997009 | 0.0138 % | 0.000998211 | 0.001001788 | -0.0299 % | 0.165 % | PASS, 9.03 % of 3312 µA/A | |
| 2.0 mA AC @ 60 Hz | 0.001999839 | 0.0138 % | 0.001996573 | 0.002003426 | -0.0081 % | 0.157 % | PASS, 2.55 % of 3162 µA/A | |
| 10 mA AC @ 60 Hz | 0.009997269 | 0.0138 % | 0.00998211 | 0.01001788 | -0.0273 % | 0.165 % | PASS, 8.25 % of 3312 µA/A | |
| 20 mA AC @ 60 Hz | 0.01999935 | 0.0138 % | 0.01996573 | 0.02003426 | -0.0032 % | 0.158 % | PASS, 1.02 % of 3162 µA/A | |
| 100 mA AC @ 60 Hz | 0.1000281 | 0.0134 % | 0.0998216 | 0.1001783 | 0.0281 % | 0.165 % | PASS, 8.48 % of 3311 µA/A | |
| 200 mA AC @ 60 Hz | 0.2000996 | 0.0134 % | 0.1996582 | 0.2003417 | 0.0498 % | 0.157 % | PASS, 15.76 % of 3161 µA/A | |
| 1.0 A AC @ 60 Hz | 1.001203 | 0.0308 % | 0.9975418 | 1.0024581 | 0.1203 % | 0.215 % | PASS, 27.70 % of 4344 µA/A | |
| 2.0 A AC @ 60 Hz | 2.002457 | 0.0308 % | 1.9952336 | 2.0047663 | 0.1228 % | 0.208 % | PASS, 29.28 % of 4196 µA/A | |
| 50 µA AC @ 1.0 kHz | 4.99605E-05 | 0.0165 % | 4.97267275e-05 | 5.02732725e-05 | -0.0790 % | 0.530 % | PASS, 7.45 % of 10605 µA/A | |
| 100 µA AC @ 1.0 kHz | 9.99804E-05 | 0.0165 % | 9.9468455e-05 | 0.000100531545 | -0.0196 % | 0.515 % | PASS, 1.90 % of 10305 µA/A | |
| 200 µA AC @ 1.0 kHz | 0.0001999314 | 0.0165 % | 0.00019895191 | 0.00020104809 | -0.0343 % | 0.507 % | PASS, 3.38 % of 10155 µA/A | |
| 1.0 mA AC @ 1.0 kHz | 0.0009997486 | 0.0138 % | 0.00099851182 | 0.00100148818 | -0.0251 % | 0.135 % | PASS, 9.26 % of 2714 µA/A | |
| 2.0 mA AC @ 1.0 kHz | 0.001999937 | 0.0138 % | 0.00199717364 | 0.00200282636 | -0.0031 % | 0.127 % | PASS, 1.22 % of 2565 µA/A | |
| 10 mA AC @ 1.0 kHz | 0.009998743 | 0.0138 % | 0.0099851182 | 0.0100148818 | -0.0126 % | 0.135 % | PASS, 4.63 % of 2714 µA/A | |
| 20 mA AC @ 1.0 kHz | 0.02000207 | 0.0138 % | 0.0199717364 | 0.0200282636 | 0.0104 % | 0.128 % | PASS, 4.04 % of 2565 µA/A | |
| 100 mA AC @ 1.0 kHz | 0.1000428 | 0.0134 % | 0.099821636 | 0.100178364 | 0.0428 % | 0.165 % | PASS, 12.94 % of 3311 µA/A | |
| 200 mA AC @ 1.0 kHz | 0.2001294 | 0.0134 % | 0.199658272 | 0.200341728 | 0.0647 % | 0.157 % | PASS, 20.46 % of 3161 µA/A | |
| 1.0 A AC @ 1.0 kHz | 1.001324 | 0.0308 % | 0.99504182 | 1.00495818 | 0.1324 % | 0.465 % | PASS, 14.21 % of 9320 µA/A | |
| 2.0 A AC @ 1.0 kHz | 2.002752 | 0.0308 % | 1.99023364 | 2.00976636 | 0.1376 % | 0.457 % | PASS, 15.01 % of 9171 µA/A | |
| 50 µA AC @ 10.0 kHz | 4.98554E-05 | 0.1400 % | 4.974e-05 | 5.026e-05 | -0.2892 % | 0.380 % | PASS, 35.71 % of 8099 µA/A | |
| 100 µA AC @ 10.0 kHz | 9.97909E-05 | 0.1400 % | 9.9495e-05 | 0.000100505 | -0.2091 % | 0.365 % | PASS, 26.74 % of 7819 µA/A | |
| 200 µA AC @ 10.0 kHz | 0.0001995468 | 0.1400 % | 0.000199005 | 0.000200995 | -0.2266 % | 0.357 % | PASS, 29.51 % of 7679 µA/A | |
| 1.0 mA AC @ 10.0 kHz | 0.001000025 | 0.1400 % | 0.00099595 | 0.00100405 | 0.0025 % | 0.265 % | PASS, 0.42 % of 5994 µA/A | |
| 2.0 mA AC @ 10.0 kHz | 0.002000236 | 0.1400 % | 0.00199205 | 0.00200795 | 0.0118 % | 0.257 % | PASS, 2.01 % of 5862 µA/A | |
| 10 mA AC @ 10.0 kHz | 0.01000092 | 0.1300 % | 0.0099605 | 0.0100395 | 0.0092 % | 0.265 % | PASS, 1.56 % of 5903 µA/A | |
| 20 mA AC @ 10.0 kHz | 0.02000373 | 0.1300 % | 0.0199225 | 0.0200775 | 0.0186 % | 0.258 % | PASS, 3.23 % of 5769 µA/A | |
| 100 mA AC @ 10.0 kHz | 0.1001159 | 0.1100 % | 0.099375 | 0.100625 | 0.1159 % | 0.515 % | PASS, 11.01 % of 10532 µA/A | |
| 200 mA AC @ 10.0 kHz | 0.2002507 | 0.1100 % | 0.198765 | 0.201235 | 0.1254 % | 0.507 % | PASS, 12.07 % of 10386 µA/A | |
| 1.0 A AC @ 10.0 kHz | 1.002309 | 0.6100 % | 0.97875 | 1.02125 | 0.2309 % | 1.515 % | PASS, 7.07 % of 32664 µA/A | |
| 2.0 A AC @ 10.0 kHz | 2.005037 | 0.6100 % | 1.95765 | 2.04235 | 0.2518 % | 1.507 % | PASS, 7.74 % of 32525 µA/A | |
Table 17: AC current gain and flatness performance, as adjusted and returned
AC current specifications for 2002 are quite wide, so there are no problems to meet all points in solid green here once again.
Final calibration report is available in the PDF-document as well, which is easier to keep as record in the future.
Calibration report for Keithley 2002 S/N 1167961 after adjustment, 28 MARCH 2025
We are looking forward to see great results and experiments that our friend in Norway will do with this Model 2002 DMM. We might repeat the calibration run with his Datron 4708 calibrator in future to compare the points and evaluate that older 4708 calibrator.
DC Voltage INL tests of Keithley 2002
Another imporant factor often needed from 8½-digit DMM is non-linearity error. To test Keithley 2002 with a it’s 29-bit ADC a good programmable voltage source with a known performance is required. Such source can be for example Fluke 5720A, which we already used for performance verification earlier. However, INL specification of the 5720A is quite similar to own spec for DUT 2002, so something better is required to satisfy the metrology concept of using better reference standard to test device under test. Golden reference for DC Voltage linearity is Quantum Voltage Standard but it’s a very expensive and rare system. Second best alternative is characterized and tested HP 3458A DMM, famous for its excellent INL performance.
So we can use reference 3458A measuring 5720A source output to test our DUT Keithley 2002. Both reference 3458A and 2002 multimeters should be connected to the same precision voltage calibrator and measurements should be taken at multiple different voltage level steps to sweep thru full range. The measurements should be then compared to the known value obtained from 3458A, and the deviation from this reference value is the DUT’s non-linearity result, with source’s Fluke 5720A INL error essentially canceled out.
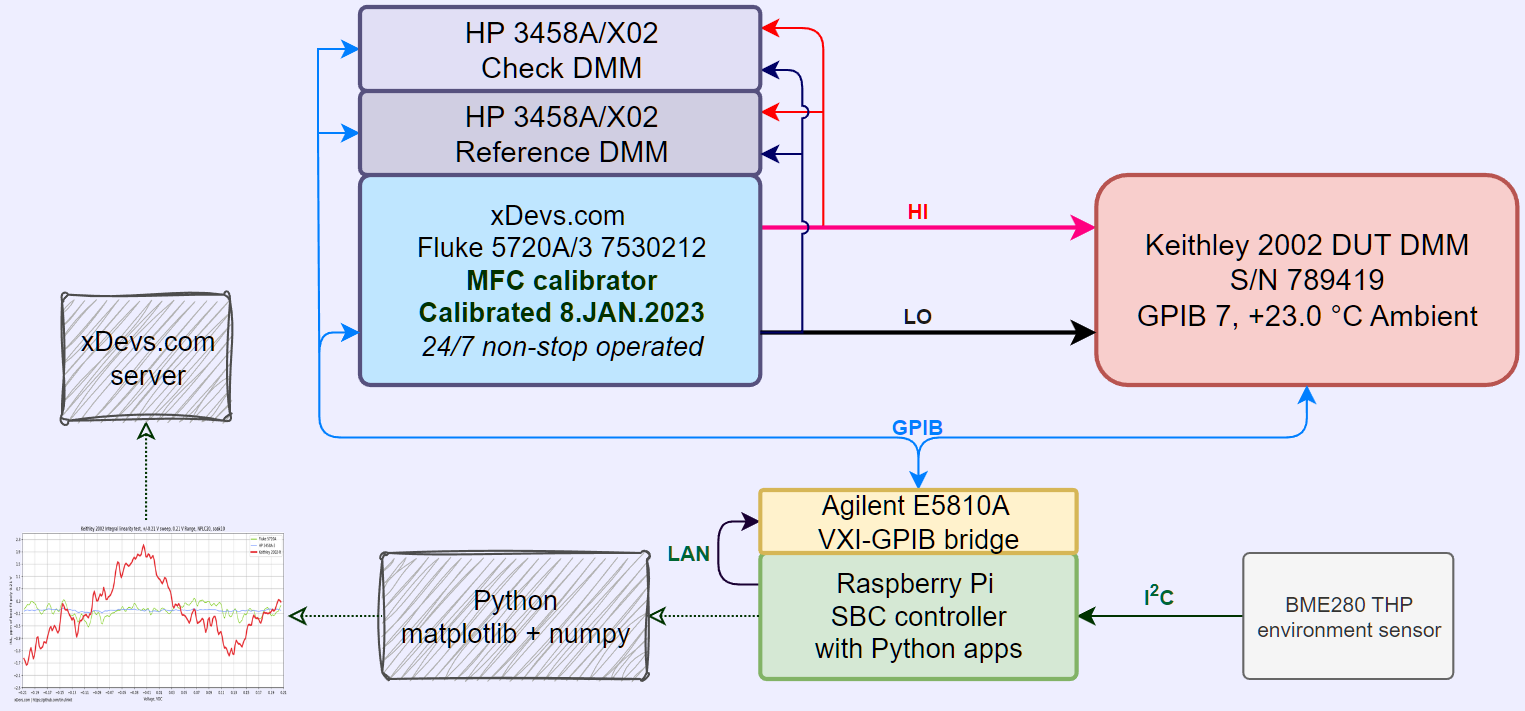
Image 22: System used to verify Keithley 2002 DCV linearity
It is important to note that nonlinearity can be also caused by a variety of external factors and it is not always possible to completely isolate DUT from systematic errors without using intrinsic quantum voltage source. However, such errors can be minimized by using high-quality parts, proper calibration methods, and by performing measurements in a controlled environment with stable temperature and humidity. And it is possible to test INL within 0.1 ppm on ±12 VDC sweep and a bit worse than this level for other ranges. Some more details and test results are available in a dedicated article about INL benchmarking. Operator errors and precise timing of INL sweep is ensured by automating this test with Python application. Demo code example used to perform such INL benchmark on 10V sweep is provided below for reference. It can be easily modified to test other ranges / sweep points.
Example Python 3 program source code to collect INL data points with K2002
This application perform configuration of source (Fluke 5720A), reference DMM (HP 3458A) and DUT Keithley 2002 DMM. After configuration is completed ACAL DCV is executed on the reference 3458A DMM and data collection of voltage sweep from -FS to +FS begins. Each data point is increased by 1% step and multiple samples are taken to reduce influence of the sampling noise. Results are recorded into semicolon-separated CSV file on the filesystem. Whole test takes few hours to complete. This datafile can be now used to plot visual X-Y chart for easy visual representation of INL performance. Python 3 again can help us here with numpy and matplotlib libraries for correlation analysis. Data between DUT DMM is reference DMM is correlated using best fit function and residual INL error is displayed relative to DUT DMM range. For easier understanding relative parts per million (ppm) scale is used.
Python 3 LinKit program to analyze and plot data
Configuration of the program, input filename, plotting parameters and chart scales are defined in separate configuration file linkit.conf. Make sure it is placed in same folder to linearity_plot.py program.
INL LinKit plotter configuration file
Finished plots are shown with simple GUI window and also saved into two images in PNG-format. Larger PNG image can be used for print or presentation, while smaller version is provided as thumbnail on web-page article like this one. Filename of the saved PNG image set is matched to input datafile name. Image files will be overwritten if they already exist in current directory. Now that instrumentation and method is defined, we can return back to our DUT Keithley 2002 instrument. INL verification was performed on its base 20V range first. I’ve used modified procedure that tests random points within the range of the instrument to obtain worst possible INL error. Because reference 3458A DMMs have limitation at 12V maximum fullscale of their range, only +12 to -12V range was tested. This dataset is available below:
DSV-file with ±12V random test points for 3×3458A and two Keithley 2002
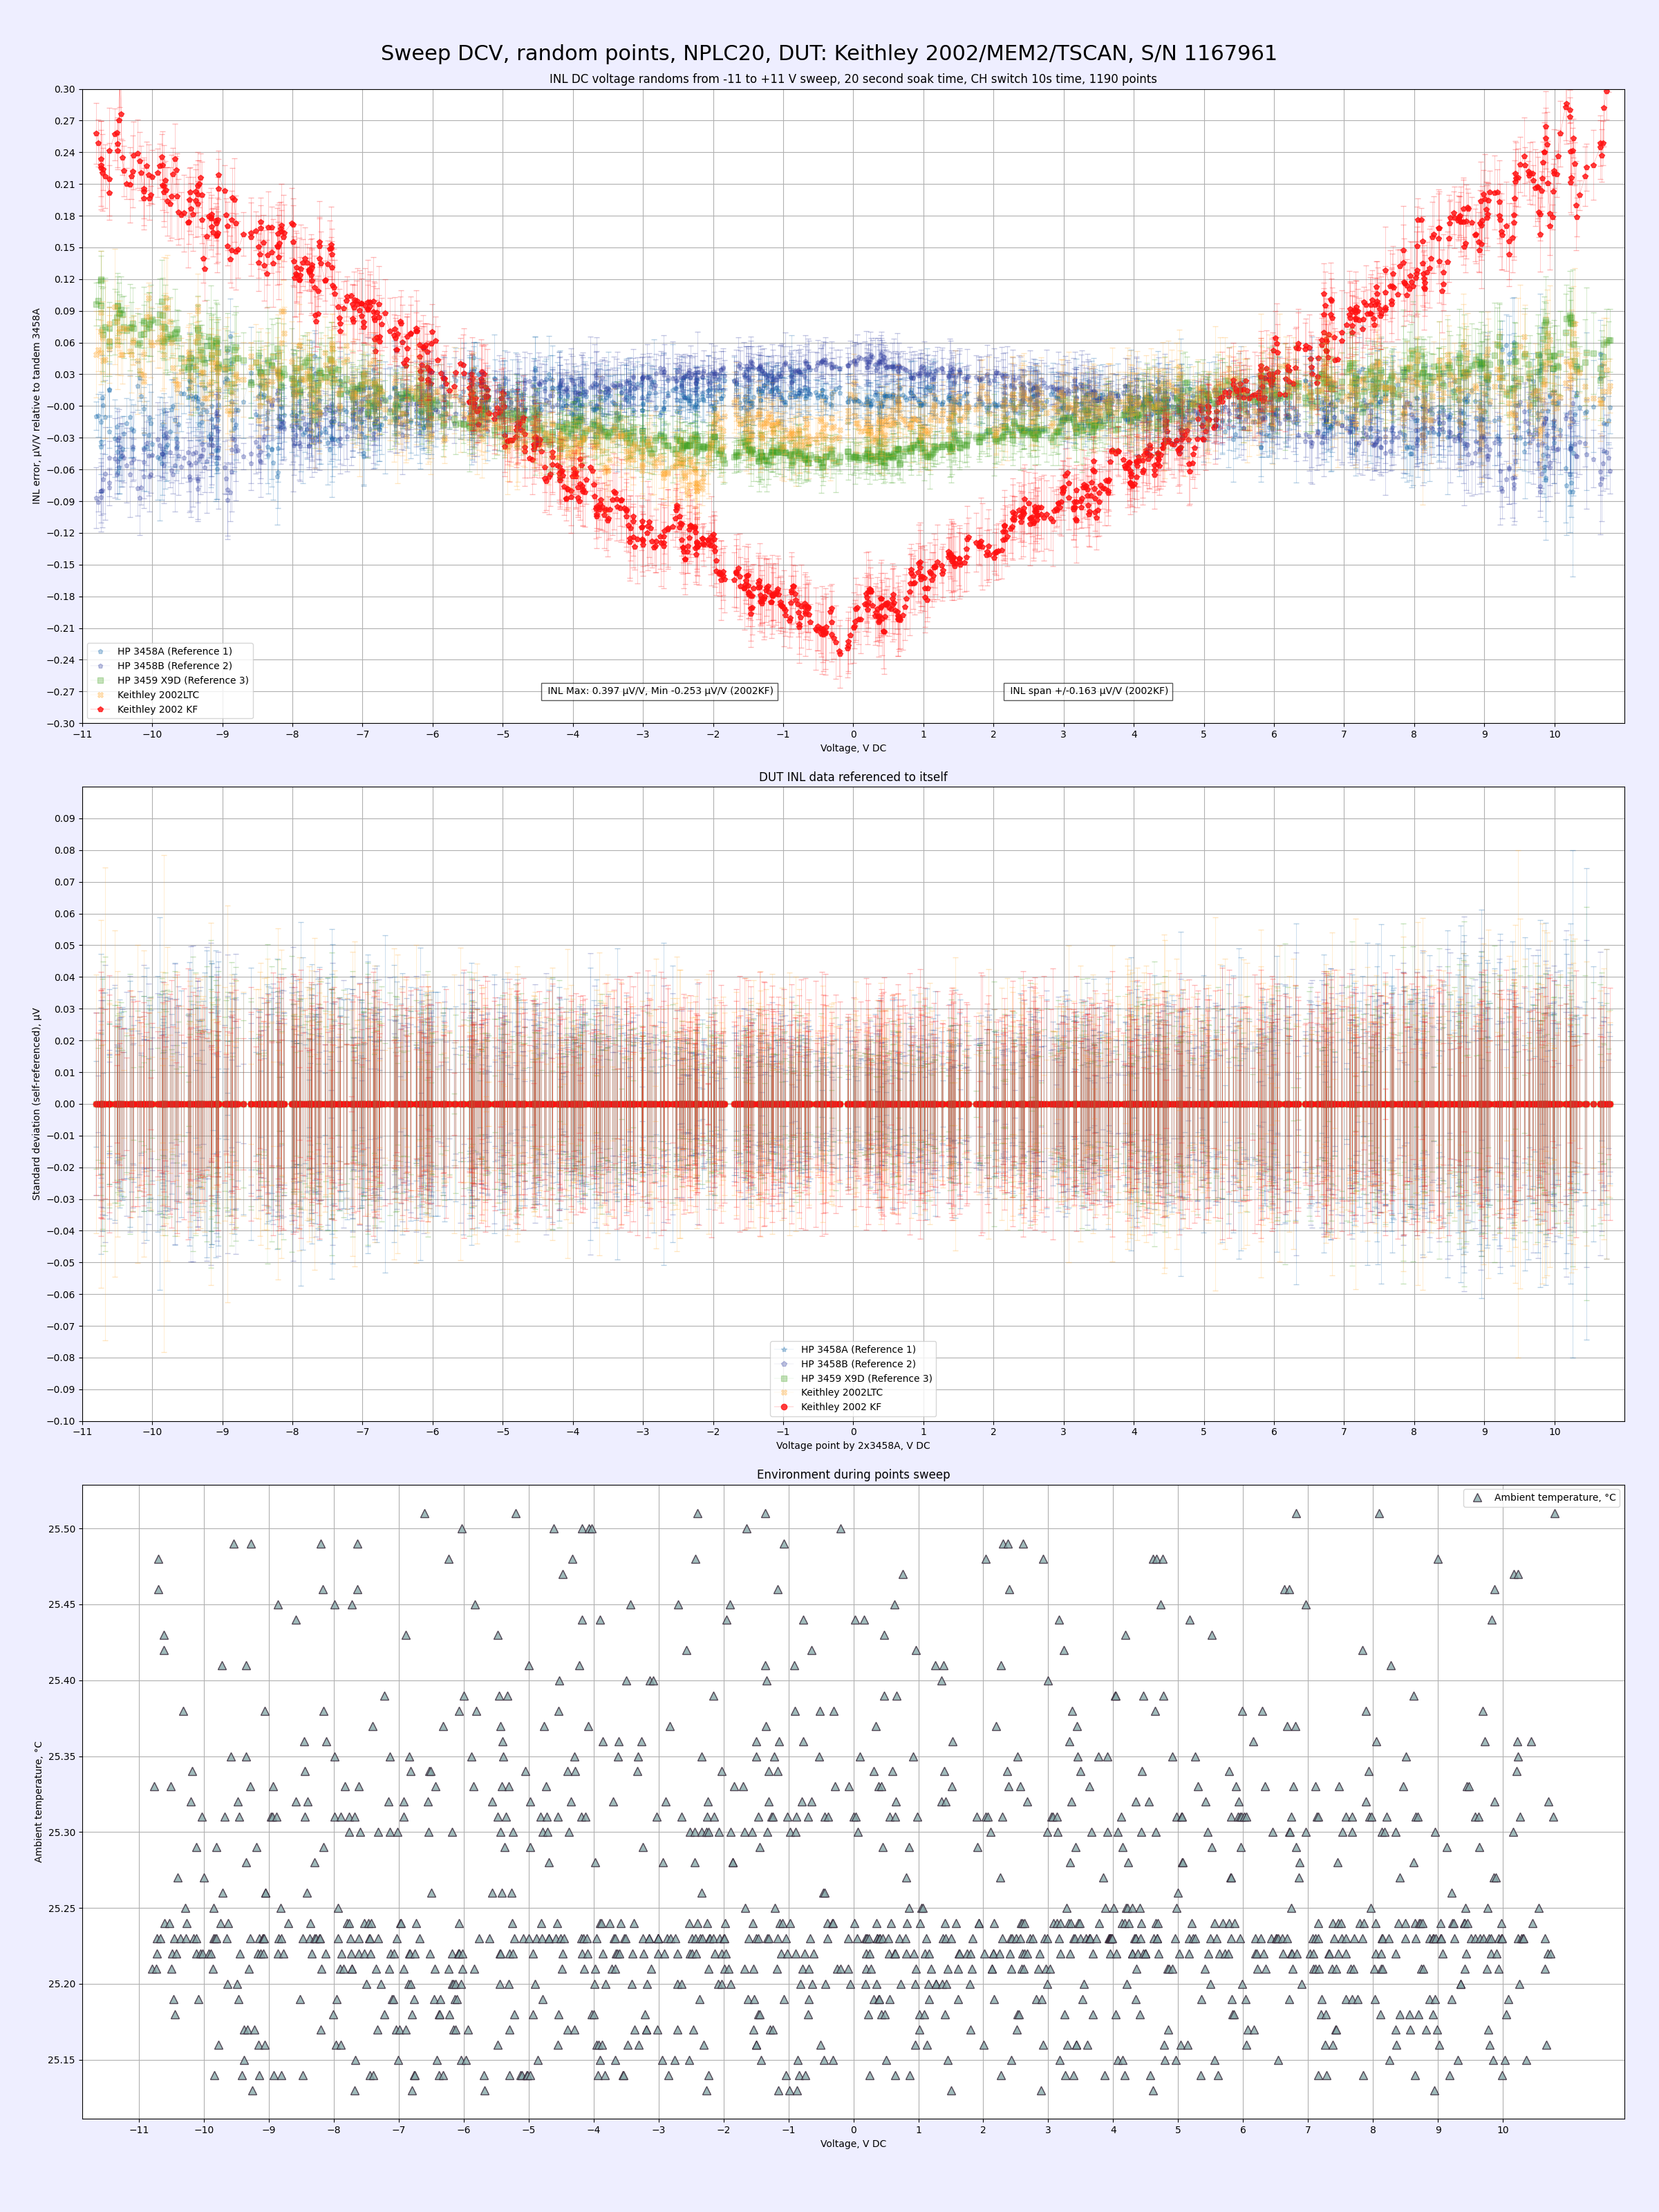
Image 23: ±11V span INL of Keithley 2002 under test + other DMMs
Actual script used to plot the charts can be downloaded here:
Python script for plotting 5 DMM data
Configuration file for script above
DUT Keithley 2002 data is plotted in red color. Vertical scale here is mere ±0.3 ppm of full-scale (12V for 3458A and 21V for 2002). Tandem of three different 3458A units used to correct calibrator’s INL output points. HP 3458A is a proven golden standard (short of quantum standard) for DC voltage linearity, so this is what used for as reference after multiple tests on our 3458As. As expected all HP meters demonstrate residual INL well under 0.1 ppm, typical for good working meters of this model. Keithley is quite impressive as well, with the worst error reaching +0.27 ppm close to -11 VDC point and +0.3 ppm around positive +11 VDC. Slope of the INL suggests small gain error residual from adjustment. This meter as result is capable of high resolution transfers on main range for DC voltages within ±0.3 µV/V or better.
Next test is to repeat the same experiment but limiting points to range from -2.1 to +2.1 to test 2.1V range of Model 2002s while keeping 3458A’s on same 12 V range. This dataset available below:
DSV-file with ±2.1 V random test points for 3×3458A and two Keithley 2002
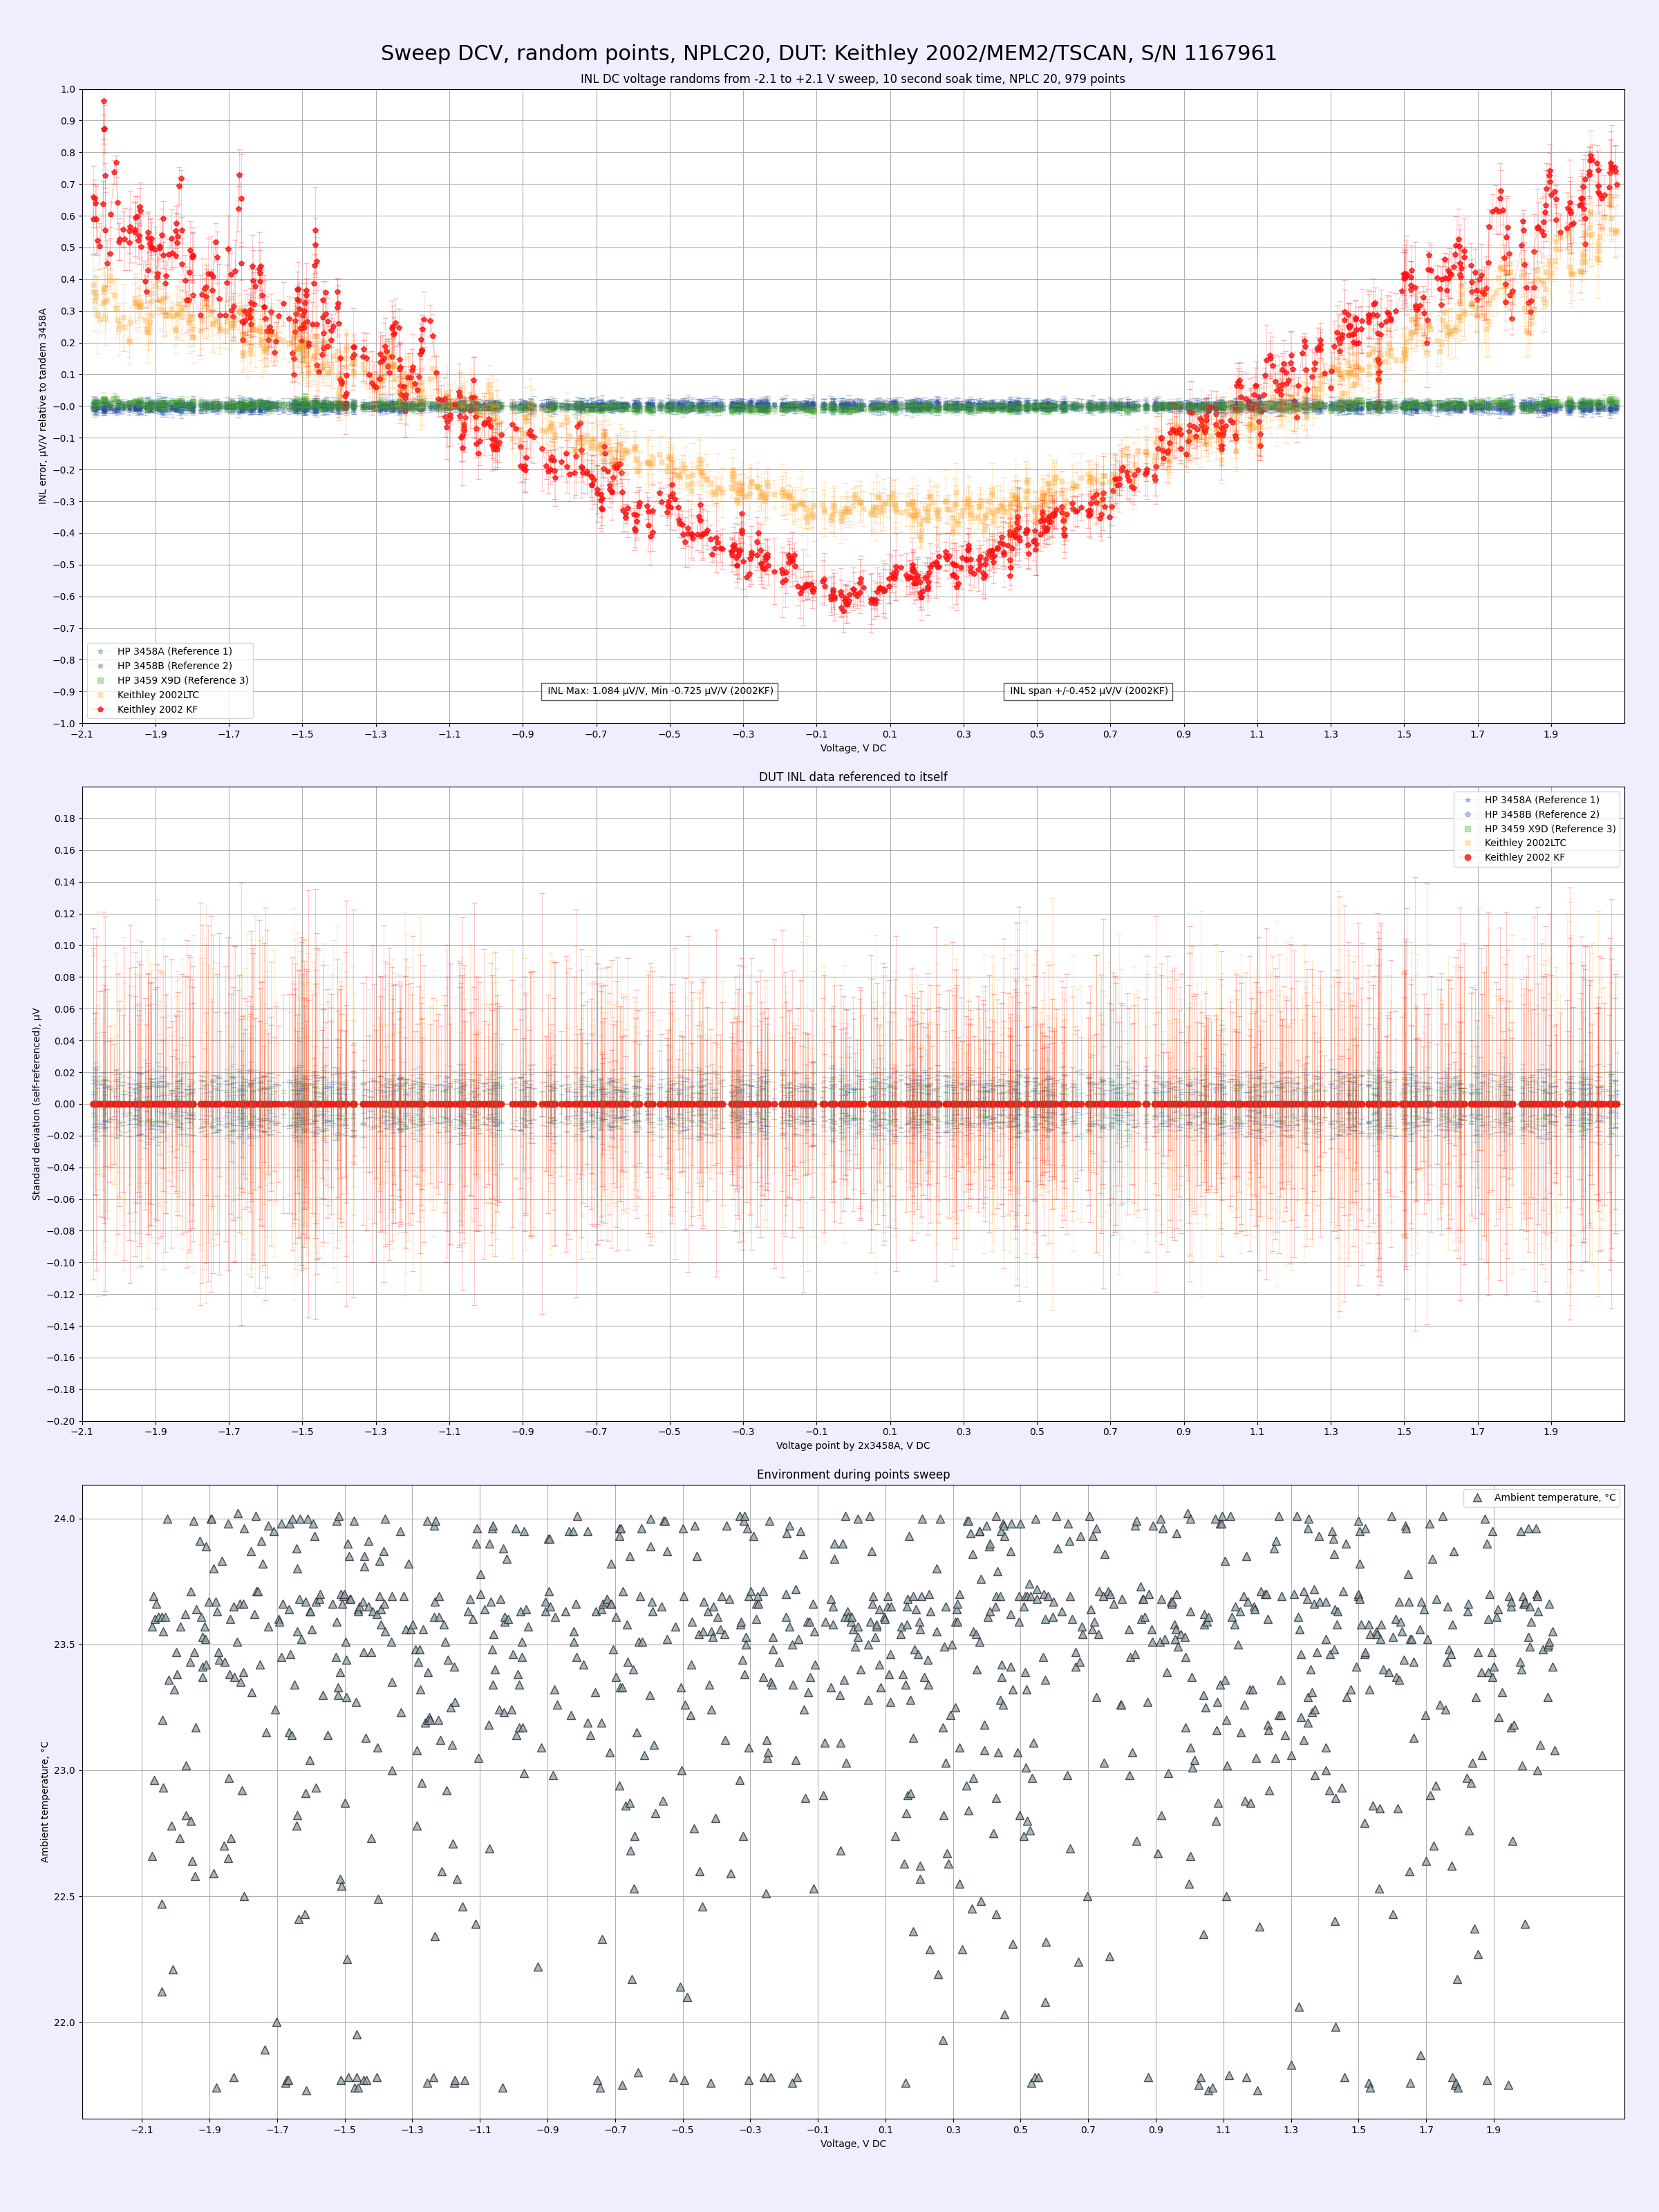
Image 25: ±2.1 V span INL of Keithley 2002 under test, after adjustments
The INL chart for 2.1 V range looks bit worse already but the slope is pretty much the same. Degraded INL on lower ranges is expected since there are more circuitry and amplifiers involved in ranges other than the core ADC range of the instrument. 3458A stayed in the best range, showing us essentially flat line performance from -2.1 to +2.1 V points. Notice the different vertical axis scale at ±1 ppm. Meter under test is in red color and matching pretty good to xDevs other Keithley 2002 unit (in orange points)
With this conclusion all calibration experiments are done for this Keithley 2002 and it was shipped to Norway on April 2, 2025 using commercial postal service. For extra protection Keithley 2002 was packaged in hard-shell plastic case together with branadic’s UPW50-104 10 kΩ travel resistance standard and battery-powered temperature datalogger. Hopefully it will arrive to the recepient intact and without leaked out ppms :).
AC/DC transfers between three Fluke 792A kits
During this CalFest Todd M. brought his AC/DC transfer standard Fluke 792A kit. In limited available time we managed to test most of the ranges at various amplitude and frequency points between his setup and Igor O. 792A that have calibration report with data points from Fluke PML, dated back to 2012. Fluke 792A is one of the most accurate and stable measurement instruments for AC Voltage metrology. This product consist of four main components:
- AC/DC Transfer Unit – contains Fluke thermal solid-state sensor, ranging attenuators for ranges above 2.2 V and amplifiers for ranges below 2.2 V
- Battery Power Pack – contains two 6 V lead-acid batteries, AC charger circuit and power regulator for ±11.5 V DC output to transfer unit
- Transfer Switch – provides interface and mechanical switch from N input to either INPUT 1 or INPUT 2 kelvin connection 5-way binding posts
- 1000V Range Resistor – external attenuator box for AC/DC transfers and measurements for 700 V and 1 kV range up to 100 kHz
792A kit is capable to support uncertainty better than 10 ppm for sweet spot ranges/frequency band, provides capability to accurately determine unknown voltages in range from 2 mV to 1kV in frequency range from 10 Hz to 1+ MHz and can be battery operated for most sensitive environments. To operate 792A needs external source of AC/DC voltages and digital voltmeter, such as 6½-digit or better DMM.
At the heart of the Fluke 792A is the patented Solid-State Thermal RMS sensor, which has been proven in a variety of Fluke products since 1979. Its output voltage is 2V, compared to the 7 to 10 mV output of traditional thermal converters. This large 2 V output also permits you to make measurements with high resolution using standard affordable digital voltmeter instead of sensitive nanovoltmeters. A simplified diagram of the rms sensor is shown in Image 75. The sensor chip itself consists of two closely matched thermal voltage converters that use the temperature sensitivity of the transistor base-emitter junction in the place of the traditional thermocouple.
External to the sensor chip is an error amplifier that is used to drive the second or feedback resistor/transistor pair. The output of the circuit is a DC voltage linearly proportional to the rms value of the input signal. Design requirements necessitated several modifications to the sensor and essentially pushed the sensor design to obtain the low noise, wide dynamic range, and fast settling time needed.
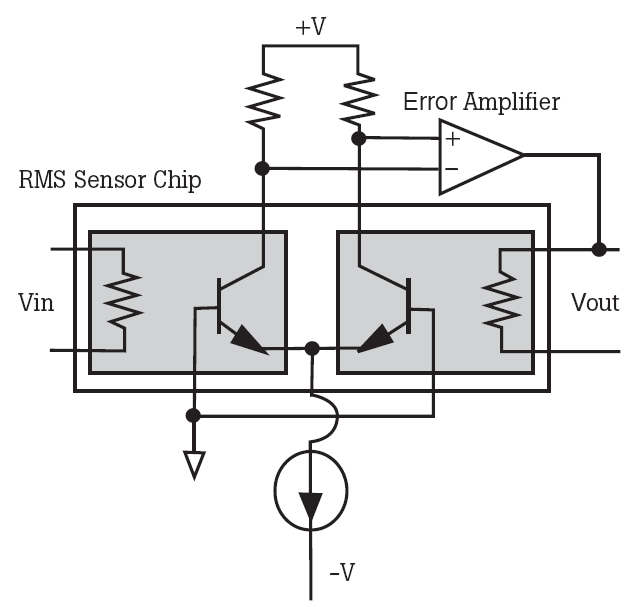
Image 75: Fluke Thermal RMS sensor. Courtesy Fluke 792A Application note
The FTS circuit converts the AC or DC signal at its input into a DC voltage equal to the RMS value of the input. The FTS consists of two identical islands suspended in air, each containing a heater resistor and an NPN transistor. Each island provides close thermal coupling between the resistor and transistor. Between islands, there is high thermal isolation. As shown in the schematic, these two transistors are connected as a differential gain stage with a differential input voltage of zero volts. Applying a voltage to the resistor on one of the islands causes that island to heat up. This in turn heats the transistor, reducing its base-emitter voltage causing an imbalance in the differential collector current. This differential current change is converted to a single-ended error current by the current mirror consisting of the two PNP transistors of U101. Op-amp U102 integrates this error current, converting it to an error voltage. The output of U102 pin 1 is then passed through a square-root circuit consisting of the other half of U102 and U103. The resultant error signal is then applied to the other side of U5 through R103, heating up that side of the sensor. When the heat on both islands of the FTS is equal, the differential error current reaches zero and the circuit is in equilibrium.
From previous Fluke 5790A repairs at xDevs we salvaged few of these broken sensors, so here’s teardown of the dead sensor apart to have a quick peek of it’s internal design as well. The chip itself have original Fluke logo and have design year date 1986.
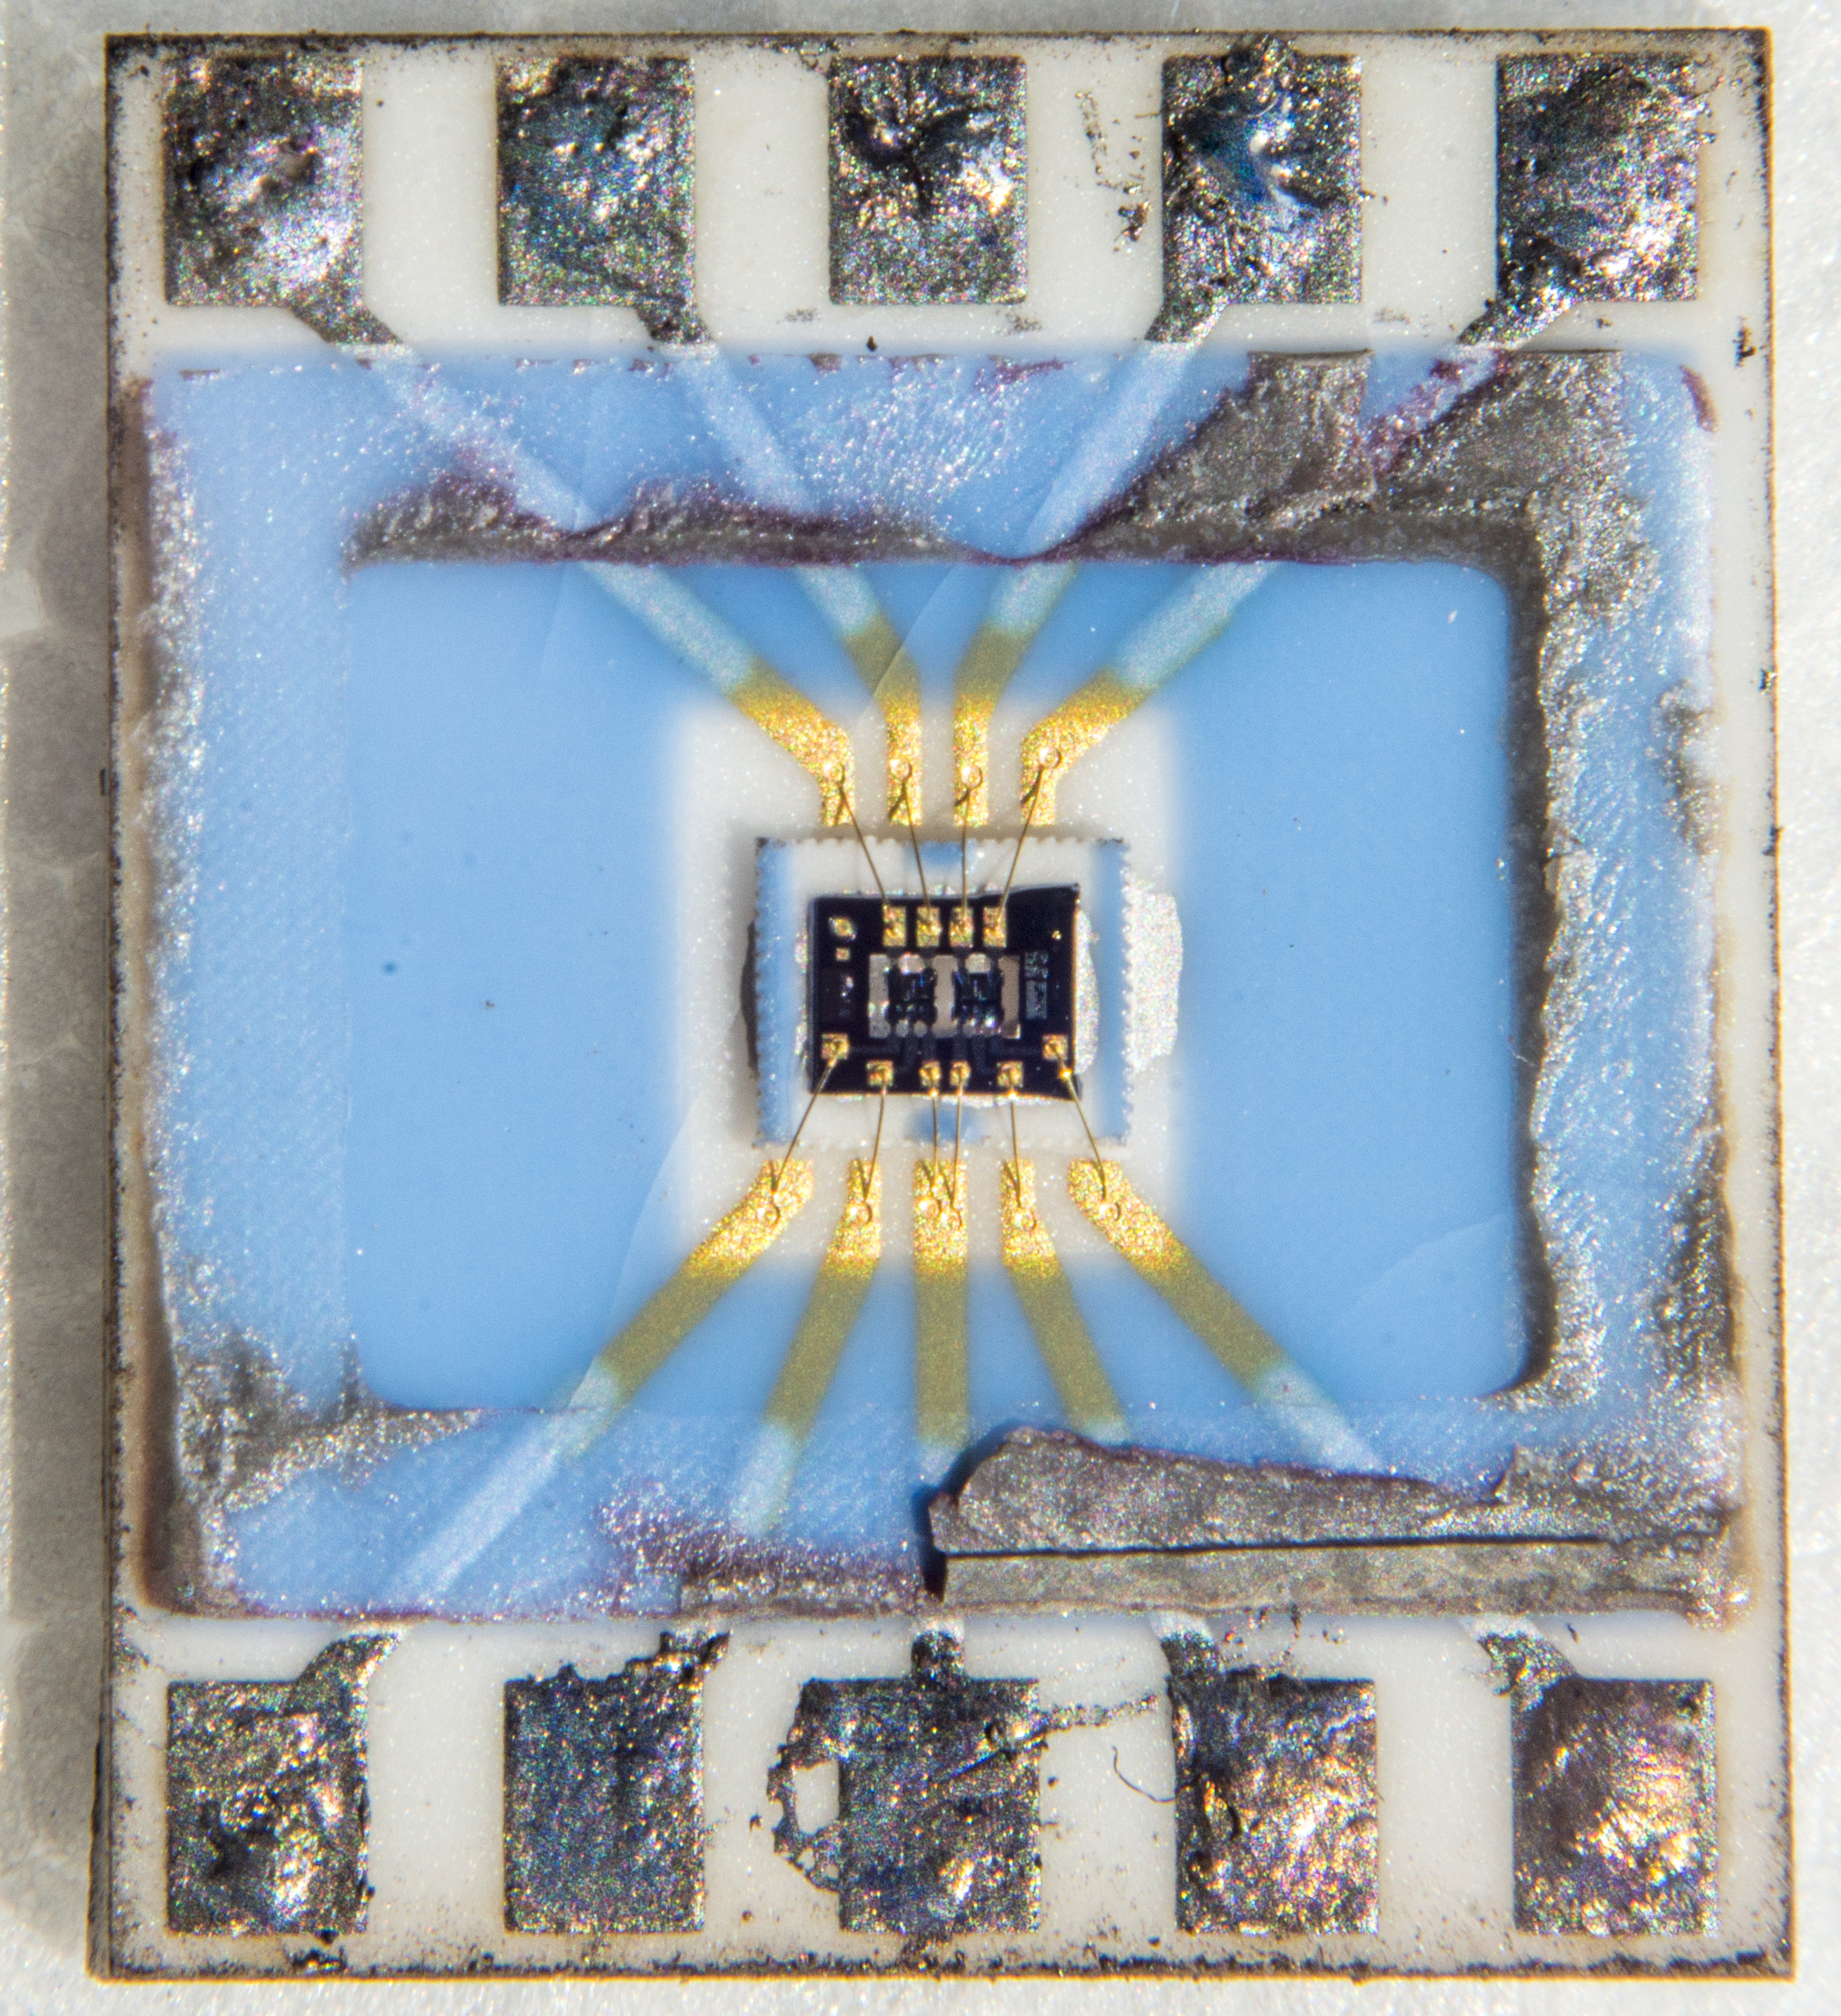

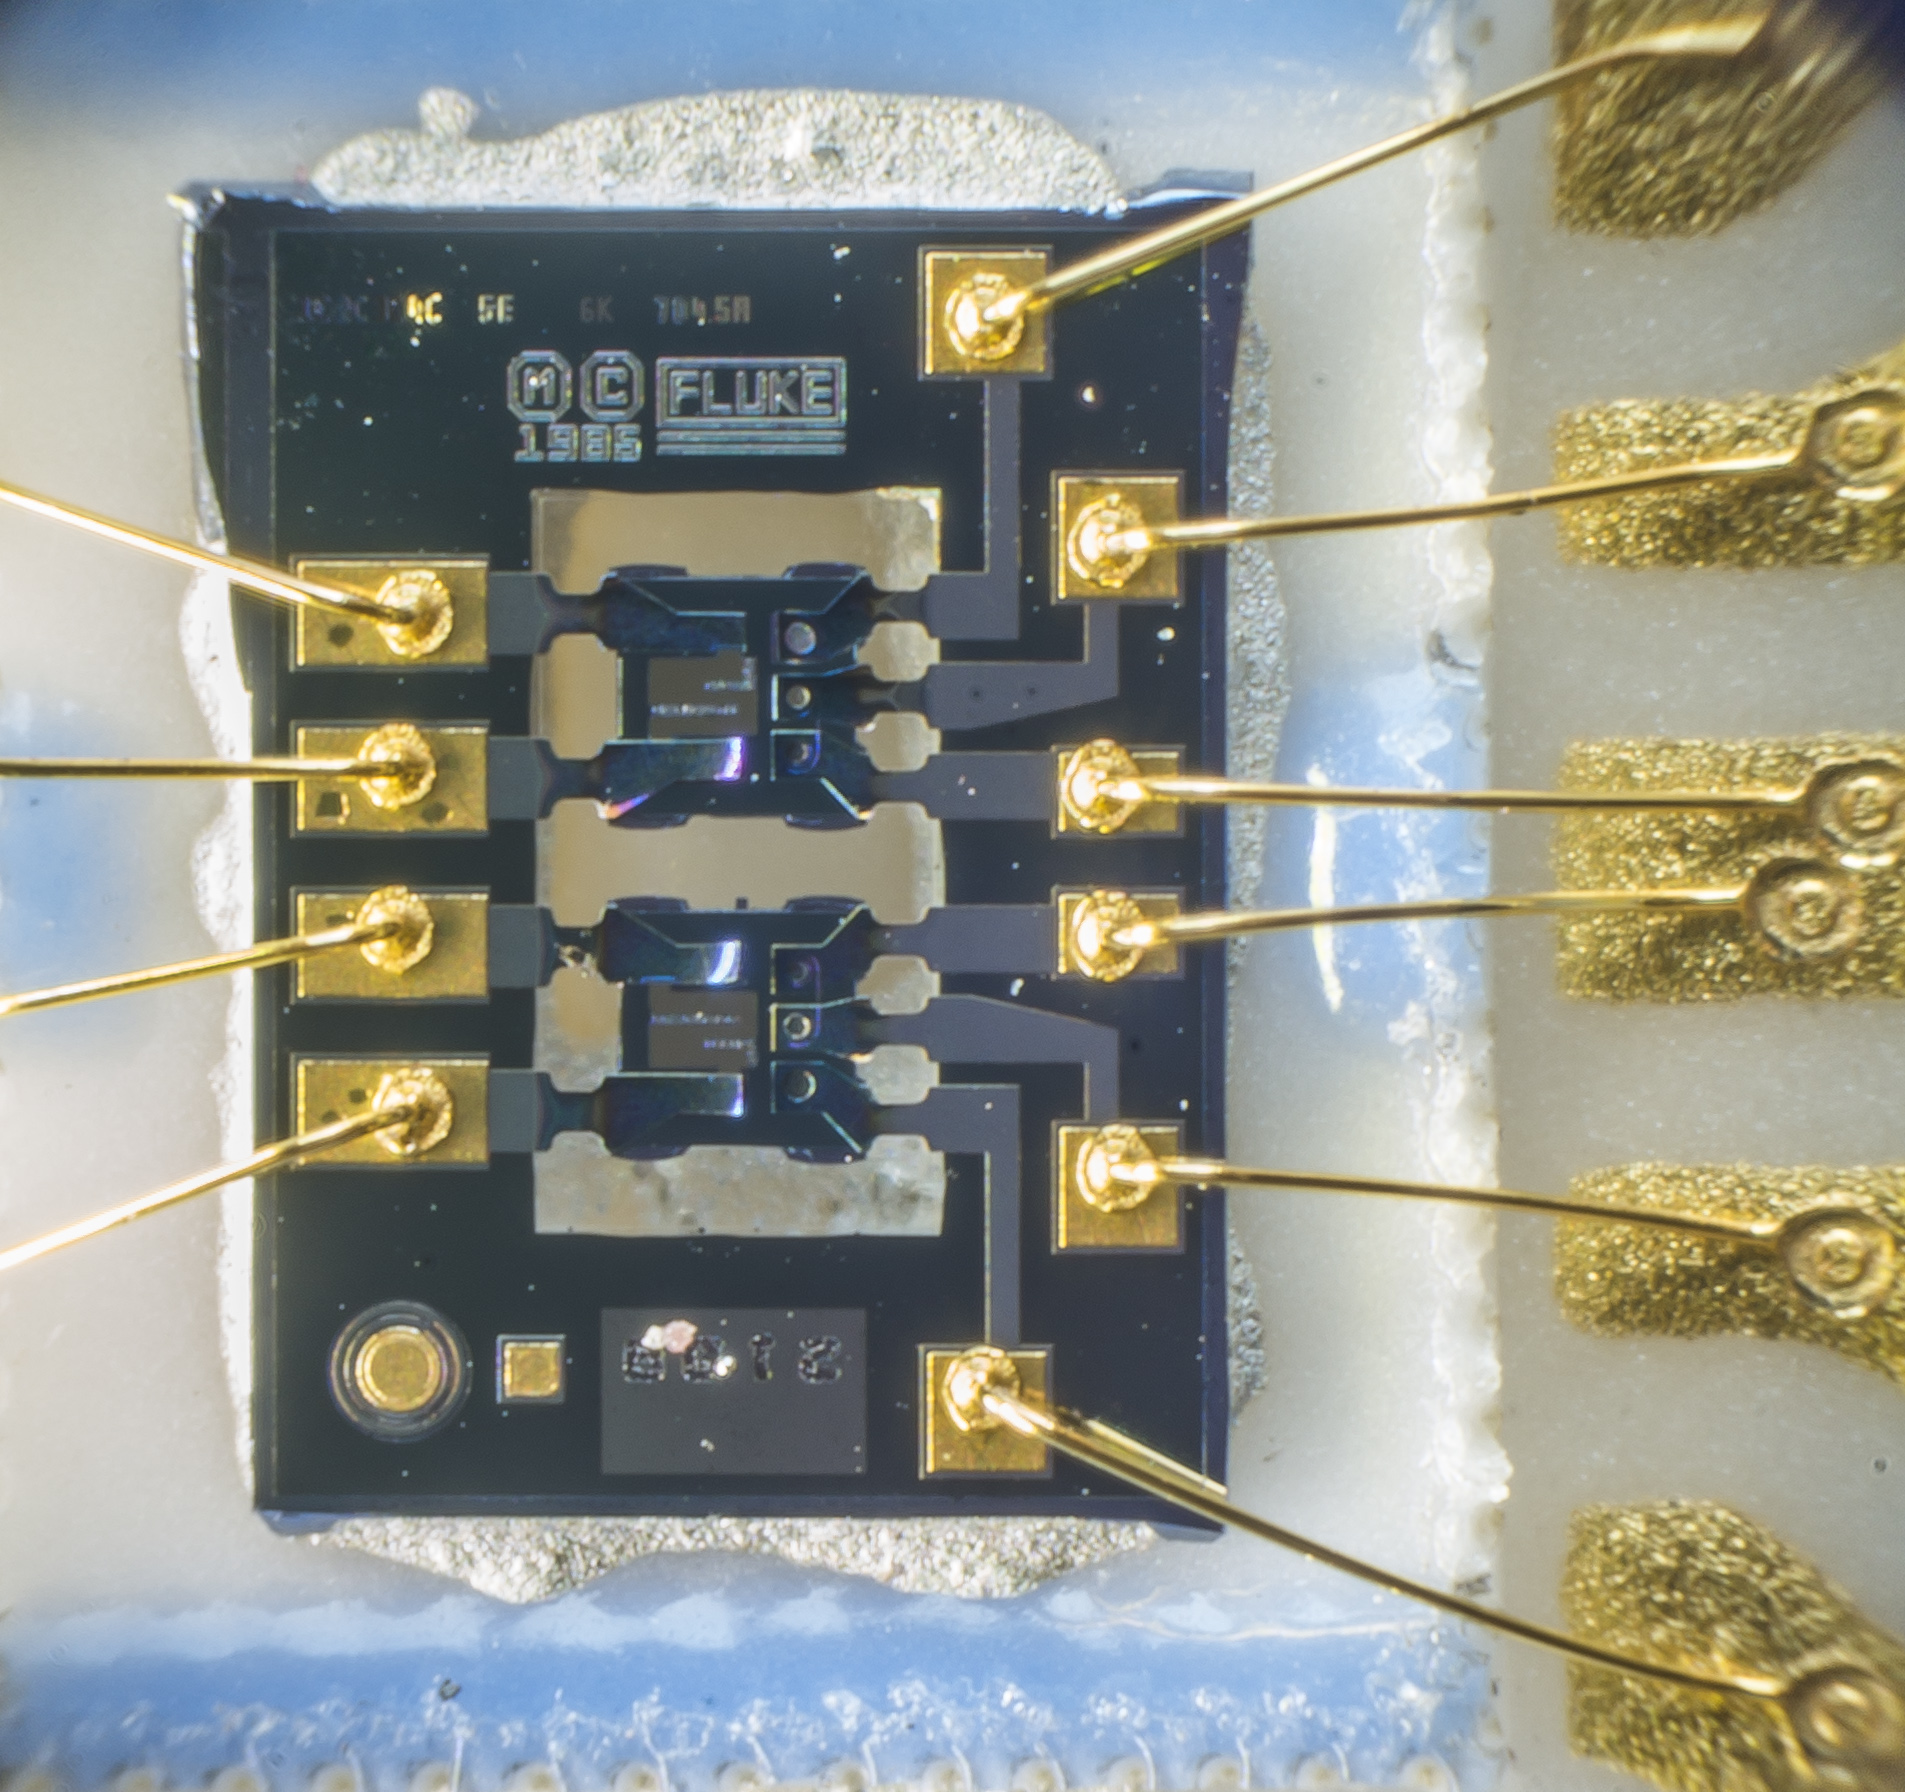
Image 76-78: Fluke Thermal Sensor hybrid chip teardown
This sensor chip build with three design features:
- Silicon die with input and isolated output sections.
- Small alumina interposer carrier for silicon die to decouple mechanical stress.
- Main alumina substrate with metallized traces for mechanical assembly.
For more teardown photos and details of internal Fluke 792A construction be sure to check our original article about 792A from Todd.M.. Even better microscope images were captured by our friend Richi and provided on his website.
![]()
Please check his amazing website for a deep dive into beautiful world of electronic chips design. Now let’s go back to the metrology experiments and check the traceability map for the AC/DC transfers performed within the timeframe of this CalFest 2025.
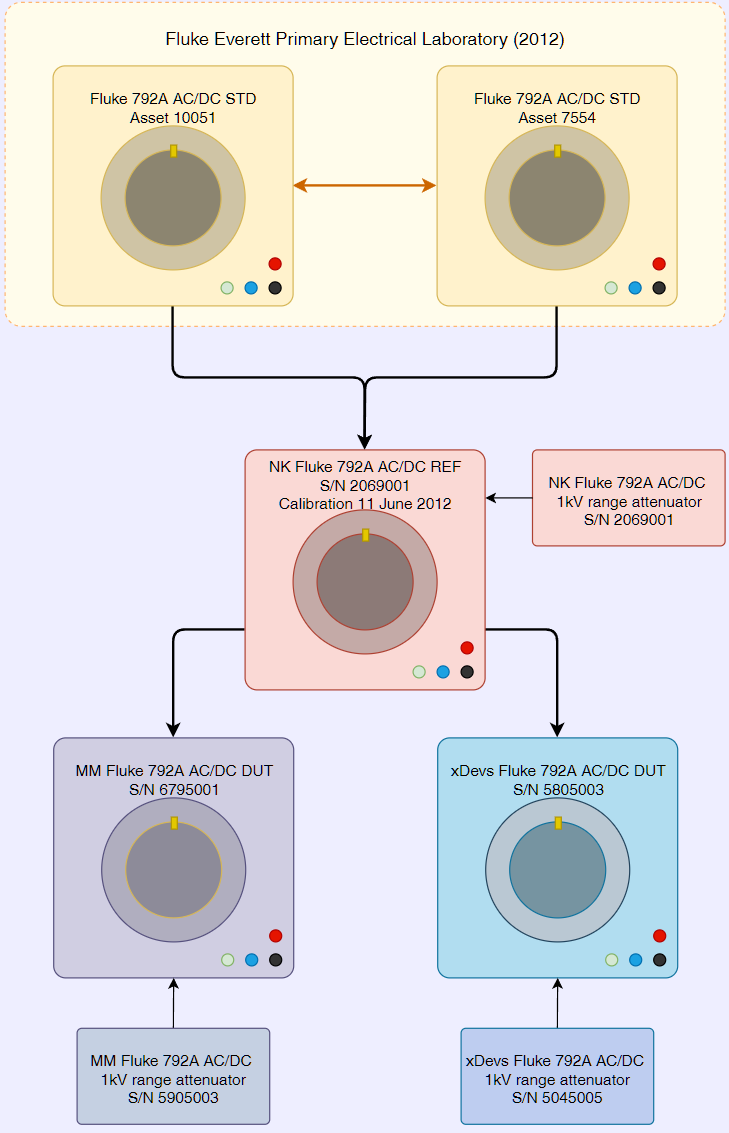
Motivation of these comparisons were to establish the points difference and flatness performance understanding between different 792A’s. Measurement procedure was using Fluke 5720A as a stable DC and AC source and replicated the procedure outlined in by Fluke for their 792A production calibration process. Both 792A were operated from respective 792A battery power packs, isolated from the AC mains. Actual setup depicted on the following block diagram with all connections shown in details:
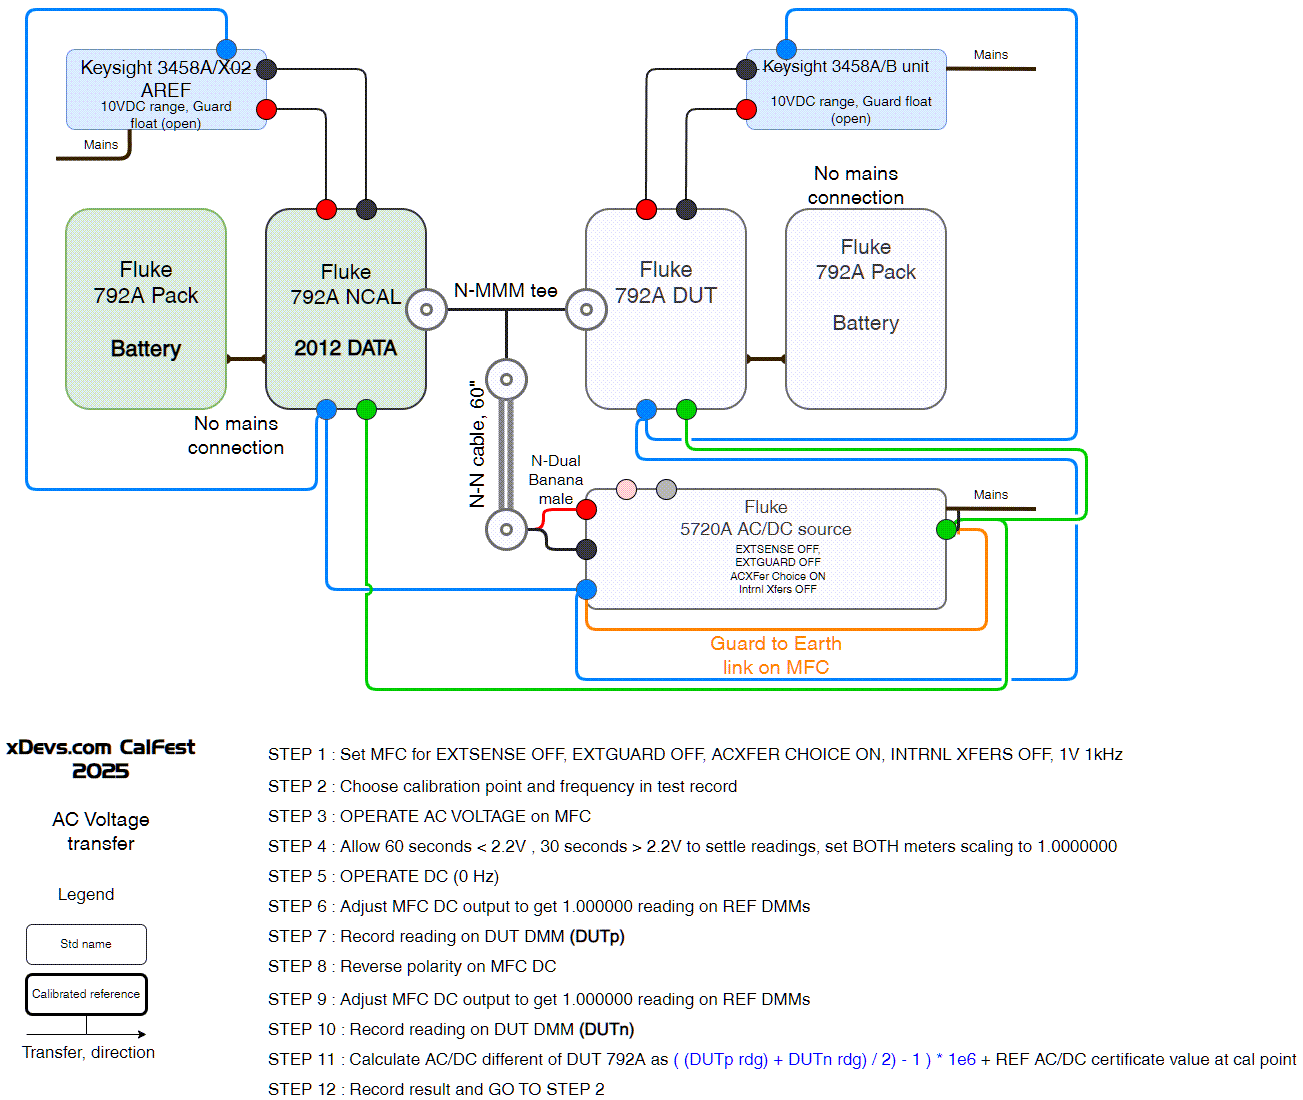
Physically 5790A was attached to 792A with direct N-tee without any cables, since even short cables would affect the frequency response of the setup, especially at higher frequency over 10 kHz.
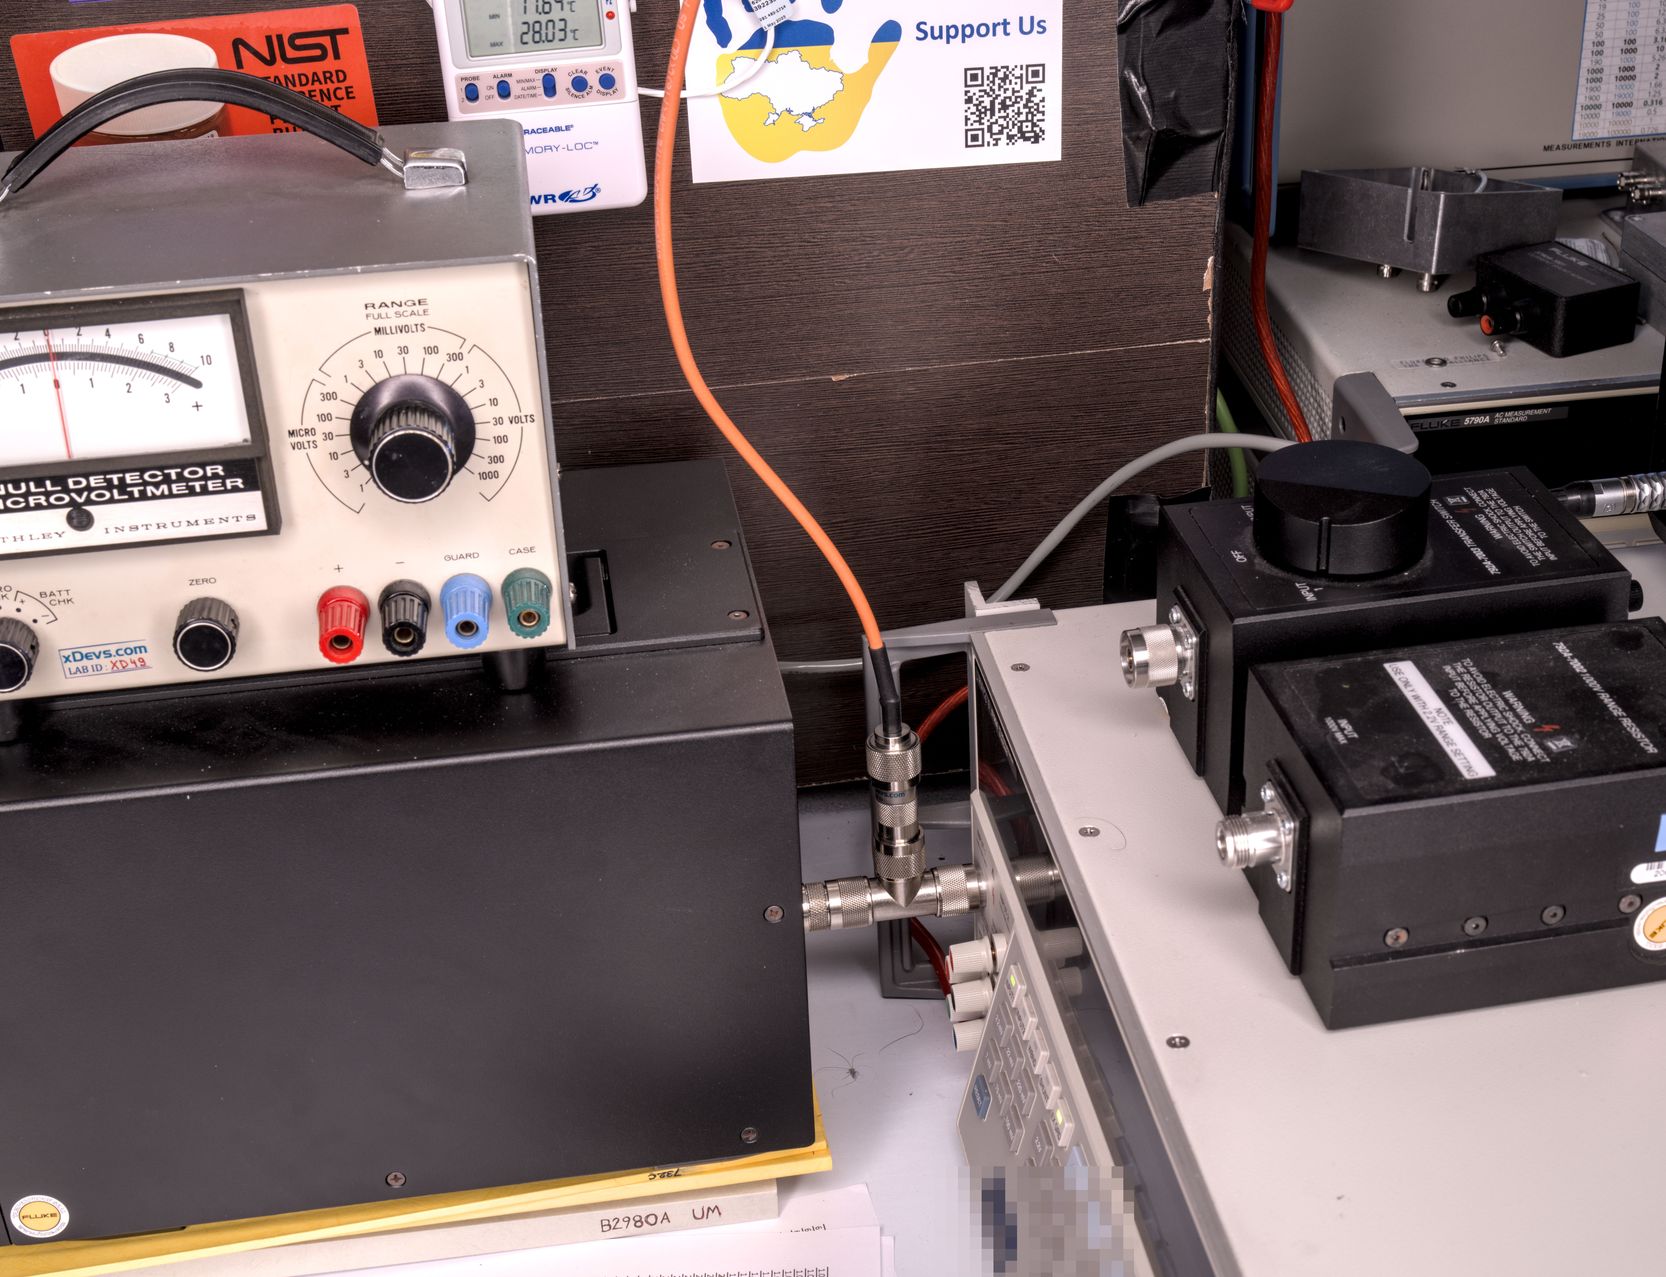
Overall photo of the calibration bench with all the toys. Calibration source is Fluke 5720A in the right corner, together with 5725A amplifier for high voltage test points.
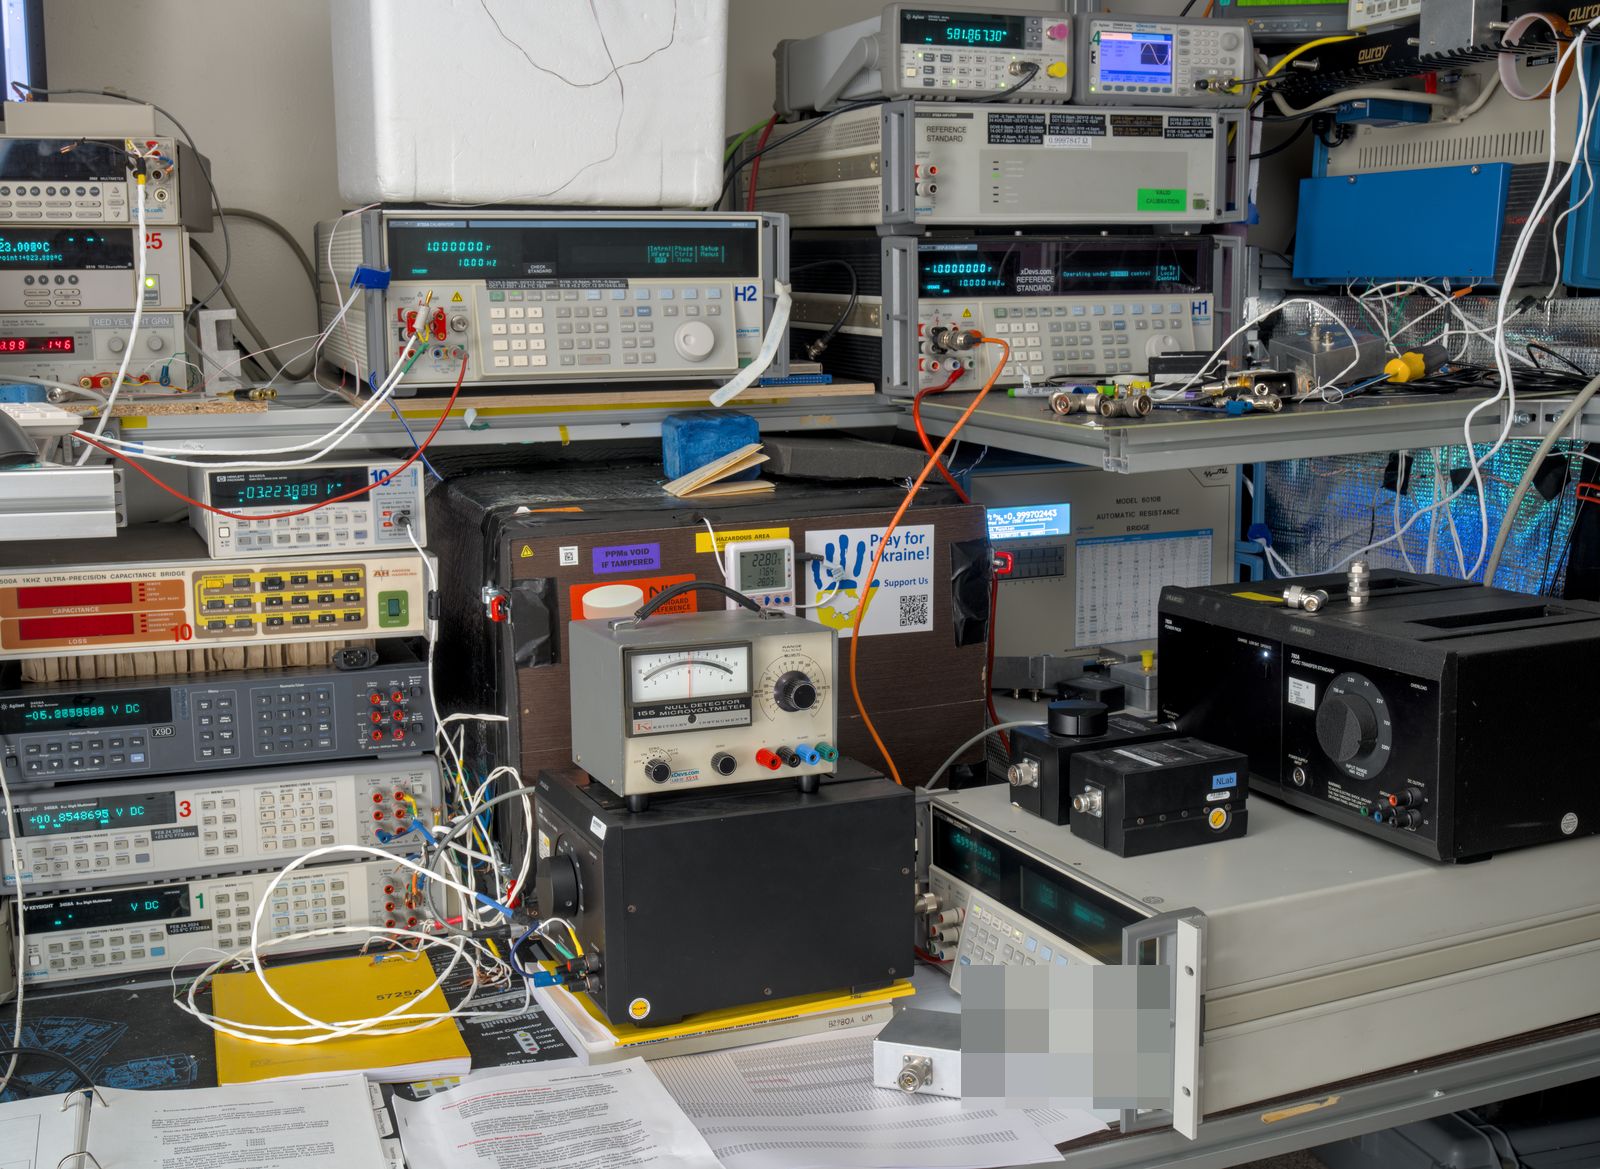
Transfers to MM’s 792A S/N 6795001 from NLab 792A S/N 2069001
Now take a look to the processed AC/DC transfer error analysis results from one week of measurements.
220 mV range AC/DC calibration:

Primary 2.2 V range AC/DC calibration:

7 V range AC/DC calibration:

22 V range AC/DC calibration:

70 V range AC/DC calibration:

220 V range AC/DC calibration:

High voltage ranges AC/DC calibration. For this test mismatched Fluke 792A-7002 1kV attenuator S/N 5905003 was attached in front of MM’s 792A, and matching 792A-7002 attached to reference 792A side. This is interesting test, since DUT attenuator was acquired separately from the AC/DC transfer unit, but normally both parts must be matching and calibrated together. Both Fluke 792As configured to 2.2V range as directed by instruction manual, since high voltage attenuator forms a fixed ratio divider with the internal 400 Ω of the FTS sensor on base range.

Summary of all tested points is available in following generated PDF-report table group:
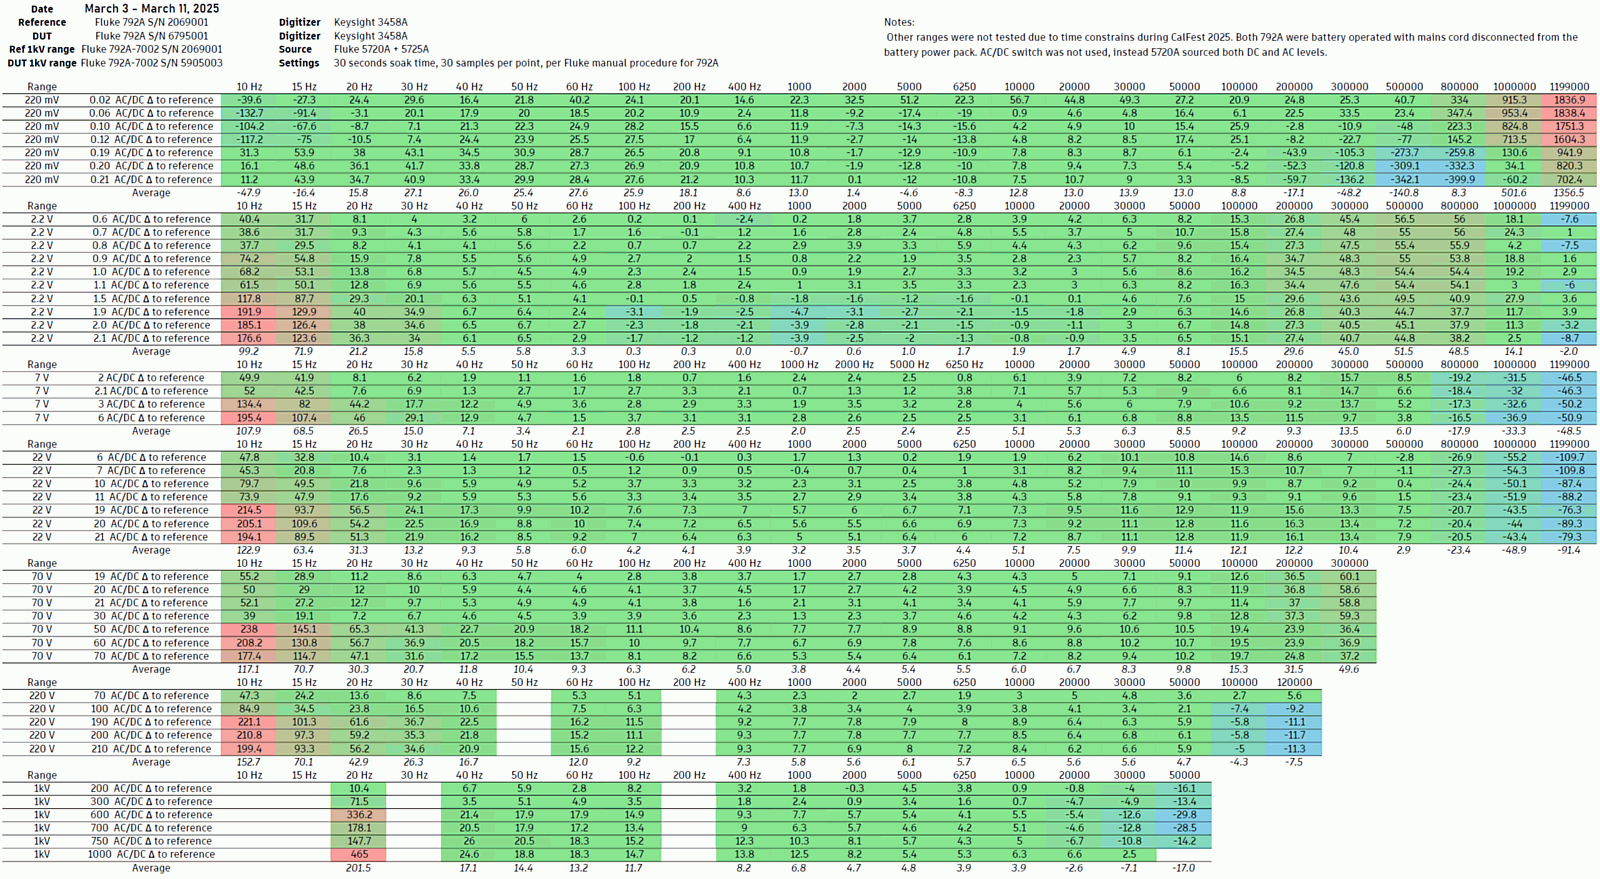
And same data in printable PDF-format for future reference. Overall AC/DC transfer experiment is considered a success here and now we have some confidence that Todd M. Fluke 792A may be actually still able to meet factory uncertainty for non-traceable measurements and ACV calibrations.
Calibration transfer report for MM’s Fluke 792A S/N 6795001, March 11 2025
Due to time limitation 22 mV and 700 mV ranges were not calibrated or tested. Each range takes about 12-15 hours to complete due to large number of voltage-frequency combinations. There is also dead time in between runs due to need of charging batteries in 792A Power Packs. But overall results of agreement between different 792A are pretty impressive given the last accredited calibration from decade ago. Voltage points on most ranges in frequency band from 40 Hz to 30000 Hz mostly demonstrated single digit ppm (µV/V) agreement on the AC/DC error, relative to reference Fluke 792A 2069001 calibration certificate.
Transfers to xDevs’s 792A S/N 5805003 from NLab 792A S/N 2069001
All the same process is also repeated to our very own 792A kit S/N 5805003, also with mismatched 792A-7002 high voltage attenuator block. Measurements for our in-house standard were performed in a period from February 2025 until April 2025 with some gaps in between.
22 mV range AC/DC calibration:

220 mV range AC/DC calibration:

700 mV range AC/DC calibration:

Base best performance 2.2 V range AC/DC calibration:

7 V range AC/DC calibration:

22 V range AC/DC calibration:

High voltage ranges AC/DC calibration is the last test. For this test mismatched Fluke 792A-7002 1kV attenuator S/N 5045005 was attached in front of our DUT 792A, and matching 792A-7002 attached to reference 792A side. This is interesting test, since DUT attenuator was acquired separately from the AC/DC transfer unit, but normally both parts must be matching and calibrated together. Both Fluke 792As configured to 2.2V range as directed by instruction manual, since high voltage attenuator forms a fixed ratio divider with the internal 400 Ω of the FTS sensor on base range.

Summary of all tested points is available in following generated PDF-report table group:

And same data in printable PDF-format for future reference. Overall AC/DC transfer experiment is considered a success here and now we have some confidence that our own Fluke 792A may be actually still able to meet factory uncertainty for non-traceable measurements and ACV calibrations.
Calibration transfer report for xDevs Fluke 792A, April 11 2025
AC/DC transfers and calibration with Todd’s Fluke 5790A against 792A AC/DC reference
Actual setup used for 5790A AC/DC calibration is depicted on the following block diagram with all connections shown in details:
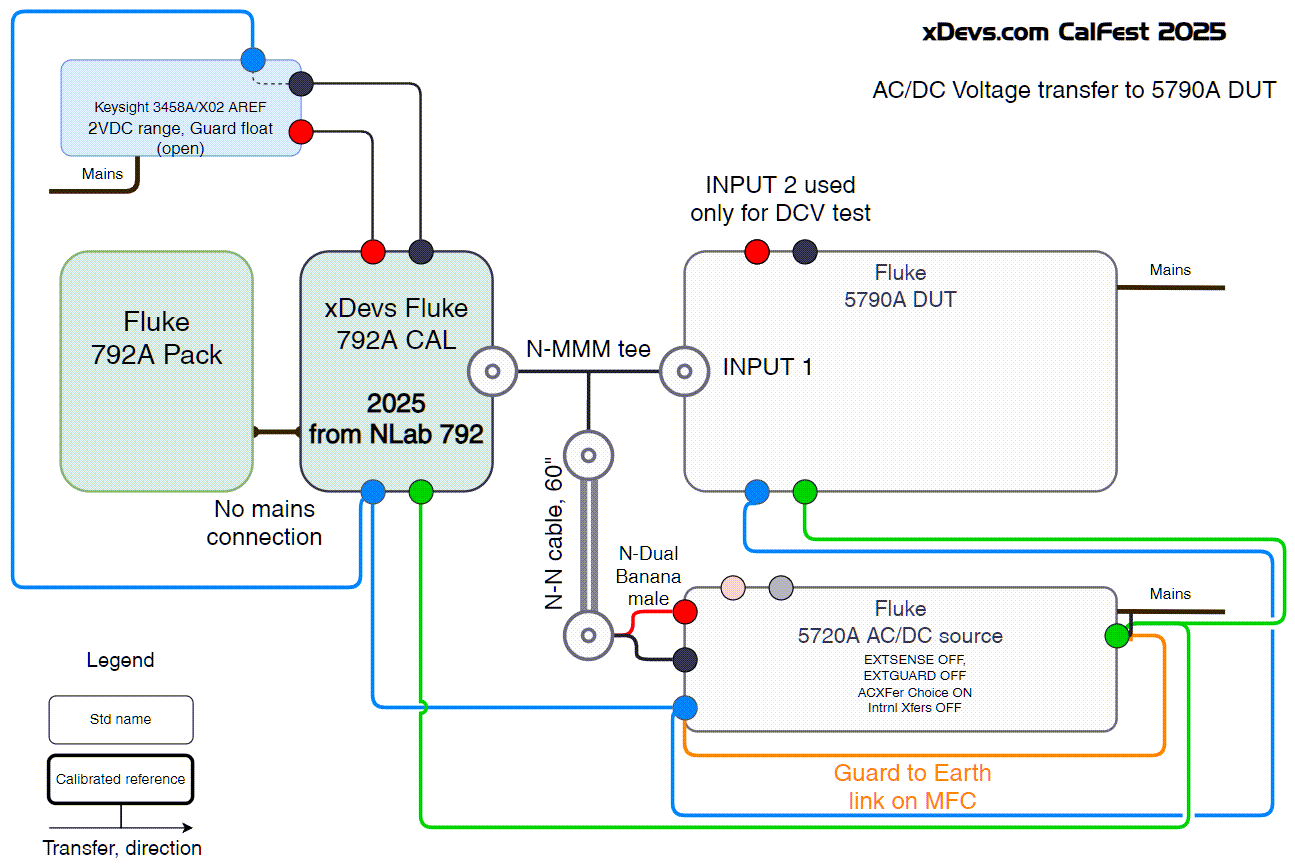
Calibration report for MM’s Fluke 5790A relative to NLab 792A, March 11 2025
Repair, teardown and documenting for Fluke 9610A/9640A RF reference sources
On March 7 we have organized a long livestream from the lab, taking apart two Fluke instruments:
- Model 9610A/AF RF reference source, capable to generate precise leveled signals with frequency up to 4 GHz
- Model 9640A RF reference source, capable to generate precise leveled signals with frequency up to 4 GHz
This 3.5 hour long stream showcased process of both instruments disassembly, a look on various components and circuit blocks. Half of the video was dedicated to demonstrate long-exposure photography methods used at xDevs for those high-resolution images you all like to see on the pages here. Todd was explaining some troubleshooting and assembly steps, while Illya managed cameras :)
There will be separate article with all the details and hi-res images about both of these interesting instruments.
Conclusion and future plans
This year CalFest was a blast once again with special guests and additional side activities. Visit to few friendly labs was fun part of this meetup and excellent opportunity to discuss aspects of today’s technology in person. As for CalFest 2025, it’s core idea remains the same: bring electronics and test equipment enthusiasts together and share the precision calibration projects among members and friends. We would love to include other geography members too, but logistically it’s already quite a challenge, considering that this is not a sponsored or business funded activity but a free time self-funded enterprise for all of the participants.
Projects like this are born from passion and a desire to share how things work. Education is the foundation of a healthy society - especially important in today's volatile world. xDevs began as a personal project notepad in Kherson, Ukraine back in 2008 and has grown with support of passionate readers just like you. There are no (and never will be) any ads, sponsors or shareholders behind xDevs.com, just a commitment to inspire and help learning. If you are in a position to help others like us, please consider supporting xDevs.com’s home-country Ukraine in its defense of freedom to speak, freedom to live in peace and freedom to choose their way. You can use official site to support Ukraine – United24 or Help99. Every cent counts.
Modified: Oct. 26, 2025, 12:04 a.m.