- USA Calibration club concept
- Keithley 2002 8½-digit DMM calibration
- L&N 4040B resistance standard for USA CalClub Round 3
- Long term drift and stability test of the USAC FX 10V zener reference
- Conclusion
USA Calibration club concept
Few years back a number of people at the metrology section of EEVBlog forum decided to organize an inter-comparison experiment with the small and inexpensive travel set of references for DC voltage and resistance. All of us have digital multimeters, ohmmeters and perhaps few signal sources. These comparisons were mostly dedicated to geographic area (to limit international shipping costs) and were called USA Cal Club Round 1 and Round 2 and EU Cal Club.
Handheld DMM usually don’t have any serious performance figures to worry about re-calibration in hobby or small business end use environment. But the story about a benchtop DMM with resolution 6½-digits or higher is quite different. Many of us buy the older instruments on used market, and often we are lucky if these meters come with original packaging and cables. It is somewhat naive to expect instruments from eBay garage, often manufactured 30 years ago to meet factory specifications of the new tested units. There are commercial labs that test and calibrate typical DMMs, but fees to test even a typical 6½-digit HP 34401A starts already at $200 USD or more. And to maintain history and monitor the health of the gear, such external calibrations should be done in a periodic manner. Prices can spiral to thousands very fast, proven that even small hobby labs might have multiple different instruments. Big labs often invest in doing some or all of this calibration work in-house with their own multi-purpose calibration equipment and reference standards.
Alternative to buying calibrators which can cost like a luxury car is to team up a few hobby basement labs into a friendly “club” community to share the accredited calibration burdens across multiple members to help everyone with better measurements and metrology transfers. If even few members have good stable known standards then their high quality measurements can be transferred to everyone and the community can produce better results.
Better results help to gain more confidence in measurements and compare projects with better uncertainty. Of course such mini-lab package experiments is NOT supposed to be a replacement or substitution to full calibration and adjustment that commercial labs CAN do (but not always WILL do ;), but rather alternative method to do limited number of checks and obtain at least some data of clubs’ reference standards and confirm instruments good health.
Metrology is a field of science and engineering that is impossible to do alone, no matter how perfectly good and stable your equipment is. Without frequent comparisons to other laboratories and without cooperation with national NMLs who realize ultimate representation of SI units, isolated lab have no means to guarantee accuracy and quality of their results. Even national laboratories who purchased and operate quantum standard would still need a formal and direct link to international realization of SI units via BIPM and chain of comparisons. BIPM has an online database KCDB that hosts reports and data of those comparisons, so each laboratory results and quality of measurements can be independently confirmed and checked.
In this article we are not trying to compete with the amazing work that BIPM do with international comparisons but instead replicate their idea on a much smaller, individual’s labs level. We may be small, but we can still dream big and hope to obtain lower uncertainty some good day too.
Disclaimer
Redistribution and use of this article, parts of it or any images or files referenced in it, in source and/or binary forms, with or without modification, are permitted provided that the following conditions are met:
- Redistributions of article must retain the above copyright notice, this list of conditions, link to this page (/article/usac_2023/) and the following disclaimer.
- Redistributions of files in binary form must reproduce the above copyright notice, this list of conditions, link to this page (/article/usac_2023/), and the following disclaimer in the documentation and/or other materials provided with the distribution, for example Readme file.
All information posted here is hosted just for education purposes and provided AS IS. In no event shall the author, xDevs.com site, or any other 3rd party be liable for any special, direct, indirect, or consequential damages or any damages whatsoever resulting from loss of use, data or profits, whether in an action of contract, negligence or other tortuous action, arising out of or in connection with the use or performance of information published here.
If you willing to contribute or have interesting documentation to share regarding pressure measurements or metrology and electronics in general, you can do so by following these simple instructions.
Calibration kit as received

Image 1: Everything as received for USA Cal Club travel kit checks
This year USA Calibration Club setup was shipped with regular courier postal service and received for verification on November 16, 2022. It included a travel LTZ1000A-based xDevs.com FX 10V reference with a cable to power it up.
Also high performance 8½-digit Keithley 2002 DMM was shipped together with kit to enable better results and checks for the pivot Randall’s hobby lab. This Keithley 2002 is NOT a part of calibration travel kit and is not shipped to every calclub member, but rather a check DMM to help with better group measurements. Keithley instrument was received without any scanner card options or cables.

Image 2: Rear side of test DMM received
No visual damages observed for equipment. Keithley 2002 powered up fine and passed a full self-test. Good start!
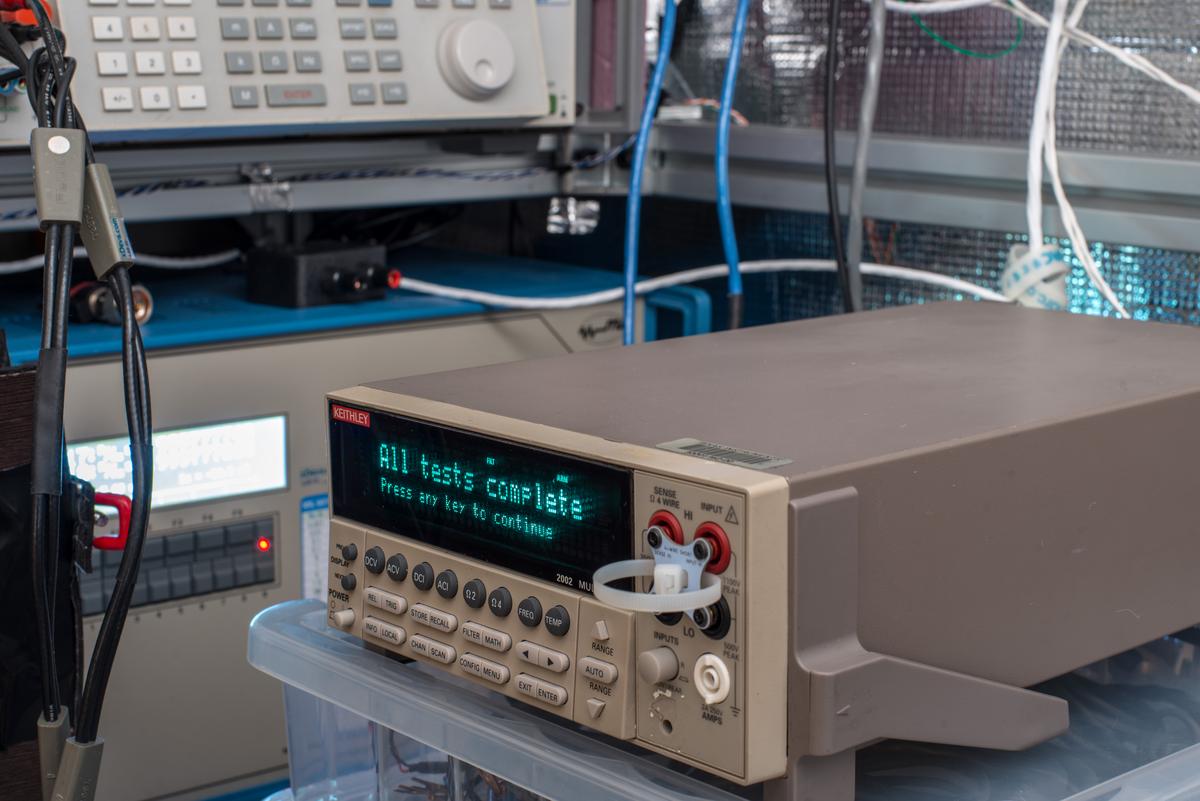
Image 3: Self-test results pass (no asterisk note on VFD) during warm-up
Unit is sporting A08 firmware and has the MEM2 option installed. Latest firmware is A10, but this is calibration only this time, so no meter disassembly/upgrades were performed.
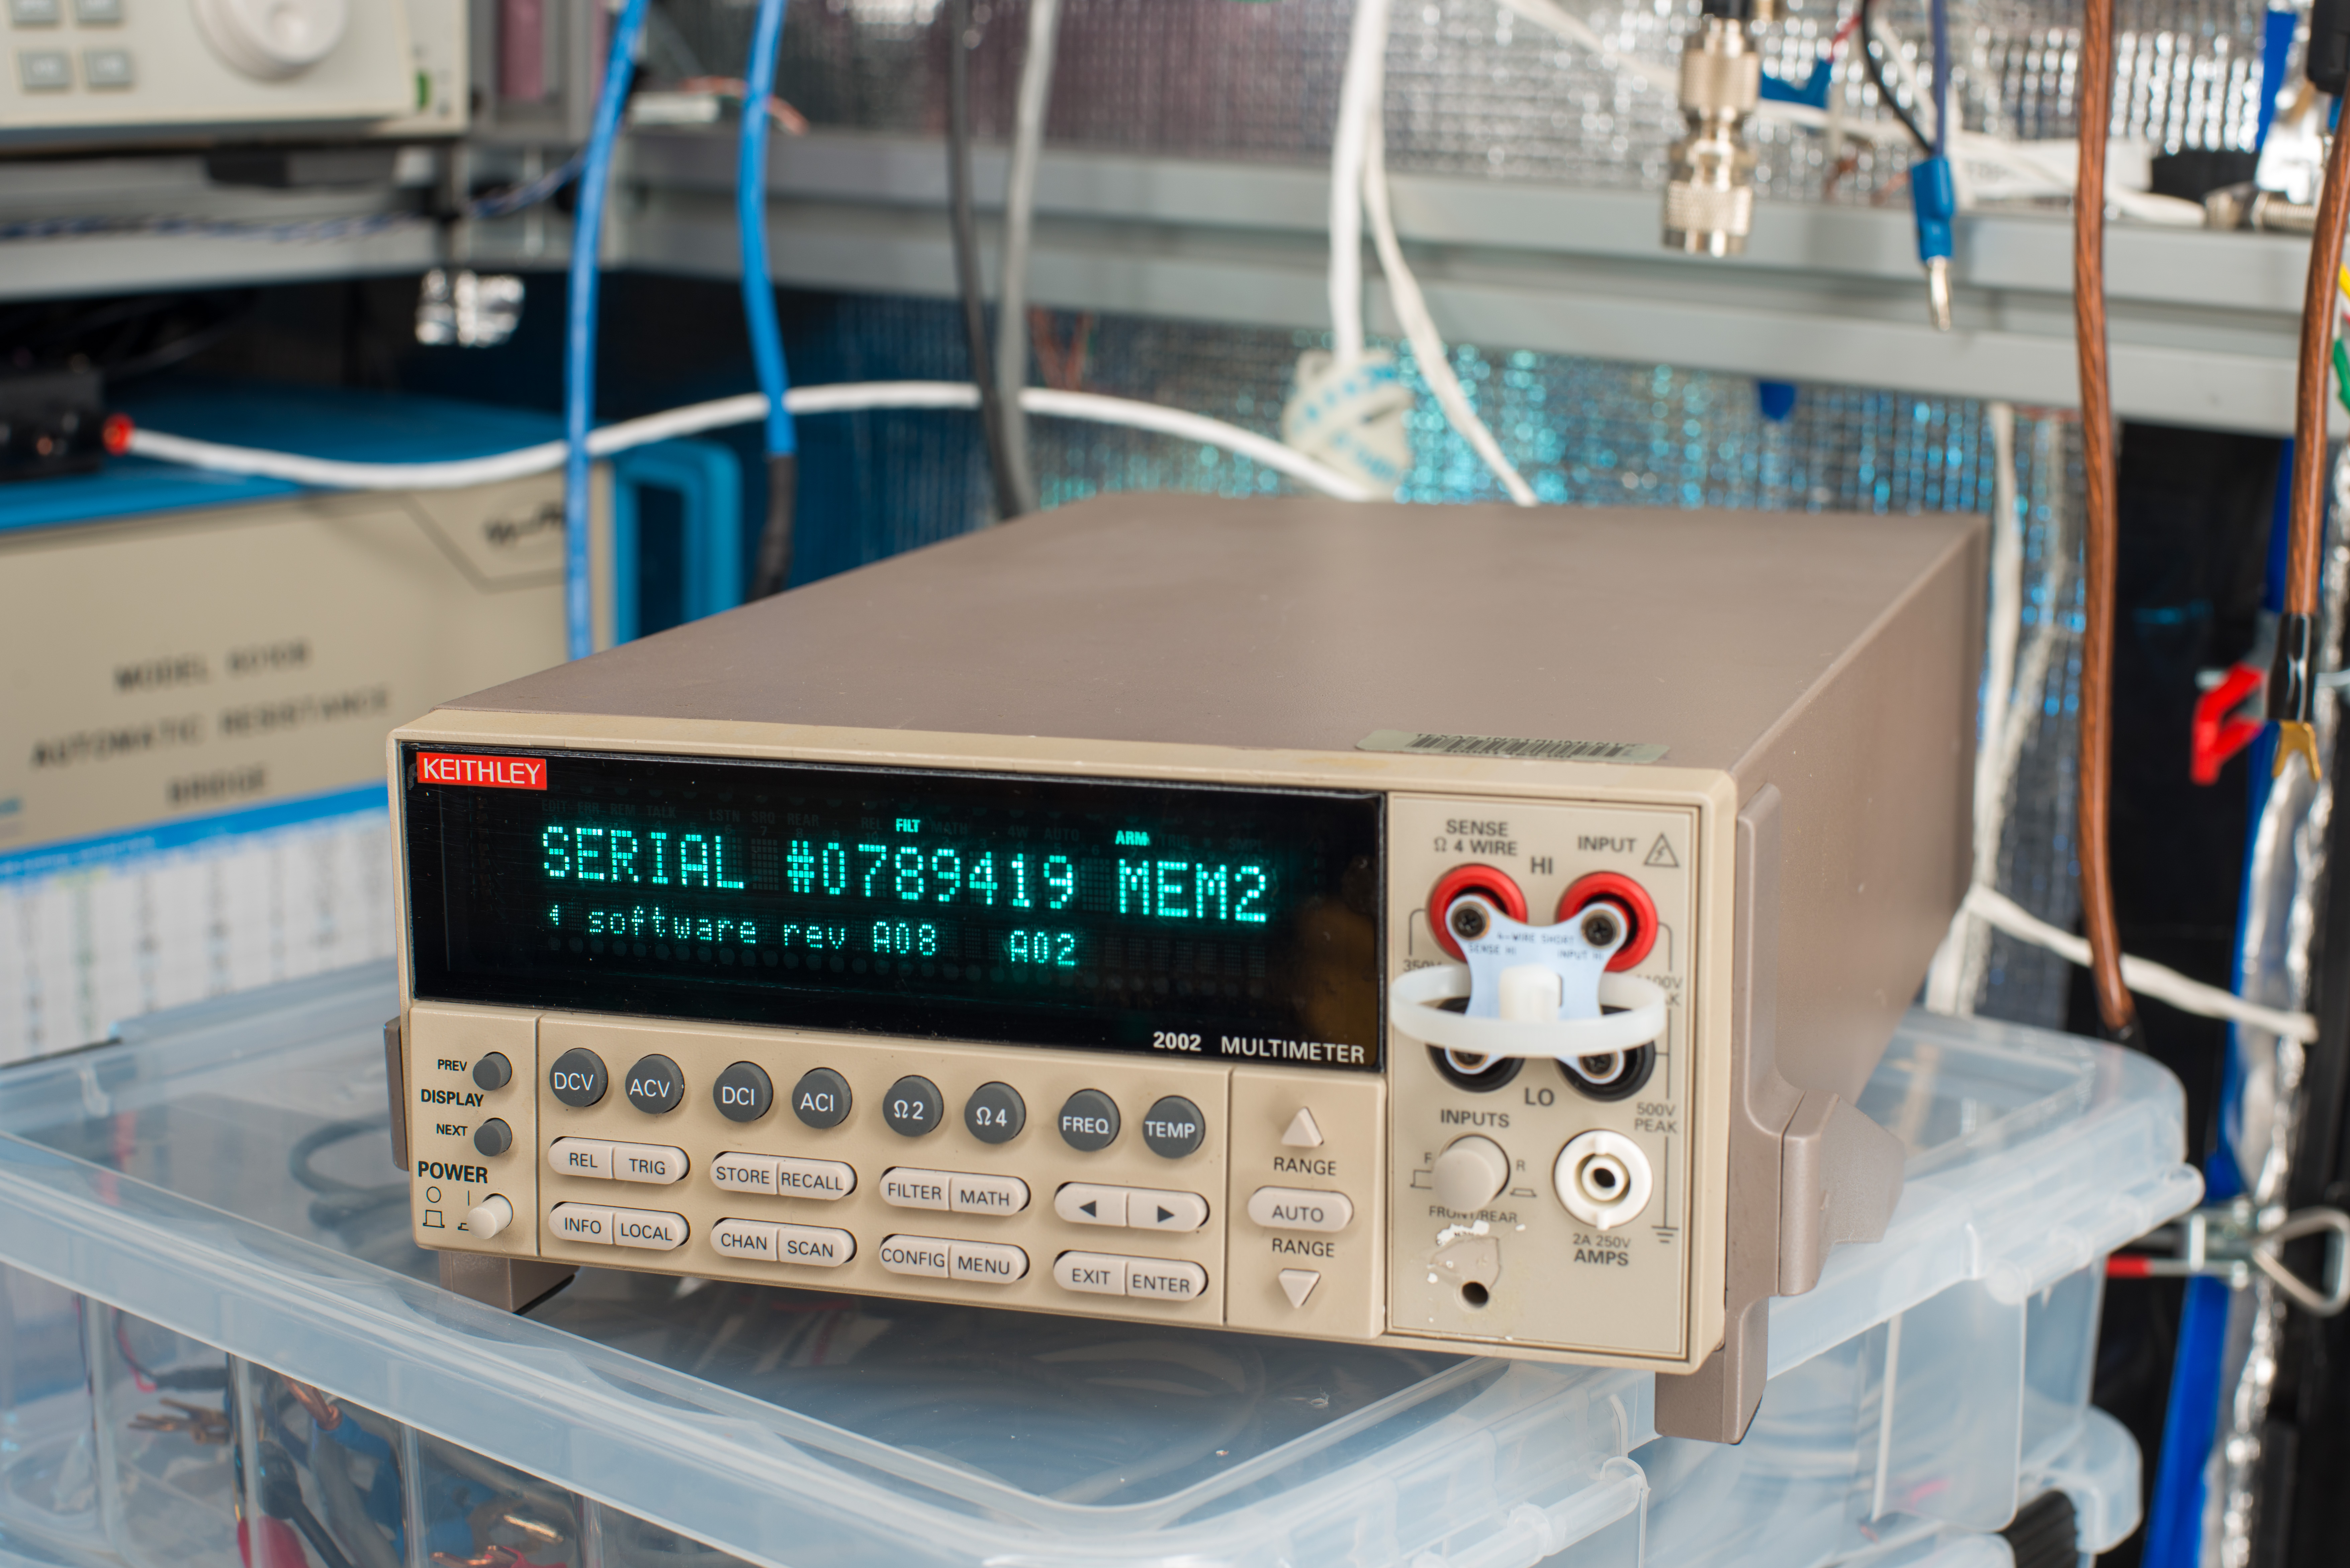
Image 4: Serial number and option information report
According to EEPROM data, the meter was last calibrated in August 2005. Will be interesting to see how far off it is from xDevs Volt and Ohm.

Image 5: Long overdue for full functional adjustment
Disclaimer
Redistribution and use of this article or any images or files referenced in it, in source and binary forms, with or without modification, are permitted provided that the following conditions are met:
- Redistribution of articles must retain the above copyright notice, this list of conditions, link to this page (/article/usac_2023/) and the following disclaimer.
- Redistribution of files in binary form must reproduce the above copyright notice, this list of conditions, link to this page (/article/usac_2023/), and the following disclaimer in the documentation and/or other materials provided with the distribution, for example Readme file.
All information posted here is hosted just for education purposes and provided AS IS. In no event shall the author, xDevs.com site, or any other 3rd party, including Keithley Instruments/Tektronix be liable for any special, direct, indirect, or consequential damages or any damages whatsoever resulting from loss of use, data or profits, whether in an action of contract, negligence or other tortuous action, arising out of or in connection with the use or performance of information published here.
If you are willing to contribute or add your experience regarding test equipment, repairs or provide extra information, you can do so following these simple instructions.
Performance of each particular instrument may be worse or better than shown in this article. For details consult with manufacturer specifications and perform your own testing. Don’t take data presented here as typical results from other instruments, even of the same model/year. All data presented here is NOT accredited and NOT certified to be free of errors. Proceed with this warning in mind.
Keithley 2002 8½-digit DMM calibration
Prior to any adjustment Keithley 2002 DUT DMM need to be tested for calibration points outlined in service manual, as well as temperature coefficient checks. This would help to gain confidence in the instrument and confirm its correct operation, before we spend time adjusting it and testing in depth.
Remote control configuration for Keithley 2002
Keithley 2002 (and lesser brother, Model 2001) equipped only with GPIB interface for remote control. To communicate with instrument GPIB to LAN bridge was used. This is perhaps the easiest and most flexible approach.
HP/Agilent/Keysight E5810A and modern variant Keysight E5810B are essentially small embedded computers with multiple interfaces running simple RTOS and gateway app. These boxes work as a proxy for the GPIB data over standard Ethernet network. You can connect to same E5810A Gateway from multiple hosts and there is no need to setup or install any dedicated software/drivers on the host PC. The very light-weight python-vxi11 library allows direct access to GPIB bus thru E5810A. You do NOT need messy linux-gpib installed to use this GPIB access method.
Below is example on how to install and use Keysight E5810 series LAN/GPIB gateway to communicate with Keithley 2002 and any other GPIB instruments, such as calibrators, power supplies, oscilloscopes, etc. All this is running on a small low-power Raspberry Pi microcomputer on Raspbian OS with the preinstalled Python 3 environment.
1. Get SVN repository for python-vxi
svn checkout https://github.com/python-ivi/python-vxi11
cd python-vxi11/trunk
Enter /home/vxi/python-vxi11/trunk directory
python setup.py install
Now python-vxi should be installed on your linux platform, such as Raspbian OS on Raspberry Pi, that we use here.
Here’s example python app to talk with VXI instrument:
import vxi11
inst =  vxi11.Instrument("192.168.1.10", "gpib0,7") # IP address of E5810A and GPIB address of instrument
inst.timeout = 30                                  # Timeout for interface to wait, seconds
print(inst.ask("*IDN?"))
Make sure to type “gpib0,7” in lowercase, and don’t put any spaces between the comma and the instrument address. Number 7 here is our GPIB instrument address, configured from front panel of Keithley 2002.
Timeout setting to 30 change the GPIB I/O timeout delay, it is important for long operations when instrument might not reply in default timeout time. This is important for example for resistance measurements with NPLC 50, enabled filters, OCOMP ON and DELAY 1.
In case of correct installation and connection reply can be as below:
KEITHLEY INSTRUMENTS INC.,MODEL 2002,1167961,A10 /A02
Now we can write more elaborate Python apps to control instruments, collect results and do post-processing and analysis. First can check correct communication with the instrument with simple script below. Script prints custom messages on front panel display, which can be handy for operator feedback during experiments:
# Test Python app to communicate with 2002
import vxi11                                                  # use this command for python-vxi / e5810
inst = vxi11.Instrument("192.168.1.125", "gpib0,7")             # use this command for python-vxi / e5810
inst.write(':DISP:WIND:TEXT:DATA "python-vxi11";STAT ON;')
inst.write(':DISP:WIND2:TEXT:DATA "E5810A GPIB";STAT ON;')
quit()
Result should match photo below.
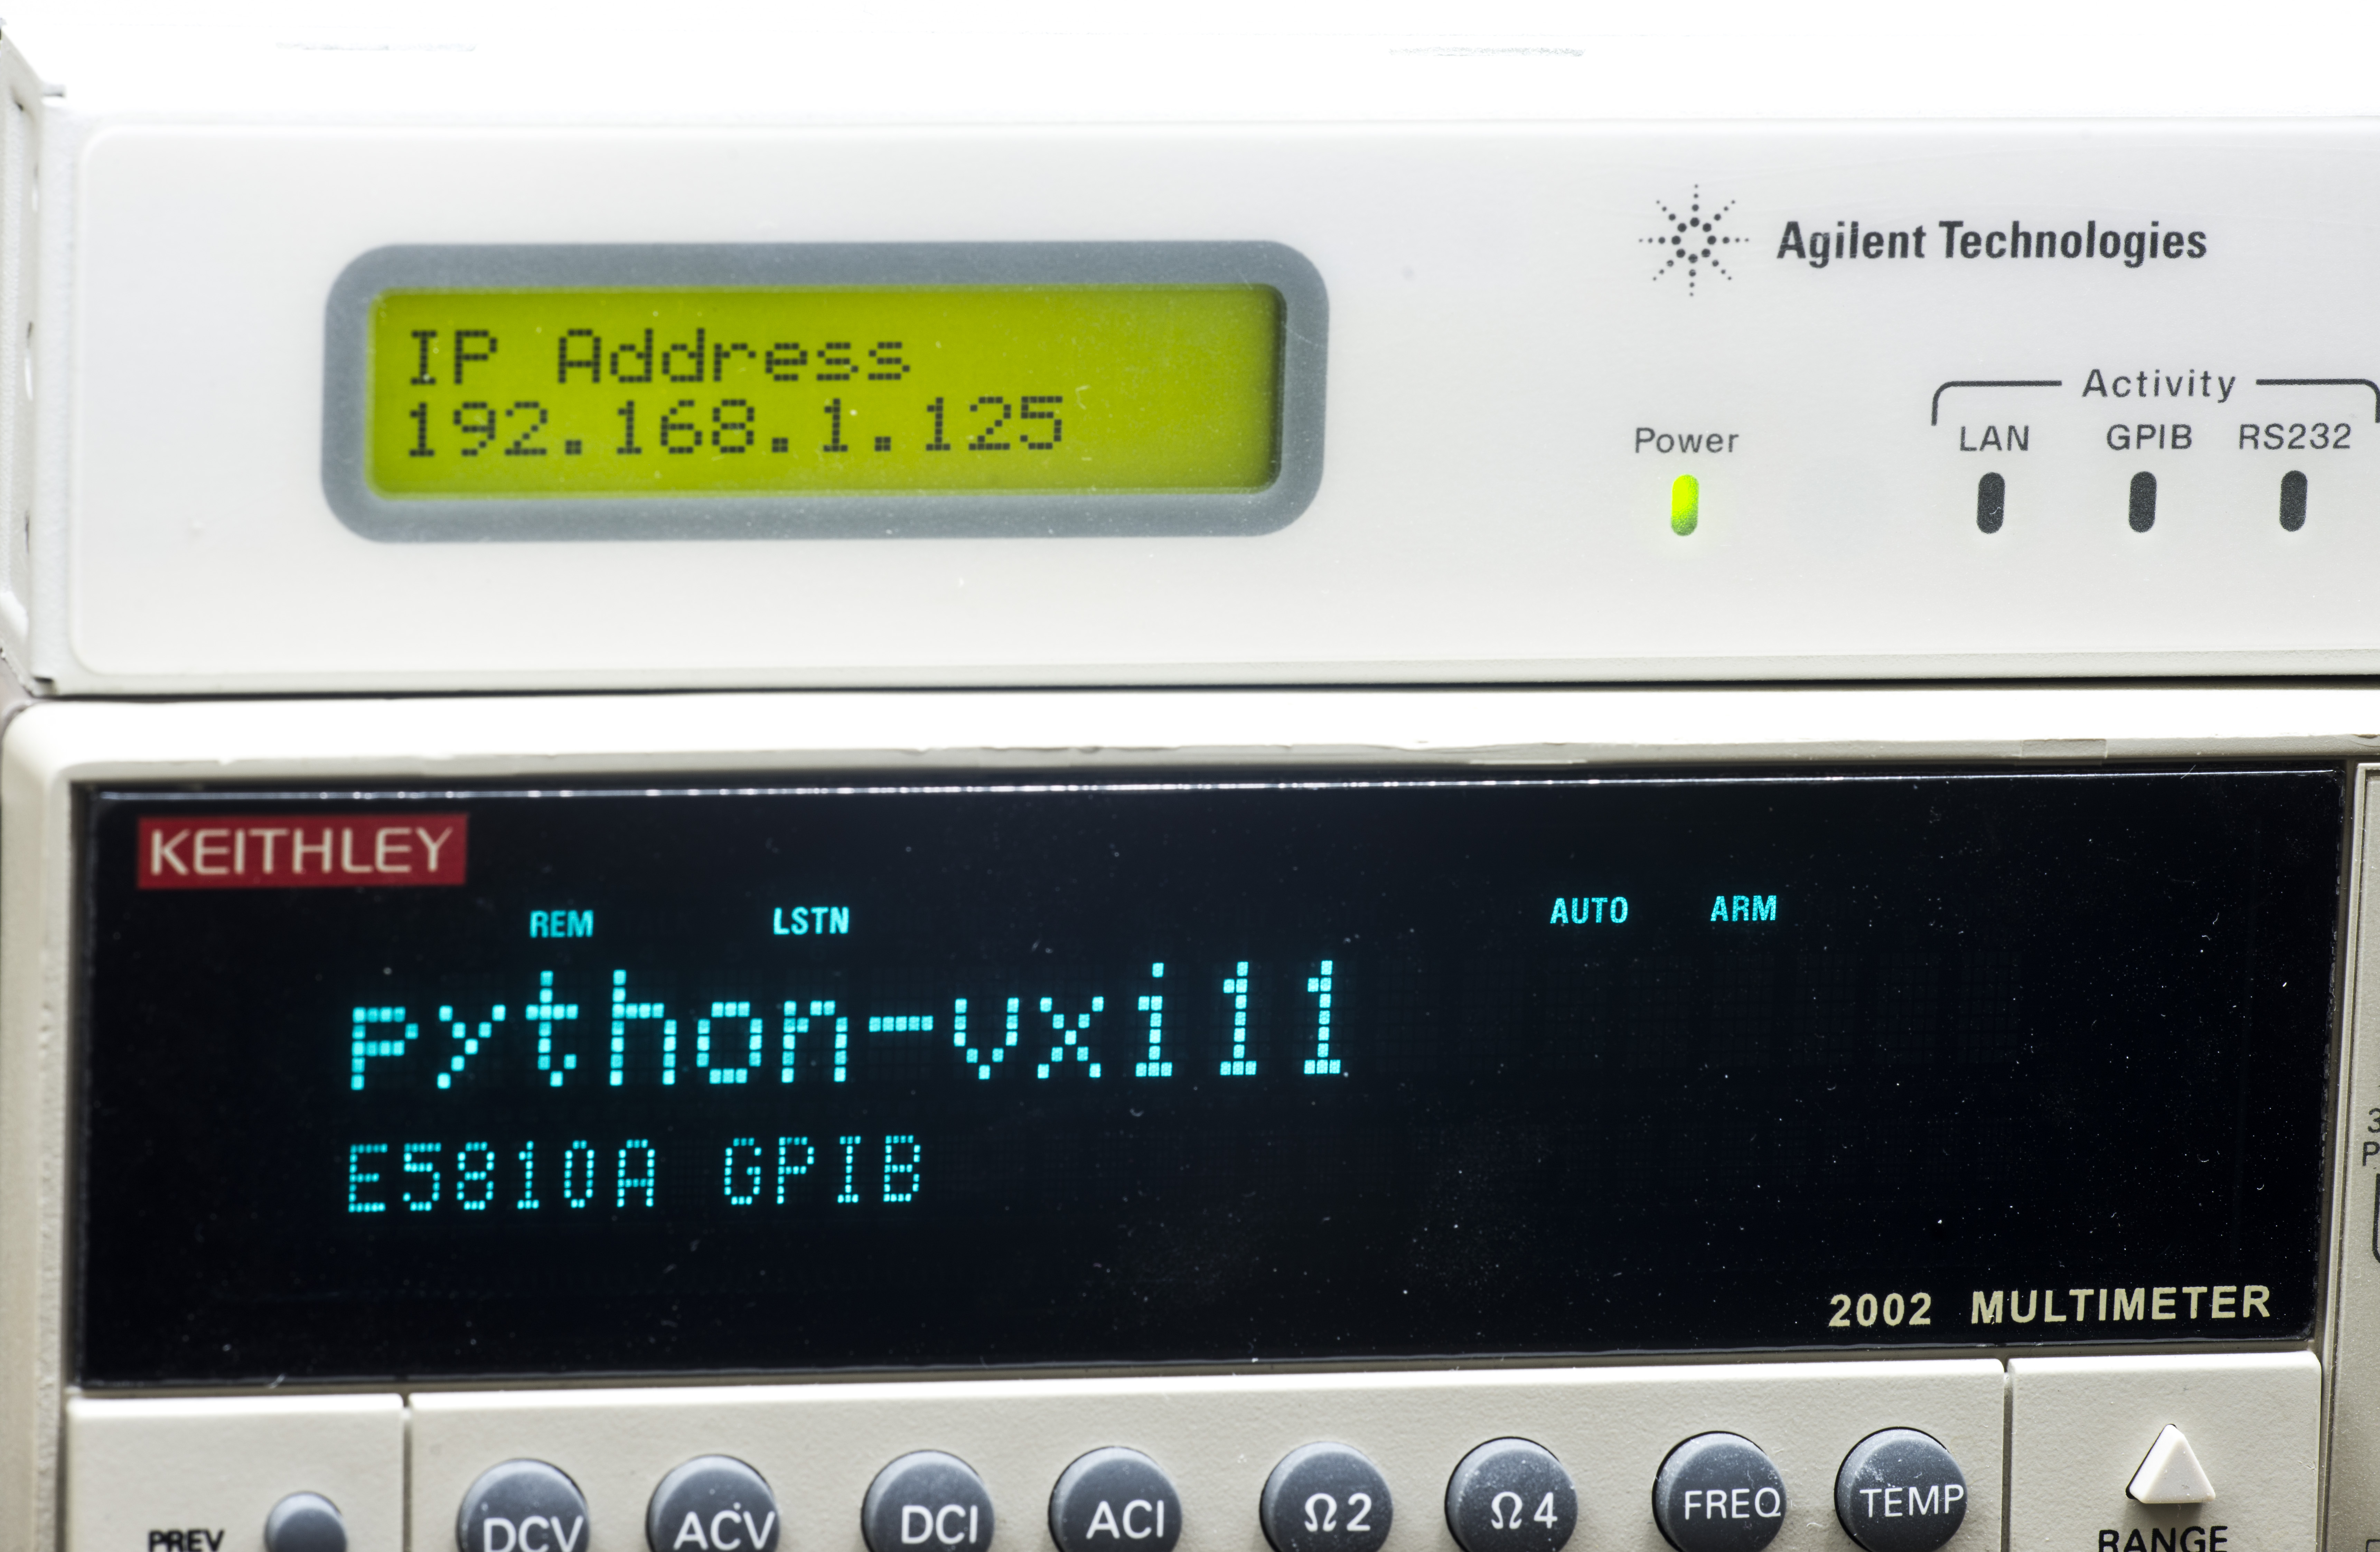
Image 6: Keithley 2002 displays custom text messages
Lab environment conditions were also recorded and monitored during all performance verifications. For this Bosch BME280 temperature/humidity/pressure sensor module was attached to same Raspberry Pi SBC and accessed with Python library. More details on how to configure BME280 for Pi is provided in this xDevs guide.
Keithley 2002 calibration results as received, November 17, 2022
Below are results of calibration performed on Keithley 2002 in “as received” condition. This means the meter was calibrated without any adjustments or corrections implemented.
xDevs.com follows strict definition of metrology vocabulary, where calibration is defined only as the measurement of unit under test against verified reference standard with known uncertainty, explicitly excluding any adjustments. Adjustment procedure is clearly stated as a separate operation and not part of calibration.
List of verification and reference equipment used related to this calibration shown in table below. Our equipment matches accuracy requirements outlined in the calibration manual with a good margin to perform good quality calibration.
| Type | Manufacturer | Model P/N | Options/value | Serial number | CEID | Calibration date | Due date |
|---|---|---|---|---|---|---|---|
| DCC | MIL | 6010B | XRI | XRB1 | 01/23/2022 | 02/23/2022 | |
| BVD | MIL | 6000A | XRI | XRB2 | 05/05/2022 | 05/05/2023 | |
| MFC | Fluke | 5720A | 03/HLK | 7530212 | XHC1 | 02/07/2022 | 08/07/2022 |
| Amplifier | Fluke | 5725A | 5930005 | XHB1 | 02/07/2022 | 08/07/2022 | |
| DC STD | xDevs.com | 792×[2] | 9.99997622 VDC | ±0.3 ppm | XD01 | 11/12/2022 | 11/12/2023 |
| STDR | ESI | SR104 | 10000.0013 KΩ | ±0.2 ppm | G202088930104 | 10/26/2021 | 10/26/2023 |
| STDR | xDevs.com/Fluke | SL935 | 1.00006304 Ω | ±0.31 ppm | XR03 | 10/28/2021 | 10/28/2022 |
| STDR | xDevs.com/Fluke | SL935 | 9999.9757 kΩ | ±0.36 ppm | XR02 | 10/28/2021 | 10/28/2022 |
| DMM | HP | 3458A | 001,X02 | MY45040325 | XD2 | 10/26/2021 | 10/26/2022 |
| Divider | Fluke | 752A | 4295200 | XR01 | 02/10/2022 | 03/10/2022 |
Table 1: Reference equipment list used to test Keithley 2002, as received
Keithley 2002 in natural habitat with friends and Fluke 5720A “Hulk1” calibrator system. Multiple wiring options were explored but that study is a topic for another article. Sadly, Model 2002 uses shrouded banana posts so I’m unable to use my typical go-to copper low-thermal spade lug cables here.

Image 7: Keithley 2002 connected to multi-function Fluke 5720A calibrator. Blue box on right is MIL 6000A bridge.
Unlike typical accredited calibration reports from commercial laboratories, main purpose of this calibration was not to provide certification of any kind if the instrument meets manufacturer specifications or not, but instead look at how much drift the meter has demonstrated since the last adjustment. Results presented here are not accredited or legally binding information, but provided only for education purposes on AS IS basis.
Jumping ahead, the owner requested adjustment upon instrument return. As a result I opted for using a much tighter 24-hour specification interval for BOTH reference multi-function calibrator Fluke 5720A and Keithley 2002 under test.
Calibrator was adjusted and tested to meet 24-hour specifications with help of fixed standards, Measurements International 6010B and 6000A resistance bridges and calibrated reference HP 3458A DMM. It is also important to appreciate that 8½-digit DMM demands well tested and characterized calibrator, since even high end 7½-digit calibrators like Fluke 5720A can barely meet specifications required to properly verify Model 2002 DMM. Artifact calibration of our Fluke 5720A was previously verified using resistance bridge systems for resistance and current output accuracy and with calibrated zener standard and HP3458A for voltage ranges. All this usually performed by experienced technicians with access to proper equipment, methods and training. Automation here helps huge deal, improving reproducibility and quality of results. Performing a full function test of modern multi-function multi-range instrument like long-scale DMM is still a tedious many hours’ task and automation allows to free up operator time a lot. I can’t imagine how many days all these benchmarks would take if done the old-school way with pencil and paper notepad.
There is no reason for correctly working DMM to fail to meet 24-hour specification within a short time after adjustment. To maintain the same reference point it was decided to perform both as received and as returned calibrations using these same short-term specifications. Obviously the instrument would pass much wider 1 year specifications in the same conditions if it falls within 24-hour spec.
Keithley 2002 does not have 24-hour interval specification for AC Voltage, AC Current, Frequency and Temperature functions. 90 days’ spec used for ACV and ACI instead.
Per legal or traceability purposes it is important to understand this calibration is automatically voided after 24 hours are lapsed, which is acceptable in this case with educational goals in mind. Now on good news – a typical high-performance instrument such as 8½-digit Keithley 2002 is built using quality components and low drift references, so it is common that these DMMs maintain their tight specifications with large margins compared to specifications. Based on our experience with more than seven different Keithley 2002’s these instruments can stay well within 24 hour specs for multiple months when provided with good stable environment and proper lab use without abuse.
Keithley 2002 calibration results as received, November 17, 2022
This test was automated and executed using xDevs.com CalKit Python automation suite. Test was performed on November 17, 2022 and took 13 hours to complete. Temperature in room kept at +23.0 °C ±1 °C. Test points and ranges are heavily inspired by Keithley 2002 calibration document from May 2004, Rev.D. This document is available for download below:
Model 2002 Calibration Manual, Rev D, May 2004
Model 2002 Multimeter Specifications, Rev I, Nov 2009
Owner of this Keithley 2002 noted that the front/rear mechanical switch is damaged and instrument can operate only front input terminals. Hence no testing or verification of functions using rear inputs was performed this time. No tear-down or disassembly was performed either. If you are looking for more knowledge about Model 2002 internal design be sure to check xDevs.com’s own Keithley 2002 review and second unit repair articles.
Keithley provides relative uncertainty specifications in tables. Operator must perform additional analysis and use factory calibration adders (in case of Keithley own calibration provided) or calibration laboratory standards or CMC uncertainty from calibration report to obtain absolute uncertainty for every function/range combination.
For all tests this instrument was powered on from standard 120 VAC 60 Hz mains on same rail as reference equipment, such as calibration, guard-band reference HP 3458A and resistance bridge. DMM was allowed to warm-up and settle for 24 hours before any measurements were commenced. Owner did partial point-calibration for DC Voltage functions, but all other functions were untouched, so it would be quite interesting to see results before any adjustments. Previous full calibration on the instrument was performed in August 2005, making it 17 years overdue for fresh adjustment. :)
First is DC Voltage function zero calibration. This verification is specific to DC voltage measurements. The offset, or zero, is the voltage reading that the multimeter displays when it is not measuring any voltage. This is an important value to check and calibrate as a DC voltage multimeter that has a significant offset will give inaccurate calibration for gain, or suggest there are malfunctions and internal faults that may need repairs.
| Keithley 2002,0789419,A08/A02, Last adjustment date 1.AUG.2005. Performance verification xDevs.com Rev.2556/2553 17.NOV.2022 | ||||||||
|---|---|---|---|---|---|---|---|---|
| DC zero test procedure for all test points that verify offset of the DCV function. 4-wire copper short at DMM | ||||||||
| Test Description | Zero Value | DUT | Source U | Lower Limit | Upper Limit | Deviation | DUT Spec | Test Status |
| Short 0 mVDC | 0.000 | -0.23 µV | 1.4 µV | -2.6 µV | 2.6 µV | 8.85 % | 1.2 µV | PASS |
| Short 0.0 VDC | 0.000 | -0.20 µV | 1.4 µV | -5.4 µV | 5.4 µV | 3.70 % | 4.0 µV | PASS |
| Short 00.0 VDC | 0.000 | -0.00 µV | 1.4 µV | -81.4 µV | 81.4 µV | 0.00 % | 80 µV | PASS |
| Short 000.0 VDC | 0.000 | 20.00 µV | 1.4 µV | -601.4 µV | 601.4 µV | 3.33 % | 0.6 mV | PASS |
| Short 0000.0 VDC | 0.000 | 0.00 µV | 1.4 µV | -6001.4 µV | 6001.4 µV | 0.00 % | 6 mV | PASS |
Table 2: DC Zero offset performance, as received
No issues here with DCV offset, meter met 24-hour specifications with worst error about 9% of 24-hr specification on most sensitive 200mV range.
DC voltage for multimeter verification is an important step in ensuring accurate measurements. Internally multimeter is relying on accurate and stable DCV functionality to operate other functions as well. Performance verification involves comparing the readings of the multimeter to a known standard, such as high accuracy and stability Fluke 5720A calibrator reference here. Calibration does NOT involve adjusting the multimeter’s internal components or corrections to the known standard. Performance verification and calibration should be performed regularly to ensure the accuracy of the multimeter, typically within 1 year periods.
| Keithley 2002,0789419,A08/A02, Last adjustment date 1.AUG.2005. Performance verification xDevs.com Rev.2556/2553 17.NOV.2022 | ||||||||
|---|---|---|---|---|---|---|---|---|
| DC Voltage test procedure for all test points that verify gain of the DCV function. 2-wire low-thermal connection MFC to DMM | ||||||||
| DCV Test | 0.1V-1000V | DUT | Source U | Low Limit | Hi limit | Measured | 24h spec | Result |
| 0.02 VDC (0.20 Range) | 0.0200 | 0.01999988 | 22.50 ppm | 0.01999888 | 0.02000112 | -6.000 ppm | 33.50 ppm | PASS 14.87 % |
| 0.1 VDC (0.20 Range) | 0.1000 | 0.10000001 | 6.50 ppm | 0.0999984 | 0.1000016 | 0.150 ppm | 9.50 ppm | PASS 1.30 % |
| 0.2 VDC (0.20 Range) | 0.2000 | 0.19999992 | 4.50 ppm | 0.1999978 | 0.2000022 | -0.400 ppm | 6.50 ppm | PASS 5.06 % |
| -0.02 VDC (0.20 Range) | -0.0200 | -0.02000008 | 22.50 ppm | -0.02000112 | -0.01999888 | 4.000 ppm | 33.50 ppm | PASS 9.91 % |
| -0.1 VDC (0.20 Range) | -0.1000 | -0.09999957 | 6.50 ppm | -0.1000016 | -0.0999984 | -4.300 ppm | 9.50 ppm | PASS 37.36 % |
| -0.2 VDC (0.20 Range) | -0.2000 | -0.199999 | 4.50 ppm | -0.2000022 | -0.1999978 | -5.025 ppm | 6.50 ppm | PASS 63.56 % |
| 0.2 VDC (2.00 Range) | 0.2000 | 0.2000003 | 6.00 ppm | 0.19999796 | 0.20000204 | 1.500 ppm | 4.20 ppm | PASS 20.48 % |
| 1.0 VDC (2.00 Range) | 1.0000 | 1.0000011 | 3.20 ppm | 0.999995 | 1.000005 | 1.100 ppm | 1.80 ppm | PASS 29.96 % |
| 1.9 VDC (2.00 Range) | 1.9000 | 1.9000020 | 2.87 ppm | 1.8999917 | 1.9000083 | 1.053 ppm | 1.52 ppm | PASS 32.43 % |
| 2.0 VDC (2.00 Range) | 2.0000 | 2.0000019 | 2.85 ppm | 1.9999913 | 2.0000087 | 0.950 ppm | 1.50 ppm | PASS 29.50 % |
| -0.2 VDC (2.00 Range) | -0.2000 | -0.2000012 | 6.00 ppm | -0.20000204 | -0.19999796 | 6.000 ppm | 4.20 ppm | PASS? 81.92 % |
| -1.0 VDC (2.00 Range) | -1.0000 | -1.0000030 | 3.20 ppm | -1.000005 | -0.999995 | 3.000 ppm | 1.80 ppm | PASS? 81.71 % |
| -1.9 VDC (2.00 Range) | -1.9000 | -1.9000054 | 2.87 ppm | -1.9000083 | -1.8999917 | 2.842 ppm | 1.52 ppm | PASS? 87.57 % |
| -2.0 VDC (2.00 Range) | -2.0000 | -2.0000056 | 2.85 ppm | -2.0000087 | -1.9999913 | 2.800 ppm | 1.50 ppm | PASS? 86.94 % |
| 1.0 VDC (20.00 Range) | 1.0000 | 1.0000000 | 5.50 ppm | 0.9999913 | 1.0000087 | 0.000 ppm | 3.20 ppm | PASS 0.00 % |
| 10.0 VDC (20.00 Range) | 10.0000 | 10.000016 | 1.90 ppm | 9.999967 | 10.000033 | 1.600 ppm | 1.40 ppm | ?PASS 67.79 % |
| 19.0 VDC (20.00 Range) | 19.0000 | 19.000022 | 1.71 ppm | 18.999943 | 19.000057 | 1.158 ppm | 1.31 ppm | PASS 53.82 % |
| 20.0 VDC (20.00 Range) | 20.0000 | 20.000025 | 1.70 ppm | 19.99994 | 20.00006 | 1.250 ppm | 1.30 ppm | PASS 58.41 % |
| -1.0 VDC (20.00 Range) | -1.0000 | -1.000002 | 5.50 ppm | -1.0000087 | -0.9999913 | 2.000 ppm | 3.20 ppm | PASS 31.43 % |
| -10.0 VDC (20.00 Range) | -10.0000 | -10.000021 | 1.90 ppm | -10.000033 | -9.999967 | 2.100 ppm | 1.40 ppm | PASS? 88.98 % |
| -19.0 VDC (20.00 Range) | -19.0000 | -19.000015 | 1.71 ppm | -19.000057 | -18.999943 | 0.789 ppm | 1.31 ppm | PASS 36.70 % |
| -20.0 VDC (20.00 Range) | -20.0000 | -20.000014 | 1.70 ppm | -20.00006 | -19.99994 | 0.700 ppm | 1.30 ppm | PASS 32.71 % |
| 10 VDC (200.00 Range) | 10.0000 | 10.000040 | 6.50 ppm | 9.999805 | 10.000195 | 4.000 ppm | 13.00 ppm | PASS 27.52 % |
| 100 VDC (200.00 Range) | 100.0000 | 100.00012 | 2.90 ppm | 99.99913 | 100.00087 | 1.250 ppm | 5.80 ppm | PASS 19.28 % |
| 200 VDC (200.00 Range) | 200.0000 | 200.00000 | 2.70 ppm | 199.99838 | 200.00162 | 0.025 ppm | 5.40 ppm | PASS 0.41 % |
| -10 VDC (200.00 Range) | -10.0000 | -10.00007 | 6.50 ppm | -10.000195 | -9.999805 | 7.000 ppm | 13.00 ppm | PASS 48.16 % |
| -100 VDC (200.00 Range) | -100.0000 | -100.00016 | 2.90 ppm | -100.00087 | -99.99913 | 1.600 ppm | 5.80 ppm | PASS 24.67 % |
| -200 VDC (200.00 Range) | -200.0000 | -200.00014 | 2.70 ppm | -200.00162 | -199.99838 | 0.675 ppm | 5.40 ppm | PASS 11.18 % |
| 100 VDC (1000.00 Range) | 100.0000 | 100.0003 | 7.00 ppm | 99.99872 | 100.00128 | 3.000 ppm | 5.80 ppm | PASS 33.00 % |
| 200 VDC (1000.00 Range) | 200.0000 | 200.0003 | 5.00 ppm | 199.99792 | 200.00208 | 1.500 ppm | 5.40 ppm | PASS 20.38 % |
| 1000 VDC (1000.00 Range) | 1000.0000 | 1000.0052 | 3.40 ppm | 999.98152 | 1000.0185 | 5.200 ppm | 15.08 ppm | PASS 25.63 % |
| -100 VDC (1000.00 Range) | -100.0000 | -100.0007 | 7.00 ppm | -100.00128 | -99.99872 | 7.000 ppm | 5.80 ppm | ?PASS 77.00 % |
| -200 VDC (1000.00 Range) | -200.0000 | -200.0005 | 5.00 ppm | -200.00208 | -199.99792 | 2.500 ppm | 5.40 ppm | PASS 33.97 % |
| -1000 VDC (1000.00 Range) | -1000.0000 | -1000.0059 | 3.40 ppm | -1000.0185 | -999.98152 | 5.950 ppm | 15.08 ppm | PASS 29.33 % |
Table 3: DC Voltage gain performance, as received
As already mentioned earlier, the owner of this instrument did test and adjust DC Voltage ranges using the point-cal procedure available on 2002. Overall meter barely passed, with negative points at 2 VDC range very close to reaching limits with <20% margin left. Other questionable points were positive and negative 10 V on 20 V range and negative 100V on 1kV range.
Resistance calibration is a procedure used to verify the accuracy of resistance measurements. Model 2002 DMM resistance function is based on measuring the voltage across and the known current sourced by DMM into the external resistance being measured, using four separate wires for resistances below 2 MΩ. The traditional 2-wire method uses only two wires, one for current and one for voltage, but it can be affected by lead resistance. This lead resistance can introduce significant errors in the resistance measurement, particularly when measuring low resistance values below 100 kΩ.
| Keithley 2002,0789419,A08/A02, Last adjustment date 1.AUG.2005. Performance verification xDevs.com Rev.2556/2553 17.NOV.2022 | ||||||||
|---|---|---|---|---|---|---|---|---|
| 4-wire Zero test procedure for all test points that verify Zero offset of the OHMF function. 4-wire kelvin short installed at DMM | ||||||||
| OHM ZERO 4W | DUT | Source unc. | Low Limit | Hi limit | Measured | 24h spec | Result | |
| 20R Ω Range | -0.0000190 Ω | 0.0000500 Ω | -0.0001435 | 0.0001435 | 13.24 % | 0.0000935 Ω | PASS | |
| 200R Ω Range | 0.0000700 Ω | 0.0000500 Ω | -0.00068 | 0.00068 | 10.29 % | 0.0006300 Ω | PASS | |
| 2K Ω Range | 0.0000000 Ω | 0.0000500 Ω | -0.00068 | 0.00068 | 0.00 % | 0.0006300 Ω | PASS | |
| 20K Ω Range | -0.0010000 Ω | 0.0000500 Ω | -0.00635 | 0.00635 | 15.75 % | 0.0063000 Ω | PASS | |
| 200K Ω Range | -0.0020000 Ω | 0.0000500 Ω | -0.10505 | 0.10505 | 1.90 % | 0.1050000 Ω | PASS | |
| 2-wire Zero test procedure for all test points that verify Zero offset of the OHMF function. 4-wire kelvin short installed at DMM | ||||||||
| OHM ZERO 2W | DUT | Source unc. | Low Limit | Hi limit | Measured | 24h spec | Result | |
| 20R Ω Range | 0.371575 Ω | 0.5 Ω | -0.5000935 | 0.5000935 | 74.30 % | 9.35E-05 Ω | ?PASS | |
| 200R Ω Range | 0.35852 Ω | 0.5 Ω | -0.50063 | 0.50063 | 71.61 % | 0.00063 Ω | ?PASS | |
| 2K Ω Range | 0.3485 Ω | 0.5 Ω | -0.50063 | 0.50063 | 69.61 % | 0.00063 Ω | ?PASS | |
| 20K Ω Range | 0.337 Ω | 0.5 Ω | -0.5063 | 0.5063 | 66.56 % | 0.0063 Ω | PASS | |
| 200K Ω Range | 0.3 Ω | 0.5 Ω | -0.605 | 0.605 | 49.59 % | 0.105 Ω | PASS | |
| 2M Ω Range | 0.2 Ω | 0.5 Ω | -1.13 | 1.13 | 17.70 % | 0.63 Ω | PASS | |
| 20M Ω Range | 0 Ω | 0.5 Ω | -4.7 | 4.7 | 0.00 % | 4.2 Ω | PASS | |
| 200M Ω Range | 0 Ω | 0.5 Ω | -210.5 | 210.5 | 0.00 % | 210 Ω | PASS | |
| 1G Ω Range | 0 Ω | 0.5 Ω | -5000.5 | 5000.5 | 0.00 % | 5000 Ω | PASS | |
Table 4: Resistance zero offset performance, as received
Offset zero on 2-wire resistance measurement function was a bit high on lowest three ranges, reaching 74.3% on 20 Ω test. 4-wire shows no issues here.
In the test below 4-wire method used for resistances between 1 Ω and 1.9 MΩ. 2-wire method used for resistances 10 MΩ and higher. Precision resistance standards with a known value and four-wire connections are needed or a multi-range calibrator such as 5720A or 5450A.
The multimeter should be set in 4-wire mode and connect the four wires to the precision resistance standard, the multimeter will measure the voltage across and the current through the resistance and calculate the resistance. The measurement should be compared with the known value of the precision resistance standard, if the measurement is not within the tolerance then the multimeter should be calibrated or repaired.
Offset Compensation (OCOMP) function is used for resistance values 19 kΩ and below. OCOMP is not supported by Model 2002 for higher ranges. In all cases NPLC 20 was used.
| Keithley 2002,0789419,A08/A02, Last adjustment date 1.AUG.2005. Performance verification xDevs.com Rev.2556/2553 17.NOV.2022 | ||||||||
|---|---|---|---|---|---|---|---|---|
| 4-wire resistance test procedure for all test points that verify gain of the OHMF function. 4-wire connection MFC to DMM | ||||||||
| OHM Test | Reference | DUT | Source unc. | Low Limit | Hi limit | Measured | 24h spec | Result |
| 1 Ω OCOMP | 0.9997727 Ω | 0.9997605 Ω | 32 ppm | 9.9964571E-01 | 9.9989969E-01 | -12.203 ppm | 95.02 ppm | PASS, 12.17 % of 100.26 ppm |
| 1.9 Ω OCOMP | 1.8997973 Ω | 1.899790 Ω | 25 ppm | 1.8996503E+00 | 1.8999443E+00 | -3.843 ppm | 52.37 ppm | PASS, 6.67 % of 57.61 ppm |
| 10 Ω OCOMP | 10.000602 Ω | 10.000598 Ω | 5.0 ppm | 1.0000412E+01 | 1.0000792E+01 | -0.400 ppm | 14.00 ppm | PASS, 2.75 % of 14.56 ppm |
| 19 Ω OCOMP | 19.0001771 Ω | 19.000119 Ω | 4.0 ppm | 1.8999916E+01 | 1.9000438E+01 | -3.058 ppm | 9.74 ppm | PASS, 29.05 % of 10.53 ppm |
| 100 Ω OCOMP | 99.995756 Ω | 99.99608 Ω | 1.7 ppm | 9.9994486E+01 | 9.9997026E+01 | 3.240 ppm | 11.00 ppm | PASS, 29.11 % of 11.13 ppm |
| 190 Ω OCOMP | 189.991291 Ω | 189.99151 Ω | 1.7 ppm | 1.8998942E+02 | 1.8999316E+02 | 1.153 ppm | 8.16 ppm | PASS, 13.83 % of 8.33 ppm |
| 1.0 kΩ OCOMP | 1000.02101 Ω | 1000.0108 Ω | 1.7 ppm | 1.0000162E+03 | 1.0000258E+03 | -10.210 ppm | 3.10 ppm | FAIL, 288.78 % of 3.54 ppm |
| 1.9 kΩ OCOMP | 1899.8719 Ω | 1899.8522 Ω | 1.7 ppm | 1.8998633E+03 | 1.8998805E+03 | -10.369 ppm | 2.82 ppm | FAIL, 315.25 % of 3.29 ppm |
| 10 kΩ OCOMP | 9999.800 Ω | 9999.726 Ω | 1.6 ppm | 9.9997530E+03 | 9.9998470E+03 | -7.400 ppm | 3.10 ppm | FAIL, 212.13 % of 3.49 ppm |
| 19 kΩ OCOMP | 18999.243 Ω | 18999.126 Ω | 1.7 ppm | 1.8999157E+04 | 1.8999329E+04 | -6.158 ppm | 2.82 ppm | FAIL, 187.22 % of 3.29 ppm |
| 100 kΩ | 99994.73 Ω | 99997.31 Ω | 2.0 ppm | 9.9993880E+04 | 9.9995580E+04 | 25.801 ppm | 6.50 ppm | FAIL, 379.39 % of 6.80 ppm |
| 190 kΩ | 189988.98 Ω | 189993.31 Ω | 2.0 ppm | 1.8998746E+05 | 1.8999050E+05 | 22.791 ppm | 6.03 ppm | FAIL, 358.94 % of 6.35 ppm |
| 1.0 MΩ | 999982.4 Ω | 999916.6 Ω | 2.5 ppm | 9.9996730E+05 | 9.9999750E+05 | -65.801 ppm | 12.6 ppm | FAIL, 512.25 % of 12.85 ppm |
| 1.9 MΩ | 1899978.3 Ω | 1899846.6 Ω | 3.0 ppm | 1.8999492E+06 | 1.9000074E+06 | -69.317 ppm | 12.32 ppm | FAIL, 555.55 % of 12.48 ppm |
| 10 MΩ 2W | 9999094 Ω | 9998650 Ω | 10 ppm | 9.9984901E+06 | 9.9996979E+06 | -44.404 ppm | 50.4 ppm | ?PASS, 86.42 % of 51.38 ppm |
| 19 MΩ 2W | 18998711 Ω | 18997738 Ω | 20 ppm | 1.8997377E+07 | 1.9000045E+07 | -51.214 ppm | 50.2 ppm | ?PASS, 94.76 % of 54.05 ppm |
| 100 MΩ 2W | 100005110 Ω | 100001870 Ω | 50 ppm | 9.9984909E+07 | 1.0002531E+08 | -32.398 ppm | 152 ppm | PASS, 20.25 % of 160.01 ppm |
Table 5: Resistance gain performance, as received
Resistance is a first test that shows significant issues on this instrument calibration. 20 Ω and 200 Ω and 200 MΩ ranges were pretty much spot on but good news end here quickly. All ranges 2 kΩ and above fail to meet specifications with deviations at least 2 times over the expected. The 20 MΩ range was barely meeting the required window to pass.
Highest 1 GΩ range was not verified during “as received” calibration, because it is a manual calibration step procedure. Fluke 5720A cannot generate 1 GΩ output due to leakage limitations, so this range requires an external fixed resistance standard.
Worth to note that all measurement points are checked and recorded over multiple samples, not just recording the first reading that shows up on display. Because all measurements are automated we have a full log of each RAW data point for statistical checks and analysis if such needs arise. Below is excerpt of measurement at 10 kΩ data point from calkit log-file:
11162022-21:02:20 HWR[1]: EXTSENSE ON
11162022-21:02:20 HWR[7]: :SENS:FRES:OCOM ON                 # Enable K2002 OCOMP
11162022-21:02:20 HWR[7]: :TRIG:DEL 1                        # Set trigger delay 1 second for DA cable
11162022-21:02:20 HWR[1]: OUT 10000.000000 OHM               # Program Fluke 5720 output
11162022-21:02:20 HWR[1]: OPER                               # Enable calibrator output
11162022-21:02:20 HWR[1]: EXTSENSE ON                        # Enable 4-wire output
11162022-21:02:20 HWR[7]: :SENS:FUNC 'FRES'
11162022-21:02:20 HWR[7]: :SENS:FRES:DIG 8
11162022-21:02:20 HWR[7]: :SENS:FRES:RANG 1.000000e+04
11162022-21:02:20 HWR[7]: :SENS:FRES:NPLC 10.0000
11162022-21:02:41 HWR[7]: :SENS:RES:AVER:STAT OFF
11162022-21:02:41 HWR[7]: :SENS:FRES:AVER:STAT OFF
11162022-21:02:41 RDr[1]: +9.9998000E+03,OHM,0.0000E+00     # Readback of actual 5720A output value
11162022-21:02:41 ERD[1]: +9.9998000E+03,OHM,0.0000E+00     # Readback of actual 5720A output value
11162022-21:02:45 RDr[7]: +9.999729E+03
11162022-21:02:48 RDr[7]: +9.999730E+03
11162022-21:02:52 RDr[7]: +9.999730E+03
11162022-21:02:55 RDr[7]: +9.999726E+03
11162022-21:02:59 RDr[7]: +9.999728E+03
11162022-21:03:02 RDr[7]: +9.999726E+03
11162022-21:03:06 RDr[7]: +9.999727E+03
11162022-21:03:10 RDr[7]: +9.999726E+03
11162022-21:03:13 RDr[7]: +9.999726E+03
11162022-21:03:17 RDr[7]: +9.999727E+03
11162022-21:03:21 RDr[7]: +9.999726E+03
11162022-21:03:24 RDr[7]: +9.999726E+03
11162022-21:03:29 RDr[7]: +9.999727E+03
11162022-21:03:32 RDr[7]: +9.999724E+03
11162022-21:03:36 RDr[7]: +9.999725E+03
11162022-21:03:40 RDr[7]: +9.999728E+03
11162022-21:03:43 RDr[7]: +9.999728E+03
11162022-21:03:47 RDr[7]: +9.999728E+03
11162022-21:03:50 RDr[7]: +9.999723E+03
11162022-21:03:54 RDr[7]: +9.999724E+03
Next test is AC voltage points verification at multiple points. I’ve also included a measurement test of 10% of the lowest range on K2002, which is 220mV.
This data can be handy for low signal AC signal measurements. Keithley 2002 is using AD637-based solid state RMS converter chip to provide AC voltage measurements so it is not a competition to specialized instruments like fluke 5790A, Wavetek 4920/4920M or thermal converters.
| Keithley 2002,0789419,A08/A02, Last adjustment date 1.AUG.2005. Performance verification xDevs.com Rev.2556/2553 17.NOV.2022 | ||||||||
|---|---|---|---|---|---|---|---|---|
| Procedure for all test points that verify Gain & flatness of the AC Voltage. 2-wire connection at LO and ACV is used between DMM and MFC | ||||||||
| ACV Test | DUT | Source U | Low Limit | Hi limit | Measured | 24h spec | Result, % spec | |
| 20 mV AC+DC @ 10 Hz | 0.0200354 | 0.0400 % | 0.019819 | 0.020181 | 0.1774 % | 0.8650 % | PASS 20.49 % | |
| 20 mV AC+DC @ 20 Hz | 0.0200341 | 0.0280 % | 0.019821 | 0.020179 | 0.1708 % | 0.8650 % | PASS 19.74 % | |
| 20 mV AC+DC @ 50 Hz | 0.0200350 | 0.0270 % | 0.019822 | 0.020178 | 0.1754 % | 0.8650 % | PASS 20.27 % | |
| 20 mV AC+DC @ 60 Hz | 0.0200304 | 0.0270 % | 0.019822 | 0.020178 | 0.1521 % | 0.8650 % | PASS 17.58 % | |
| 20 mV AC+DC @ 100 Hz | 0.0200354 | 0.0270 % | 0.019822 | 0.020178 | 0.1772 % | 0.8650 % | PASS 20.48 % | |
| 20 mV AC+DC @ 1.0 kHz | 0.0200353 | 0.0270 % | 0.019822 | 0.020178 | 0.1765 % | 0.8650 % | PASS 20.40 % | |
| 20 mV AC+DC @ 6.25 kHz | 0.0200310 | 0.0270 % | 0.019822 | 0.020178 | 0.1553 % | 0.8650 % | PASS 17.95 % | |
| 20 mV AC+DC @ 10.0 kHz | 0.0200312 | 0.0270 % | 0.019822 | 0.020178 | 0.1561 % | 0.8650 % | PASS 18.03 % | |
| 20 mV AC+DC @ 20.0 kHz | 0.0200310 | 0.0270 % | 0.019822 | 0.020178 | 0.1552 % | 0.8650 % | PASS 17.93 % | |
| 20 mV AC+DC @ 50.0 kHz | 0.0200257 | 0.0370 % | 0.019820 | 0.020180 | 0.1286 % | 0.8650 % | PASS 14.86 % | |
| 20 mV AC+DC @ 100.0 kHz | 0.0200048 | 0.0650 % | 0.019854 | 0.020146 | 0.0243 % | 0.6650 % | PASS 3.64 % | |
| 20 mV AC+DC @ 200.0 kHz | 0.0199625 | 0.0800 % | 0.019671 | 0.020329 | -0.1872 % | 1.5650 % | PASS 11.95 % | |
| 20 mV AC+DC @ 300.0 kHz | 0.0199577 | 0.0800 % | 0.019671 | 0.020329 | -0.2113 % | 1.5650 % | PASS 13.49 % | |
| 20 mV AC+DC @ 500.0 kHz | 0.0202309 | 0.2100 % | 0.019078 | 0.020922 | 1.1550 % | 4.4000 % | PASS 26.22 % | |
| 20 mV AC+DC @ 1.0 MHz | 0.0208228 | 0.3400 % | 0.019052 | 0.020948 | 4.1144 % | 4.4000 % | ?PASS 93.23 % | |
| 200 mV AC+DC @ 10 Hz | 0.19993089 | 0.0260 % | 0.199418 | 0.200582 | -0.0346 % | 0.2650 % | PASS 12.98 % | |
| 200 mV AC+DC @ 20 Hz | 0.19993803 | 0.0115 % | 0.199447 | 0.200553 | -0.0310 % | 0.2650 % | PASS 11.68 % | |
| 200 mV AC+DC @ 50 Hz | 0.19994759 | 0.0105 % | 0.199899 | 0.200101 | -0.0262 % | 0.0400 % | PASS 63.40 % | |
| 200 mV AC+DC @ 60 Hz | 0.19995642 | 0.0105 % | 0.199899 | 0.200101 | -0.0218 % | 0.0400 % | PASS 52.72 % | |
| 200 mV AC+DC @ 100 Hz | 0.19995761 | 0.0105 % | 0.199899 | 0.200101 | -0.0212 % | 0.0400 % | PASS 51.28 % | |
| 200 mV AC+DC @ 1.0 kHz | 0.19997525 | 0.0105 % | 0.199899 | 0.200101 | -0.0124 % | 0.0400 % | PASS 29.94 % | |
| 200 mV AC+DC @ 6.25 kHz | 0.19997766 | 0.0105 % | 0.199889 | 0.200111 | -0.0112 % | 0.0450 % | PASS 24.18 % | |
| 200 mV AC+DC @ 10.0 kHz | 0.19997985 | 0.0105 % | 0.199889 | 0.200111 | -0.0101 % | 0.0450 % | PASS 21.81 % | |
| 200 mV AC+DC @ 20.0 kHz | 0.19997640 | 0.0105 % | 0.199889 | 0.200111 | -0.0118 % | 0.0450 % | PASS 25.55 % | |
| 200 mV AC+DC @ 50.0 kHz | 0.19993016 | 0.0205 % | 0.199819 | 0.200181 | -0.0349 % | 0.0700 % | PASS 47.89 % | |
| 200 mV AC+DC @ 100.0 kHz | 0.19963087 | 0.0485 % | 0.199273 | 0.200727 | -0.1846 % | 0.3150 % | PASS 57.91 % | |
| 200 mV AC+DC @ 200.0 kHz | 0.19912013 | 0.0800 % | 0.195790 | 0.204210 | -0.4399 % | 2.0250 % | PASS 21.71 % | |
| 200 mV AC+DC @ 300.0 kHz | 0.19872809 | 0.0800 % | 0.195790 | 0.204210 | -0.6360 % | 2.0250 % | PASS 31.38 % | |
| 200 mV AC+DC @ 500.0 kHz | 0.19911987 | 0.1200 % | 0.195360 | 0.204640 | -0.4401 % | 2.2000 % | PASS 19.97 % | |
| 200 mV AC+DC @ 1.0 MHz | 0.20093815 | 0.2600 % | 0.195080 | 0.204920 | 0.4691 % | 2.2000 % | PASS 21.17 % | |
| 2.0 V AC+DC @ 10 Hz | 1.9999934 | 0.0220 % | 1.994260 | 2.005740 | -0.0003 % | 0.2650 % | PASS 0.13 % | |
| 2.0 V AC+DC @ 20 Hz | 2.0000402 | 0.0083 % | 1.994535 | 2.005465 | 0.0020 % | 0.2650 % | PASS 0.76 % | |
| 2.0 V AC+DC @ 50 Hz | 2.0000775 | 0.0041 % | 1.999118 | 2.000882 | 0.0039 % | 0.0400 % | PASS 9.64 % | |
| 2.0 V AC+DC @ 60 Hz | 2.0000863 | 0.0041 % | 1.999118 | 2.000882 | 0.0043 % | 0.0400 % | PASS 10.73 % | |
| 2.0 V AC+DC @ 100 Hz | 2.0000782 | 0.0041 % | 1.999118 | 2.000882 | 0.0039 % | 0.0400 % | PASS 9.73 % | |
| 2.0 V AC+DC @ 1.0 kHz | 2.0001612 | 0.0041 % | 1.999118 | 2.000882 | 0.0081 % | 0.0400 % | PASS 20.06 % | |
| 2.0 V AC+DC @ 6.25 kHz | 2.0000862 | 0.0041 % | 1.999018 | 2.000982 | 0.0043 % | 0.0450 % | PASS 9.53 % | |
| 2.0 V AC+DC @ 10.0 kHz | 2.0000965 | 0.0041 % | 1.999018 | 2.000982 | 0.0048 % | 0.0450 % | PASS 10.69 % | |
| 2.0 V AC+DC @ 20.0 kHz | 2.0000668 | 0.0041 % | 1.999018 | 2.000982 | 0.0033 % | 0.0450 % | PASS 7.39 % | |
| 2.0 V AC+DC @ 50.0 kHz | 1.9994507 | 0.0070 % | 1.998460 | 2.001540 | -0.0275 % | 0.0700 % | PASS 39.04 % | |
| 2.0 V AC+DC @ 100.0 kHz | 1.9970794 | 0.0115 % | 1.993470 | 2.006530 | -0.1460 % | 0.3150 % | PASS 46.33 % | |
| 2.0 V AC+DC @ 200.0 kHz | 1.9914161 | 0.0340 % | 1.958820 | 2.041180 | -0.4292 % | 2.0250 % | PASS 21.19 % | |
| 2.0 V AC+DC @ 300.0 kHz | 1.9886353 | 0.0340 % | 1.958820 | 2.041180 | -0.5682 % | 2.0250 % | PASS 28.06 % | |
| 2.0 V AC+DC @ 500.0 kHz | 1.9885206 | 0.0900 % | 1.954200 | 2.045800 | -0.5740 % | 2.2000 % | PASS 26.07 % | |
| 2.0 V AC+DC @ 1.0 MHz | 1.9964337 | 0.1500 % | 1.953000 | 2.047000 | -0.1783 % | 2.2000 % | PASS 8.09 % | |
| 20 V AC+DC @ 10 Hz | 19.994494 | 0.0220 % | 19.915600 | 20.084400 | -0.0275 % | 0.4000 % | PASS 6.87 % | |
| 20 V AC+DC @ 20 Hz | 19.995067 | 0.0083 % | 19.918350 | 20.081650 | -0.0247 % | 0.4000 % | PASS 6.16 % | |
| 20 V AC+DC @ 50 Hz | 19.996118 | 0.0040 % | 19.963210 | 20.036790 | -0.0194 % | 0.1800 % | PASS 10.78 % | |
| 20 V AC+DC @ 60 Hz | 19.996405 | 0.0040 % | 19.963210 | 20.036790 | -0.0180 % | 0.1800 % | PASS 9.99 % | |
| 20 V AC+DC @ 100 Hz | 19.997239 | 0.0040 % | 19.963210 | 20.036790 | -0.0138 % | 0.1800 % | PASS 7.67 % | |
| 20 V AC+DC @ 1.0 kHz | 19.997798 | 0.0040 % | 19.963210 | 20.036790 | -0.0110 % | 0.1800 % | PASS 6.12 % | |
| 20 V AC+DC @ 6.25 kHz | 19.995537 | 0.0040 % | 19.959210 | 20.040790 | -0.0223 % | 0.2000 % | PASS 11.15 % | |
| 20 V AC+DC @ 10.0 kHz | 19.996914 | 0.0040 % | 19.959210 | 20.040790 | -0.0154 % | 0.2000 % | PASS 7.71 % | |
| 20 V AC+DC @ 20.0 kHz | 20.001132 | 0.0040 % | 19.959210 | 20.040790 | 0.0057 % | 0.2000 % | PASS 2.83 % | |
| 20 V AC+DC @ 50.0 kHz | 20.005096 | 0.0070 % | 19.954600 | 20.045400 | 0.0255 % | 0.2200 % | PASS 11.57 % | |
| 20 V AC+DC @ 100.0 kHz | 19.994132 | 0.0100 % | 19.908000 | 20.092000 | -0.0293 % | 0.4500 % | PASS 6.52 % | |
| 20 V AC+DC @ 200.0 kHz | 19.979031 | 0.0280 % | 19.144400 | 20.855600 | -0.1048 % | 4.2500 % | PASS 2.47 % | |
| 20 V AC+DC @ 300.0 kHz | 19.990482 | 0.0280 % | 19.144400 | 20.855600 | -0.0476 % | 4.2500 % | PASS 1.12 % | |
| 20 V AC+DC @ 500.0 kHz | 20.076183 | 0.0900 % | 18.782000 | 21.218000 | 0.3809 % | 6.0000 % | PASS 6.35 % | |
| 20 V AC+DC @ 1.0 MHz | 20.415273 | 0.1400 % | 18.772000 | 21.228000 | 2.0764 % | 6.0000 % | PASS 34.60 % | |
| 200.0 V AC+DC @ 10 Hz | 200.00693 | 0.0220 % | 199.426000 | 200.574000 | 0.0035 % | 0.2650 % | PASS 1.30 % | |
| 200.0 V AC+DC @ 20 Hz | 200.01210 | 0.0083 % | 199.453500 | 200.546500 | 0.0061 % | 0.2650 % | PASS 2.28 % | |
| 200.0 V AC+DC @ 50 Hz | 200.01497 | 0.0048 % | 199.900400 | 200.099600 | 0.0075 % | 0.0450 % | PASS 16.55 % | |
| 200.0 V AC+DC @ 60 Hz | 200.01395 | 0.0048 % | 199.900400 | 200.099600 | 0.0070 % | 0.0450 % | PASS 15.41 % | |
| 200.0 V AC+DC @ 100 Hz | 200.01495 | 0.0048 % | 199.900400 | 200.099600 | 0.0075 % | 0.0450 % | PASS 16.52 % | |
| 200.0 V AC+DC @ 1.0 kHz | 200.00601 | 0.0048 % | 199.900400 | 200.099600 | 0.0030 % | 0.0450 % | PASS 6.63 % | |
| 200.0 V AC+DC @ 6.25 kHz | 199.99039 | 0.0048 % | 199.860400 | 200.139600 | -0.0048 % | 0.0650 % | PASS 7.37 % | |
| 200.0 V AC+DC @ 10.0 kHz | 200.00736 | 0.0048 % | 199.860400 | 200.139600 | 0.0037 % | 0.0650 % | PASS 5.65 % | |
| 200.0 V AC+DC @ 20.0 kHz | 200.04728 | 0.0048 % | 199.860400 | 200.139600 | 0.0236 % | 0.0650 % | PASS 36.27 % | |
| 200.0 V AC+DC @ 50.0 kHz | 200.04669 | 0.0075 % | 199.815000 | 200.185000 | 0.0233 % | 0.0850 % | PASS 27.36 % | |
| 200.0 V AC+DC @ 100.0 kHz | 199.76928 | 0.0133 % | 199.343500 | 200.656500 | -0.1154 % | 0.3150 % | PASS 36.59% | |
| 700.0 V AC+DC @ 50 Hz | 700.3989 | 0.0079 % | 699.101952 | 700.898048 | 0.0570 % | 0.1204 % | PASS 47.22 % | |
| 700.0 V AC+DC @ 60 Hz | 700.4240 | 0.0079 % | 699.101952 | 700.898048 | 0.0606 % | 0.1204 % | PASS 50.19 % | |
| 700.0 V AC+DC @ 100 Hz | 700.4410 | 0.0079 % | 699.101952 | 700.898048 | 0.0630 % | 0.1204 % | PASS 52.20 % | |
| 700.0 V AC+DC @ 1.0 kHz | 700.3784 | 0.0079 % | 699.101952 | 700.898048 | 0.0541 % | 0.1204 % | PASS 44.80 % | |
Table 6: AC Voltage gain and flatness performance, as received
AC Voltage meets all specs quite nicely, with just one questionable point at 20 mV with maximum frequency 1 MHz. Keithley 2002 has an AC auto-calibration function which uses internal DAC to perform self-adjustment of flatness. No external equipment is required for this procedure and it’s recommended to run any time when 2002 used for high precision AC measurements.
Timing of the test for higher 2A current range is important, since high currents cause small but noticeable heating of the power shunt used in Keithley 2002. As a result, warm-up time for self-heating was set at 5 minutes, after which measurement values are recorded in the dataset. This will be shown in more detail later after adjustment.
| Keithley 2002,0789419,A08/A02, Last adjustment date 1.AUG.2005. Performance verification xDevs.com Rev.2556/2553 17.NOV.2022 | ||||||||
|---|---|---|---|---|---|---|---|---|
| Procedure for all test points that verify Gain of the DC Current ACI. 2-wire connection at LO and DCI is used between DMM and MFC. | ||||||||
| DCI Test | 100nA-1A | DUT | Source unc. | Low Limit | Hi limit | Measured | 24h spec | Result |
| Zero µADC | 0 | 2.1E-10 | * ZERO REF* | |||||
| 1 µADC | 1E-06 | 1.000275E-06 | 1619.37 ppm | 9.971316E-07 | 1.002868E-06 | 0.027 % | 1249 ppm | PASS 13.45 % |
| 2 µADC | 2E-06 | 2.00022E-06 | 821.32 ppm | 1.997058E-06 | 2.002942E-06 | 110.0 ppm | 649 ppm | PASS 10.51 % |
| -1 µADC | -1E-06 | -9.9969E-07 | 1619.37 ppm | -1.00287E-06 | -9.971296E-07 | -0.031 % | 1251 ppm | PASS 15.15 % |
| -2 µADC | -2E-06 | -1.99964E-06 | 821.32 ppm | -2.002944E-06 | -1.997056E-06 | -180.0 ppm | 651 ppm | PASS 17.18 % |
| Zero 00 µADC | 0 | 3.3E-10 | * ZERO REF* | |||||
| 10 µADC | 1E-05 | 1.000007E-05 | 181.97 ppm | 9.996481E-06 | 1.000352E-05 | 7.0 ppm | 170 ppm | PASS 2.81 % |
| 20 µADC | 2E-05 | 1.9999875E-05 | 101.99 ppm | 1.999576E-05 | 2.000424E-05 | -6.3 ppm | 110 ppm | PASS 4.17 % |
| -10 µADC | -1E-05 | -9.99947E-06 | 181.97 ppm | -1.000352E-05 | -9.996479E-06 | -53.0 ppm | 170 ppm | PASS 21.28 % |
| 20 µADC | -2E-05 | -1.999935E-05 | 101.99 ppm | -2.000424E-05 | -1.999576E-05 | -32.5 ppm | 110 ppm | PASS 21.66 % |
| Zero 000 µADC | 0 | 2.8E-10 | * ZERO REF* | |||||
| 100 µADC | 0.0001 | 9.9997835E-05 | 38.00 ppm | 9.999E-05 | 0.00010001 | -21.7 ppm | 62 ppm | PASS 29.78 % |
| 200 µADC | 0.0002 | 0.00019999464 | 30.00 ppm | 0.0001999828 | 0.0002000172 | -26.8 ppm | 56 ppm | PASS 42.19 % |
| -100 µADC | -0.0001 | -9.999813E-05 | 38.00 ppm | -0.00010001 | -9.999E-05 | -18.7 ppm | 62 ppm | PASS 25.71 % |
| -200 µADC | -0.0002 | -0.00019999641 | 30.00 ppm | -0.0002000172 | -0.0001999828 | -17.9 ppm | 56 ppm | PASS 28.25 % |
| Zero mADC | 0 | 3.85E-10 | * ZERO REF* | |||||
| -1.0 mADC | 0.001 | 0.0009999885 | 26.00 ppm | 0.000999914 | 0.001000086 | -11.5 ppm | 60 ppm | PASS 17.59 % |
| 2.0 mADC | 0.002 | 0.0019999703 | 24.00 ppm | 0.001999842 | 0.002000158 | -14.8 ppm | 55 ppm | PASS 24.71 % |
| -1.0 mADC | -0.001 | -0.0009999983 | 26.00 ppm | -0.001000086 | -0.000999914 | -1.7 ppm | 60 ppm | PASS 2.60 % |
| -2.0 mADC | -0.002 | -0.001999996 | 24.00 ppm | -0.002000158 | -0.001999842 | -2.0 ppm | 55 ppm | PASS 3.33 % |
| Zero 00 mADC | 0 | 2.9E-10 | * ZERO REF* | |||||
| 10 mADC | 0.01 | 0.010000847 | 26.00 ppm | 0.00999914 | 0.01000086 | 84.7 ppm | 60 ppm | FAIL 129.53 % |
| 20 mADC | 0.02 | 0.020001652 | 24.00 ppm | 0.01999842 | 0.02000158 | 82.6 ppm | 55 ppm | FAIL 137.65 % |
| -10 mADC | -0.01 | -0.010000939 | 26.00 ppm | -0.01000086 | -0.00999914 | 93.9 ppm | 60 ppm | FAIL 143.52 % |
| -20 mADC | -0.02 | -0.020001849 | 24.00 ppm | -0.02000158 | -0.01999842 | 92.5 ppm | 55 ppm | FAIL 154.06 % |
| Zero 000 mADC | 0 | 2.95E-10 | * ZERO REF* | |||||
| 100 mADC | 0.1 | 0.10001127 | 27.50 ppm | 0.09998875 | 0.1000112 | 112.7 ppm | 85 ppm | FAIL 126.15 % |
| 200 mADC | 0.2 | 0.20001827 | 26.25 ppm | 0.1999788 | 0.2000212 | 91.3 ppm | 80 ppm | FAIL 108.50 % |
| -100 mADC | -0.1 | -0.10001272* | 27.50 ppm | -0.1000113 | -0.09998875 | 127.2 ppm | 85 ppm | FAIL 142.32 % |
| -200 mADC | -0.2 | -0.20002186* | 26.25 ppm | -0.2000213 | -0.1999787 | 109.3 ppm | 80 ppm | FAIL 129.82 % |
| Zero ADC | 0 | 3.45E-10 | * ZERO REF* | |||||
| 1.0 ADC | 1 | 1.0001748 | 46.00 ppm | 0.999594 | 1.000406 | 174.8 ppm | 360 ppm | PASS 48.15 % |
| 2.0 ADC | 2 | 2.0006472 | 43.00 ppm | 1.999204 | 2.000796 | 323.6 ppm | 355 ppm | ?PASS 90.49 % |
| -1.0 ADC | -1 | -1.0003714 | 46.00 ppm | -1.000406 | -0.999594 | 371.4 ppm | 360 ppm | FAIL 102.33 % |
| -2.0 ADC | -2 | -2.0007092 | 43.00 ppm | -2.000796 | -1.999204 | 354.6 ppm | 355 ppm | ?PASS 99.17 % |
Table 7: DC Current gain performance, as received
DC Current ranges 2 mA and below meet specifications with good margin, which we cannot say about higher ranges.
AC Current specifications of Model 2002 are quite relaxed.
| Keithley 2002,0789419,A08/A02, Last adjustment date 1.AUG.005. Performance verification xDevs.com Rev.2556/2553 17.NOV.2022 | ||||||||
|---|---|---|---|---|---|---|---|---|
| Procedure for all test points that verify Gain of the AC Current ACI. 2-wire connection at LO and ACI is used between DMM and MFC. | ||||||||
| ACI Test | 200µA-2A | DUT | Source unc. | Low Limit | Hi limit | Measured | 24h spec | Result, % spec |
| 10 µA AC @ 50 Hz | 1e-05 | 9.746500e-06 | 0.0165 % | 9.95335E-06 | 1.00467E-05 | -2.5350 % | 0.4500 % | REF |
| 50 µA AC @ 50 Hz | 5e-05 | 5.000320e-05 | 0.0165 % | 4.98267E-05 | 5.01733E-05 | 0.0064 % | 0.3300 % | PASS 1.94 % |
| 100 µA AC @ 50 Hz | 0.0001 | 9.996970e-05 | 0.0165 % | 9.96685E-05 | 0.000100332 | -0.0303 % | 0.3150 % | PASS 9.61 % |
| 200 µA AC @ 50 Hz | 0.0002 | 1.998585e-04 | 0.0165 % | 0.000199352 | 0.000200648 | -0.0707 % | 0.3075 % | PASS 22.97 % |
| 1.0 mA AC @ 50 Hz | 0.001 | 9.992074e-04 | 0.0138 % | 0.000996847 | 0.00100315 | -0.0793 % | 0.3015 % | PASS 26.26 % |
| 2.0 mA AC @ 50 Hz | 0.002 | 1.998981e-03 | 0.0138 % | 0.00199371 | 0.00200629 | -0.0509 % | 0.3007 % | PASS 16.92 % |
| 10 mA AC @ 50 Hz | 0.01 | 9.994094e-03 | 0.0138 % | 0.00996847 | 0.0100315 | -0.0591 % | 0.3015 % | PASS 19.57 % |
| 50 mA AC @ 50 Hz | 0.02 | 1.999397e-02 | 0.0138 % | 0.0199371 | 0.0200629 | -0.0302 % | 0.3007 % | PASS 10.02 % |
| 100 mA AC @ 50 Hz | 0.1 | 9.998564e-02 | 0.0134 % | 0.0996851 | 0.100315 | -0.0144 % | 0.3015 % | PASS 4.76 % |
| 200 mA AC @ 50 Hz | 0.2 | 2.000254e-01 | 0.0134 % | 0.199372 | 0.200628 | 0.0127 % | 0.3007 % | PASS 4.22 % |
| 1.0 A AC @ 50 Hz | 1.0 | 9.993340e-01 | 0.0308 % | 0.996177 | 1.00382 | -0.0666 % | 0.3515 % | PASS 18.87 % |
| 2.0 A AC @ 50 Hz | 2.0 | 1.999735e+00 | 0.0308 % | 1.99237 | 2.00763 | -0.0132 % | 0.3507 % | PASS 3.76 % |
| 10 µA AC @ 60 Hz | 1e-05 | 9.725000e-06 | 0.0165 % | 9.96835E-06 | 1.00317E-05 | -2.7500 % | 0.3000 % | REF |
| 50 µA AC @ 60 Hz | 5e-05 | 4.998420e-05 | 0.0165 % | 4.99017E-05 | 5.00983E-05 | -0.0316 % | 0.1800 % | PASS 17.48 % |
| 100 µA AC @ 60 Hz | 0.0001 | 9.995960e-05 | 0.0165 % | 9.98185E-05 | 0.000100182 | -0.0404 % | 0.1650 % | PASS 24.36 % |
| 200 µA AC @ 60 Hz | 0.0002 | 1.998908e-04 | 0.0165 % | 0.000199652 | 0.000200348 | -0.0546 % | 0.1575 % | PASS 34.48 % |
| 1.0 mA AC @ 60 Hz | 0.001 | 9.992986e-04 | 0.0138 % | 0.000998347 | 0.00100165 | -0.0701 % | 0.1515 % | PASS 46.11 % |
| 2.0 mA AC @ 60 Hz | 0.002 | 1.999163e-03 | 0.0138 % | 0.00199671 | 0.00200329 | -0.0419 % | 0.1507 % | PASS 27.66 % |
| 10 mA AC @ 60 Hz | 0.01 | 9.994496e-03 | 0.0138 % | 0.00998347 | 0.0100165 | -0.0550 % | 0.1515 % | PASS 36.18 % |
| 20 mA AC @ 60 Hz | 0.02 | 1.999538e-02 | 0.0138 % | 0.0199671 | 0.0200329 | -0.0231 % | 0.1507 % | PASS 15.27 % |
| 100 mA AC @ 60 Hz | 0.1 | 9.999622e-02 | 0.0134 % | 0.0998351 | 0.100165 | -0.0038 % | 0.1515 % | PASS 2.49 % |
| 200 mA AC @ 60 Hz | 0.2 | 2.000415e-01 | 0.0134 % | 0.199672 | 0.200328 | 0.0207 % | 0.1507 % | PASS 13.70 % |
| 1.0 A AC @ 60 Hz | 1.0 | 9.994036e-01 | 0.0308 % | 0.997677 | 1.00232 | -0.0596 % | 0.2015 % | PASS 29.26 % |
| 2.0 A AC @ 60 Hz | 2.0 | 1.999852e+00 | 0.0308 % | 1.99537 | 2.00463 | -0.0074 % | 0.2007 % | PASS 3.64 % |
| 10 µA AC @ 1.0 kHz | 1e-05 | 9.748800e-06 | 0.0165 % | 9.97135E-06 | 1.00287E-05 | -2.5120 % | 0.2700 % | REF |
| 50 µA AC @ 1.0 kHz | 5e-05 | 5.001340e-05 | 0.0165 % | 4.99167E-05 | 5.00833E-05 | 0.0268 % | 0.1500 % | PASS 17.76 % |
| 100 µA AC @ 1.0 kHz | 0.0001 | 9.998950e-05 | 0.0165 % | 9.98485E-05 | 0.000100152 | -0.0105 % | 0.1350 % | PASS 7.72 % |
| 200 µA AC @ 1.0 kHz | 0.0002 | 1.999048e-04 | 0.0165 % | 0.000199712 | 0.000200288 | -0.0476 % | 0.1275 % | PASS 37.02 % |
| 1.0 mA AC @ 1.0 kHz | 0.001 | 9.995026e-04 | 0.0138 % | 0.000998647 | 0.00100135 | -0.0497 % | 0.1215 % | PASS 40.68 % |
| 2.0 mA AC @ 1.0 kHz | 0.002 | 1.999582e-03 | 0.0138 % | 0.00199731 | 0.00200269 | -0.0209 % | 0.1207 % | PASS 17.20 % |
| 10 mA AC @ 1.0 kHz | 0.01 | 9.997306e-03 | 0.0138 % | 0.00998647 | 0.0100135 | -0.0269 % | 0.1215 % | PASS 22.03 % |
| 20 mA AC @ 1.0 kHz | 0.02 | 2.000056e-02 | 0.0138 % | 0.0199731 | 0.0200269 | 0.0028 % | 0.1207 % | PASS 2.31 % |
| 100 mA AC @ 1.0 kHz | 0.1 | 1.000202e-01 | 0.0134 % | 0.0998351 | 0.100165 | 0.0201 % | 0.1515 % | PASS 13.25 % |
| 200 mA AC @ 1.0 kHz | 0.2 | 2.000937e-01 | 0.0134 % | 0.199672 | 0.200328 | 0.0469 % | 0.1507 % | PASS 30.96 % |
| 1.0 A AC @ 1.0 kHz | 1.0 | 9.996291e-01 | 0.0308 % | 0.995177 | 1.00482 | -0.0371 % | 0.4515 % | PASS 8.20 % |
| 2.0 A AC @ 1.0 kHz | 2.0 | 2.000269e+00 | 0.0308 % | 1.99037 | 2.00963 | 0.0135 % | 0.4507 % | PASS 2.98 % |
| 10 µA AC @ 10.0 kHz | 1e-05 | 9.746100e-06 | 0.1400 % | 9.946E-06 | 1.0054E-05 | -2.5390 % | 0.4000 % | REF |
| 50 µA AC @ 10.0 kHz | 5e-05 | 4.997330e-05 | 0.1400 % | 4.979E-05 | 5.021E-05 | -0.0534 % | 0.2800 % | PASS 17.06 % |
| 100 µA AC @ 10.0 kHz | 0.0001 | 9.990840e-05 | 0.1400 % | 9.9595E-05 | 0.000100405 | -0.0916 % | 0.2650 % | PASS 30.56 % |
| 200 µA AC @ 10.0 kHz | 0.0002 | 1.997320e-04 | 0.1400 % | 0.000199205 | 0.000200795 | -0.1340 % | 0.2575 % | PASS 45.72 % |
| 1.0 mA AC @ 10.0 kHz | 0.001 | 9.995984e-04 | 0.1400 % | 0.000996085 | 0.00100391 | -0.0402 % | 0.2515 % | PASS 13.95 % |
| 2.0 mA AC @ 10.0 kHz | 0.002 | 1.999529e-03 | 0.1400 % | 0.00199219 | 0.00200781 | -0.0235 % | 0.2507 % | PASS 8.19 % |
| 10 mA AC @ 10.0 kHz | 0.01 | 9.998181e-03 | 0.1300 % | 0.00996185 | 0.0100381 | -0.0182 % | 0.2515 % | PASS 6.43 % |
| 20 mA AC @ 10.0 kHz | 0.02 | 1.999977e-02 | 0.1300 % | 0.0199239 | 0.0200761 | -0.0012 % | 0.2507 % | PASS 0.41 % |
| 100 mA AC @ 10.0 kHz | 0.1 | 1.000690e-01 | 0.1100 % | 0.0993885 | 0.100611 | 0.0690 % | 0.5015 % | PASS 13.43 % |
| 200 mA AC @ 10.0 kHz | 0.2 | 2.001642e-01 | 0.1100 % | 0.198779 | 0.201221 | 0.0821 % | 0.5007 % | PASS 16.01 % |
| 1.0 A AC @ 10.0 kHz | 1.0 | 9.972691e-01 | 0.6100 % | 0.978885 | 1.02111 | -0.2731 % | 1.5015 % | PASS 16.85 % |
| 2.0 A AC @ 10.0 kHz | 2.0 | 1.992009e+00 | 0.6100 % | 1.95779 | 2.04221 | -0.3995 % | 1.5007 % | PASS 24.66 % |
Table 8: AC Current gain and flatness performance, as received
No problems were observed on either of the range or frequency here.
Additional functions, such as frequency, temperature, in-circuit current and scanner card options were not tested.
Now the initial performance test and calibration for the meter as received is concluded. Number of ranges and points are outside of 24-hour specification as expected due to very overdue calibration adjustment. Points above were checked during multiple runs with essentially the same outcome as presented in tables 2-8.
Now it is time to proceed with a more in depth look at a few performance aspects of this particular instrument and adjustment.
Temperature stability of Keithley 2002
Model 2002 depends on stability of internal circuitry, such as LTZ1000A-based zener voltage reference, precision Vishay VHP resistors for resistance function and stable current shunts. But even these high-end expensive components are affected by temperature and power changes.
To evaluate stability of various K2002 ranges DMM was placed in a sealed programmable temperature chamber with TEC elements. Total power applied to TEC elements was in the range 200-250W to maintain good temperature control with Keithley 2002 inside.
By changing temperature inside of the chamber and logging measurements data from the instrument we could easily calculate temperature effects and analyze thermal coefficient data of the instrument. Three temperature sweeps were performed on the instrument. Fluke 5720A 7½-digit multi-function calibrator used as a reference source. Each sweep had a set of calibration points measured in simple sequence, such as:
- Select 200 mV range, source 100 mV into DMM, wait soak time for signal to settle, take a reading.
- Select 200 mV range, source 190 mV into DMM, wait soak time for signal to settle, take a reading.
- Select 2 V range, source 1 V into DMM, wait soak time for signal to settle, take a reading.
- Select 2 V range, source 1.9 V into DMM, wait soak time for signal to settle, take a reading.
- Select 20 V range, source 10 V into DMM, wait soak time for signal to settle, take a reading.
- Select 20 V range, source 19 V into DMM, wait soak time for signal to settle, take a reading.
- Similar steps are done for the rest of the ranges and functions.
Then the whole cycle repeats with next temperature setting step. Temperature was slowly increased and decreased following smooth ramps. There was a hold time at the middle (+24°C point) for multiple hours to see if any effects related to hysteresis/settling time in box. Total sweep to capture few ranges at time took about 45 hours.

Image 8: Keithley 2002 in DIY thermal chamber
Results for DC Voltage, Resistance and DC current functions presented below in summary table 9. For DC voltage and DC current points multiple points were used to gain more confidence in TC measurements.
Each of these sweep datasets is done over multiple days with very slow temperature slopes to allow Keithley meters reach steady states and limit possible effect from thermal gradient changes. Changing temperature too fast would result in erroneous results due to time delay between ambient air temperature and internal instrument’s circuitry temperature change.
| Test range | Test points | Keithley 2002 specification | Measured, meets spec? | Data plot (clickable) |
|---|---|---|---|---|
| 0.2 VDC | 0.1 V, 0.19 V | ±2.0 ppm of rdg + ±1.8 ppm of range / K | -0.974 ppm/K, YES |  |
| 2 VDC | 1 V, 1.9V, 2.0V | ±0.2 ppm of rdg + ±0.18 ppm of range / K | -0.095 ppm/K, YES |  |
| 20 VDC | 7 V, 10 V, 19 V, 20 V | ±0.3 ppm of rdg + ±0.02 ppm of range / K | -0.25 ppm/K, YES |  |
| 200 VDC | 100 V, 190 V | ±1.5 ppm of rdg + ±0.3 ppm of range / K | +0.197 ppm/K, YES |  |
| 1000 VDC | 190 V, 219 V | ±1.5 ppm of rdg + ±0.06 ppm of range / K | +0.23 ppm/K, YES |  |
| 200 MΩ | 100.00499 MΩ | ±80 ppm of rdg + ±0.5 ppm of range / K | +0.17 ppm/K, YES | 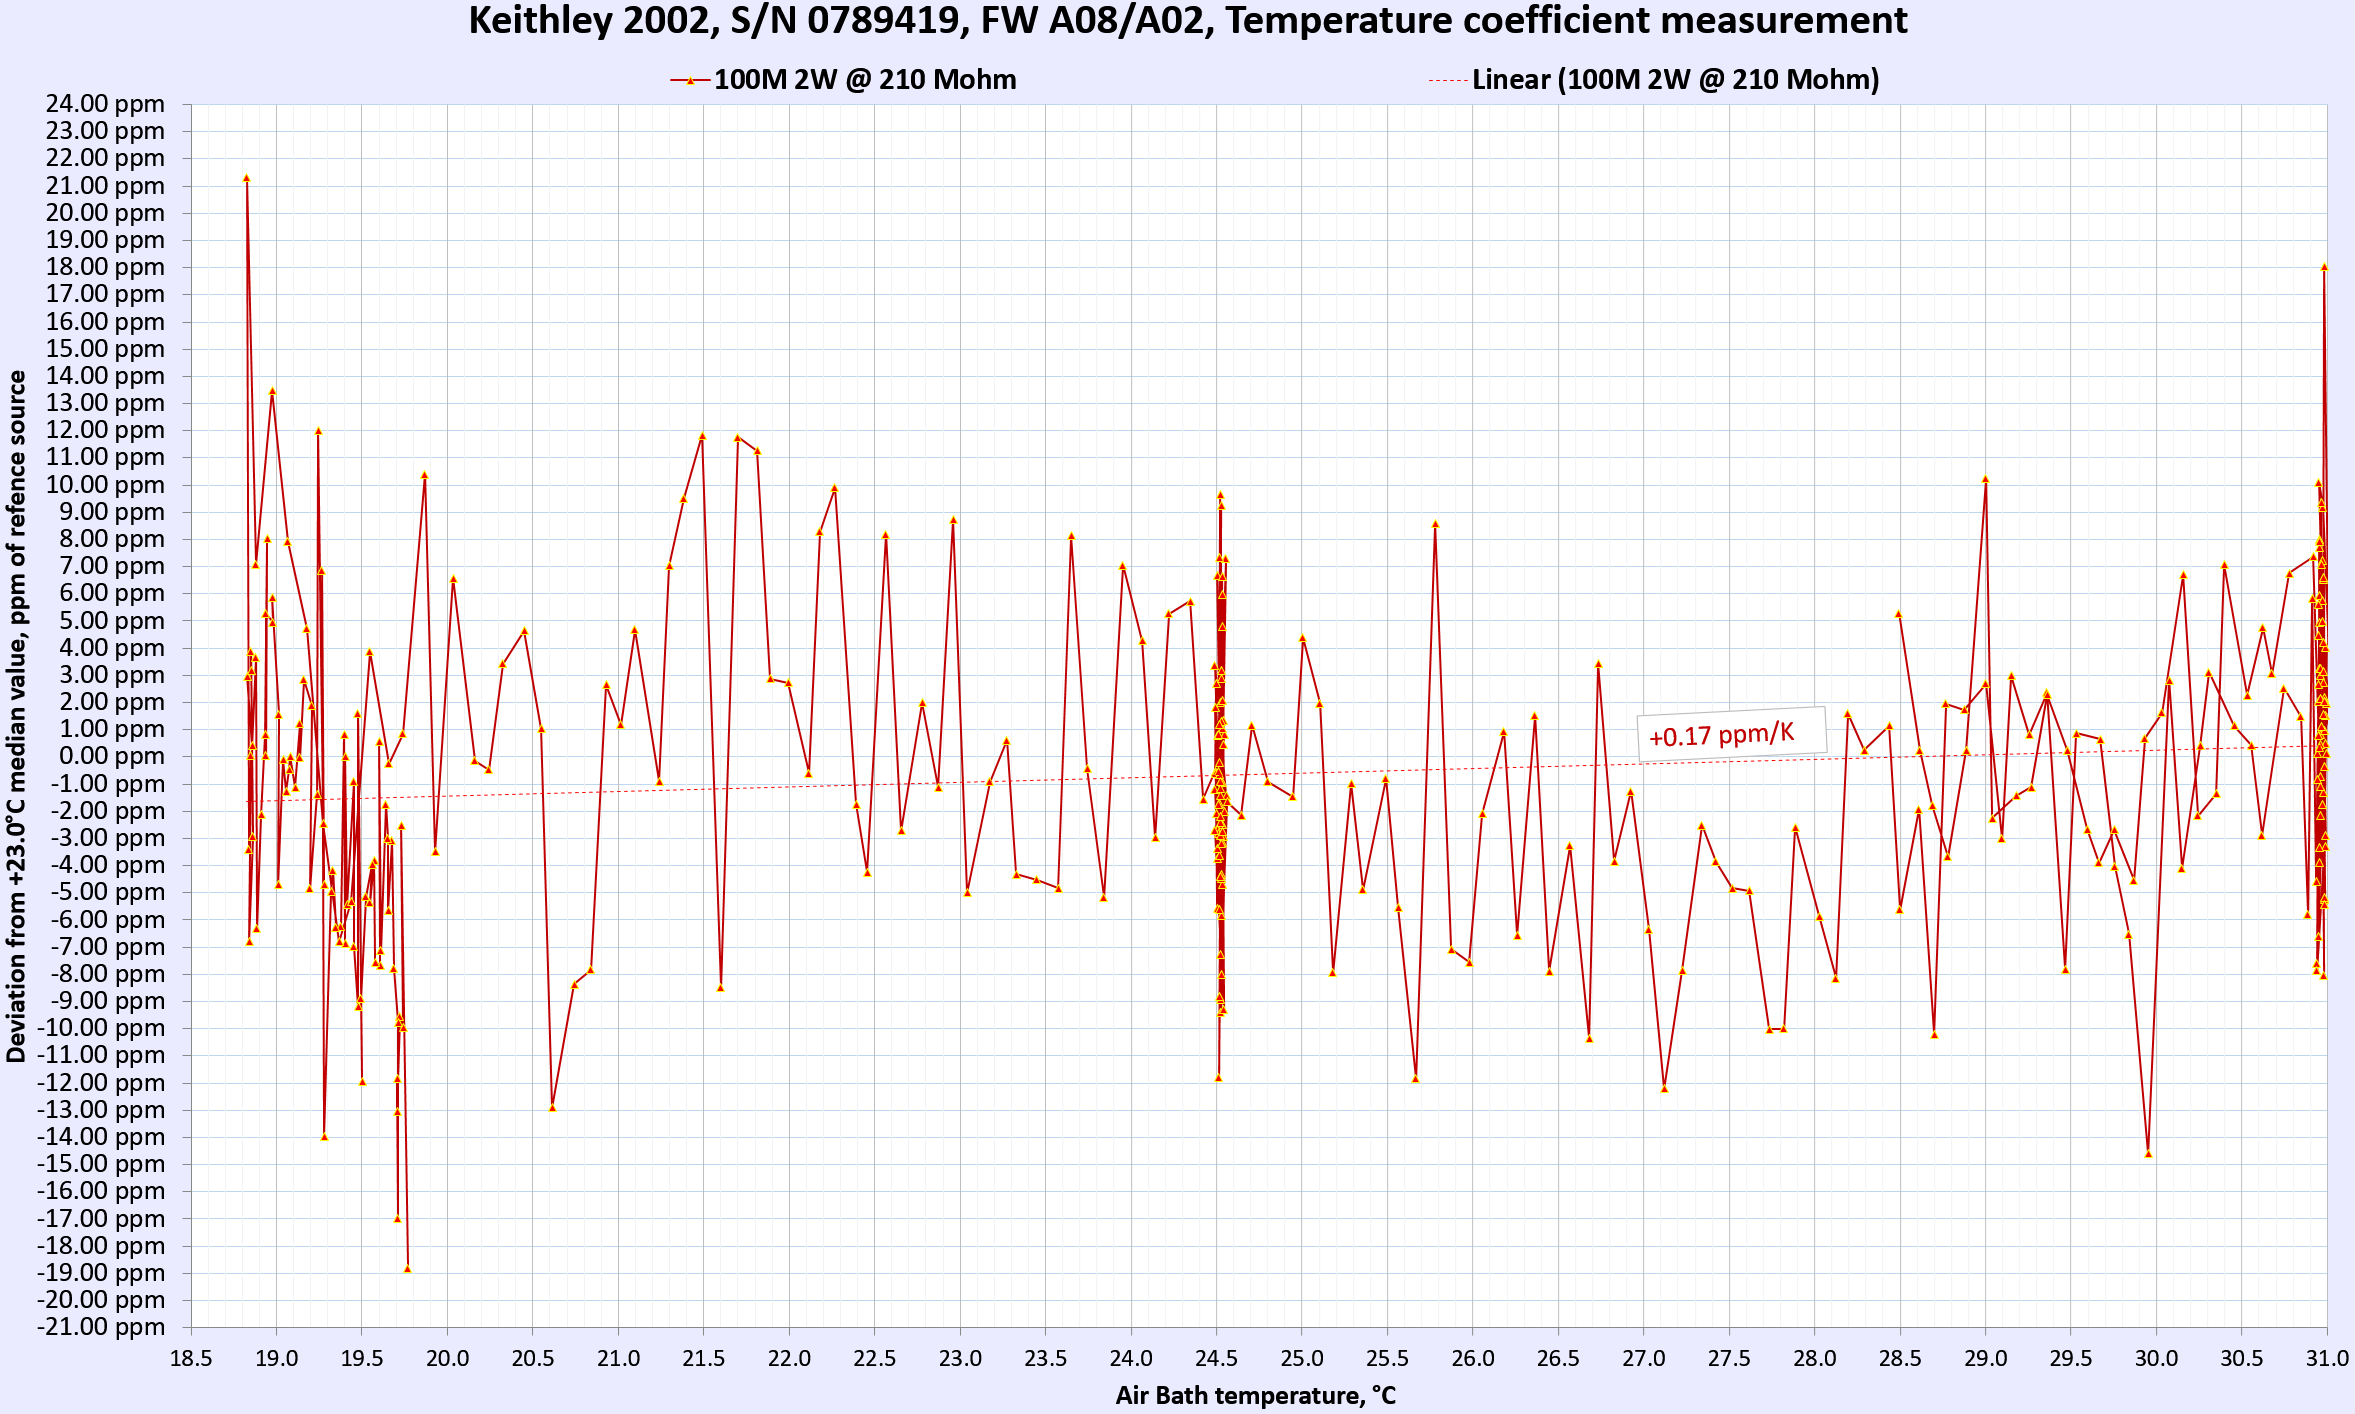 |
| 20 MΩ | 18.998781 MΩ | ±20 ppm of rdg + ±0.1 ppm of range / K | +0.36 ppm/K, YES |  |
| 2 MΩ | 1.8999821 MΩ | ±7 ppm of rdg + ±0.1 ppm of range / K | +2.21 ppm/K, YES |  |
| 200 kΩ | 189.98918 kΩ | ±3.5 ppm of rdg + ±0.18 ppm of range / K | +1.56 ppm/K, YES | 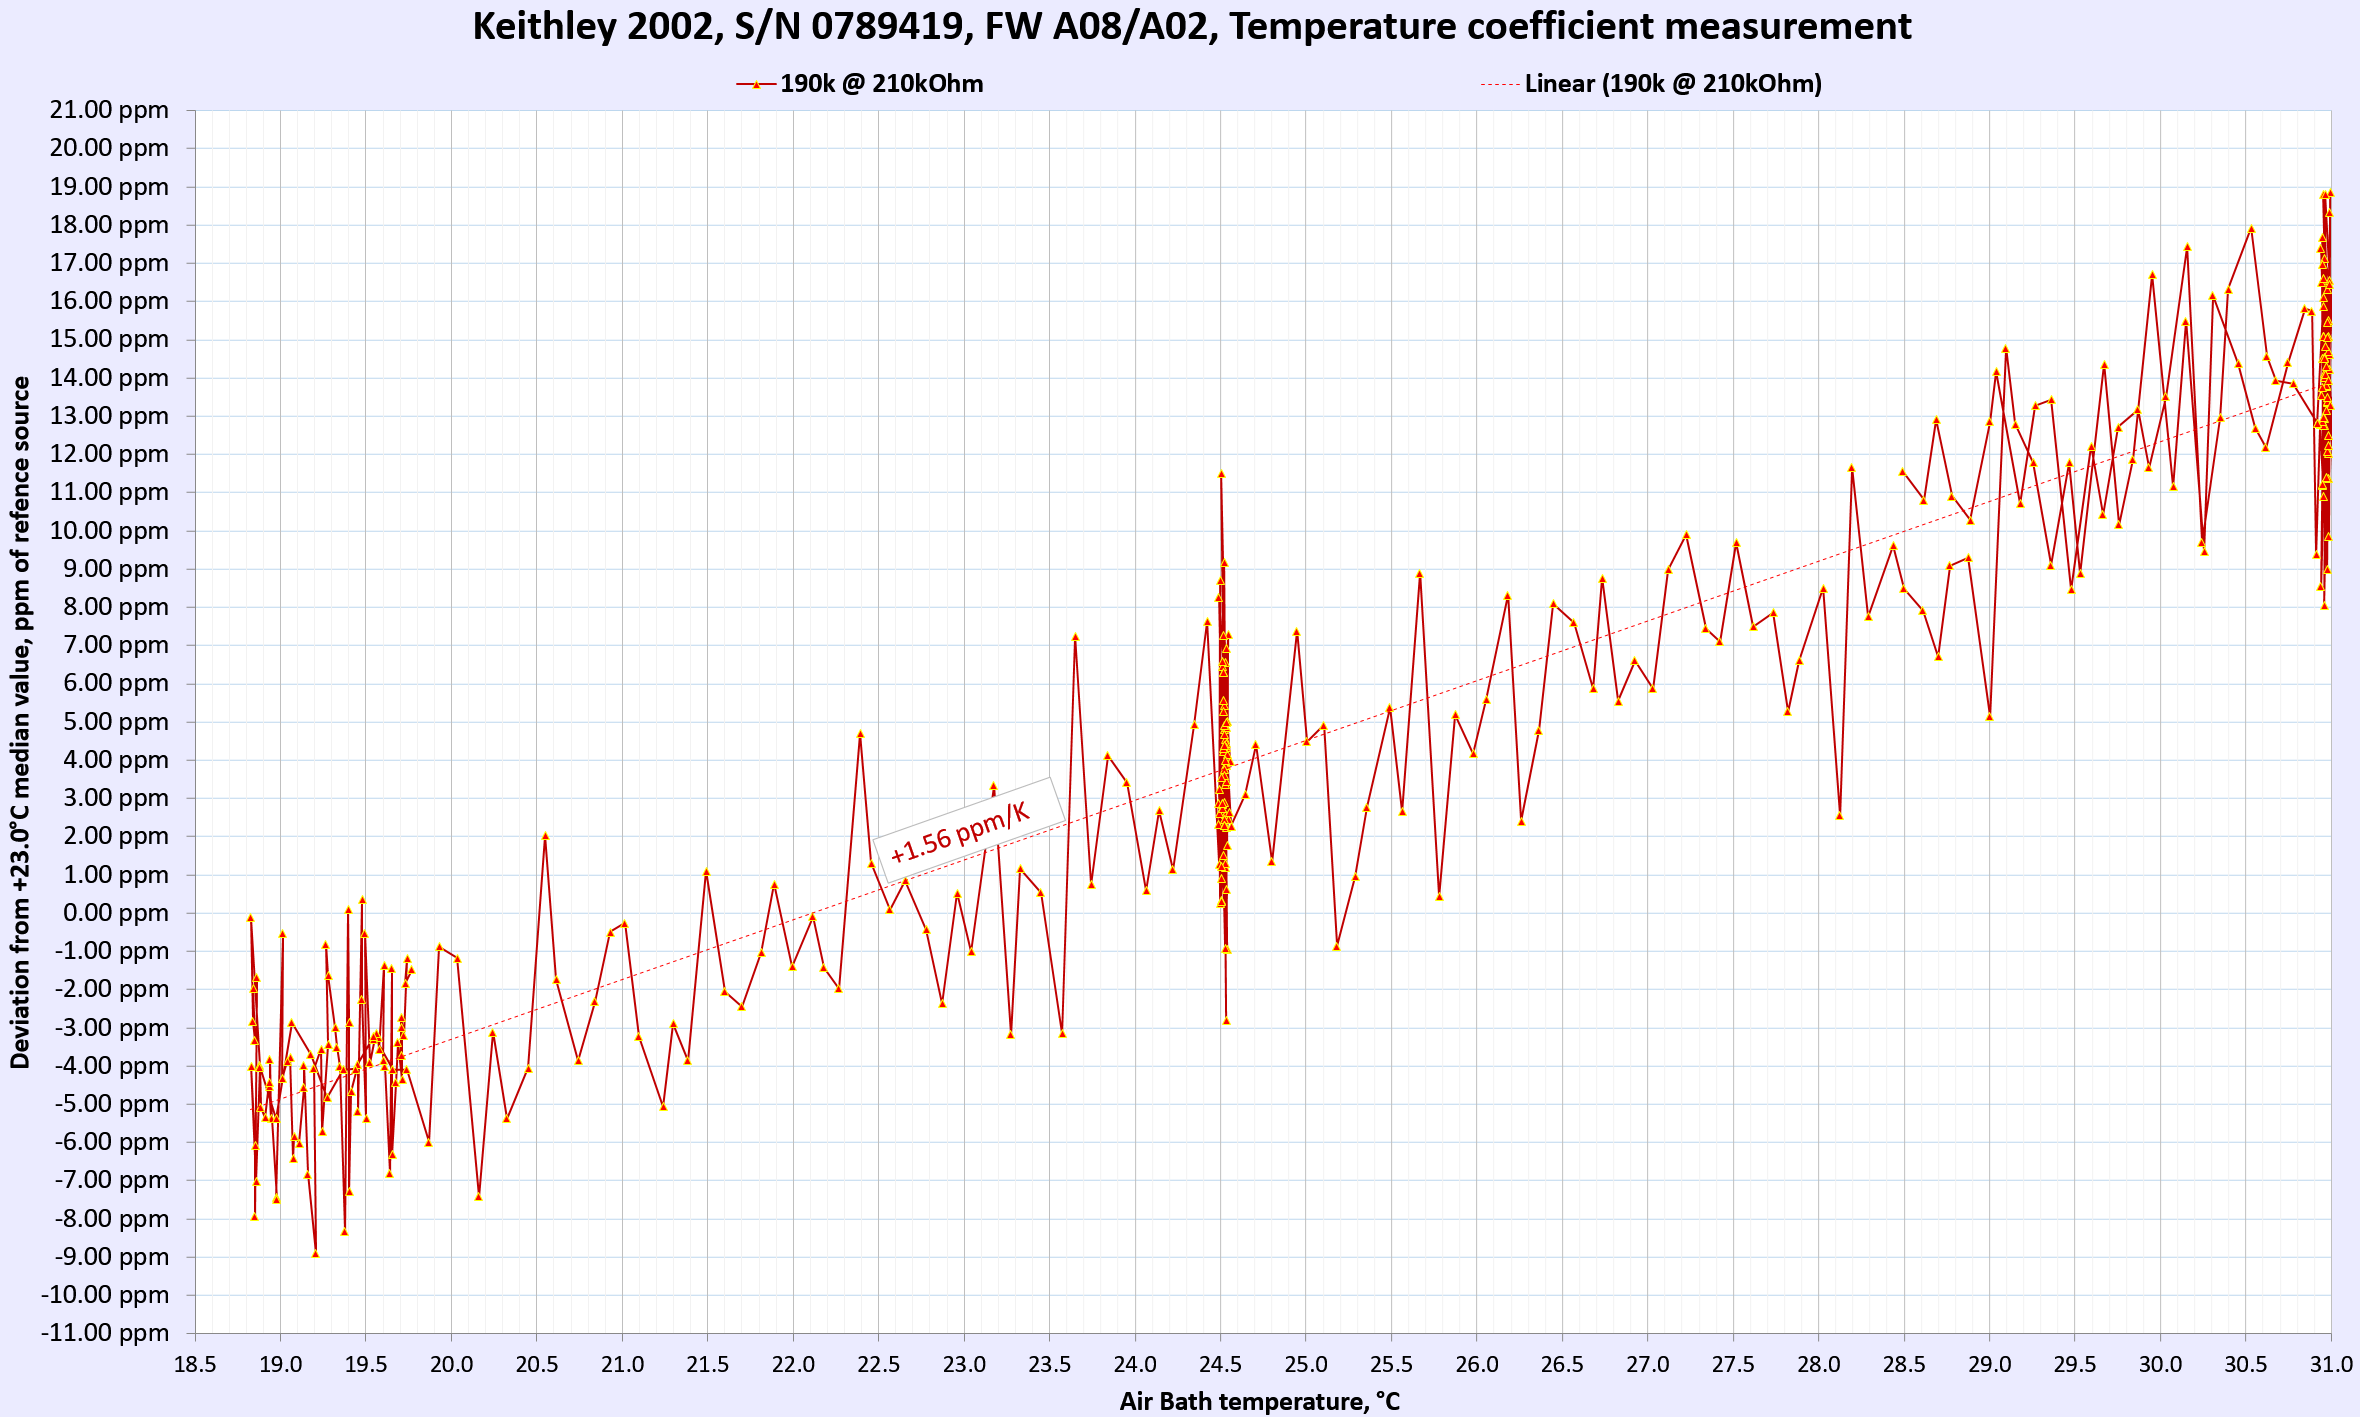 |
| 20 kΩ | 18999.277 Ω | ±0.8 ppm of rdg + ±0.05 ppm of range / K | -0.41 ppm/K, YES | 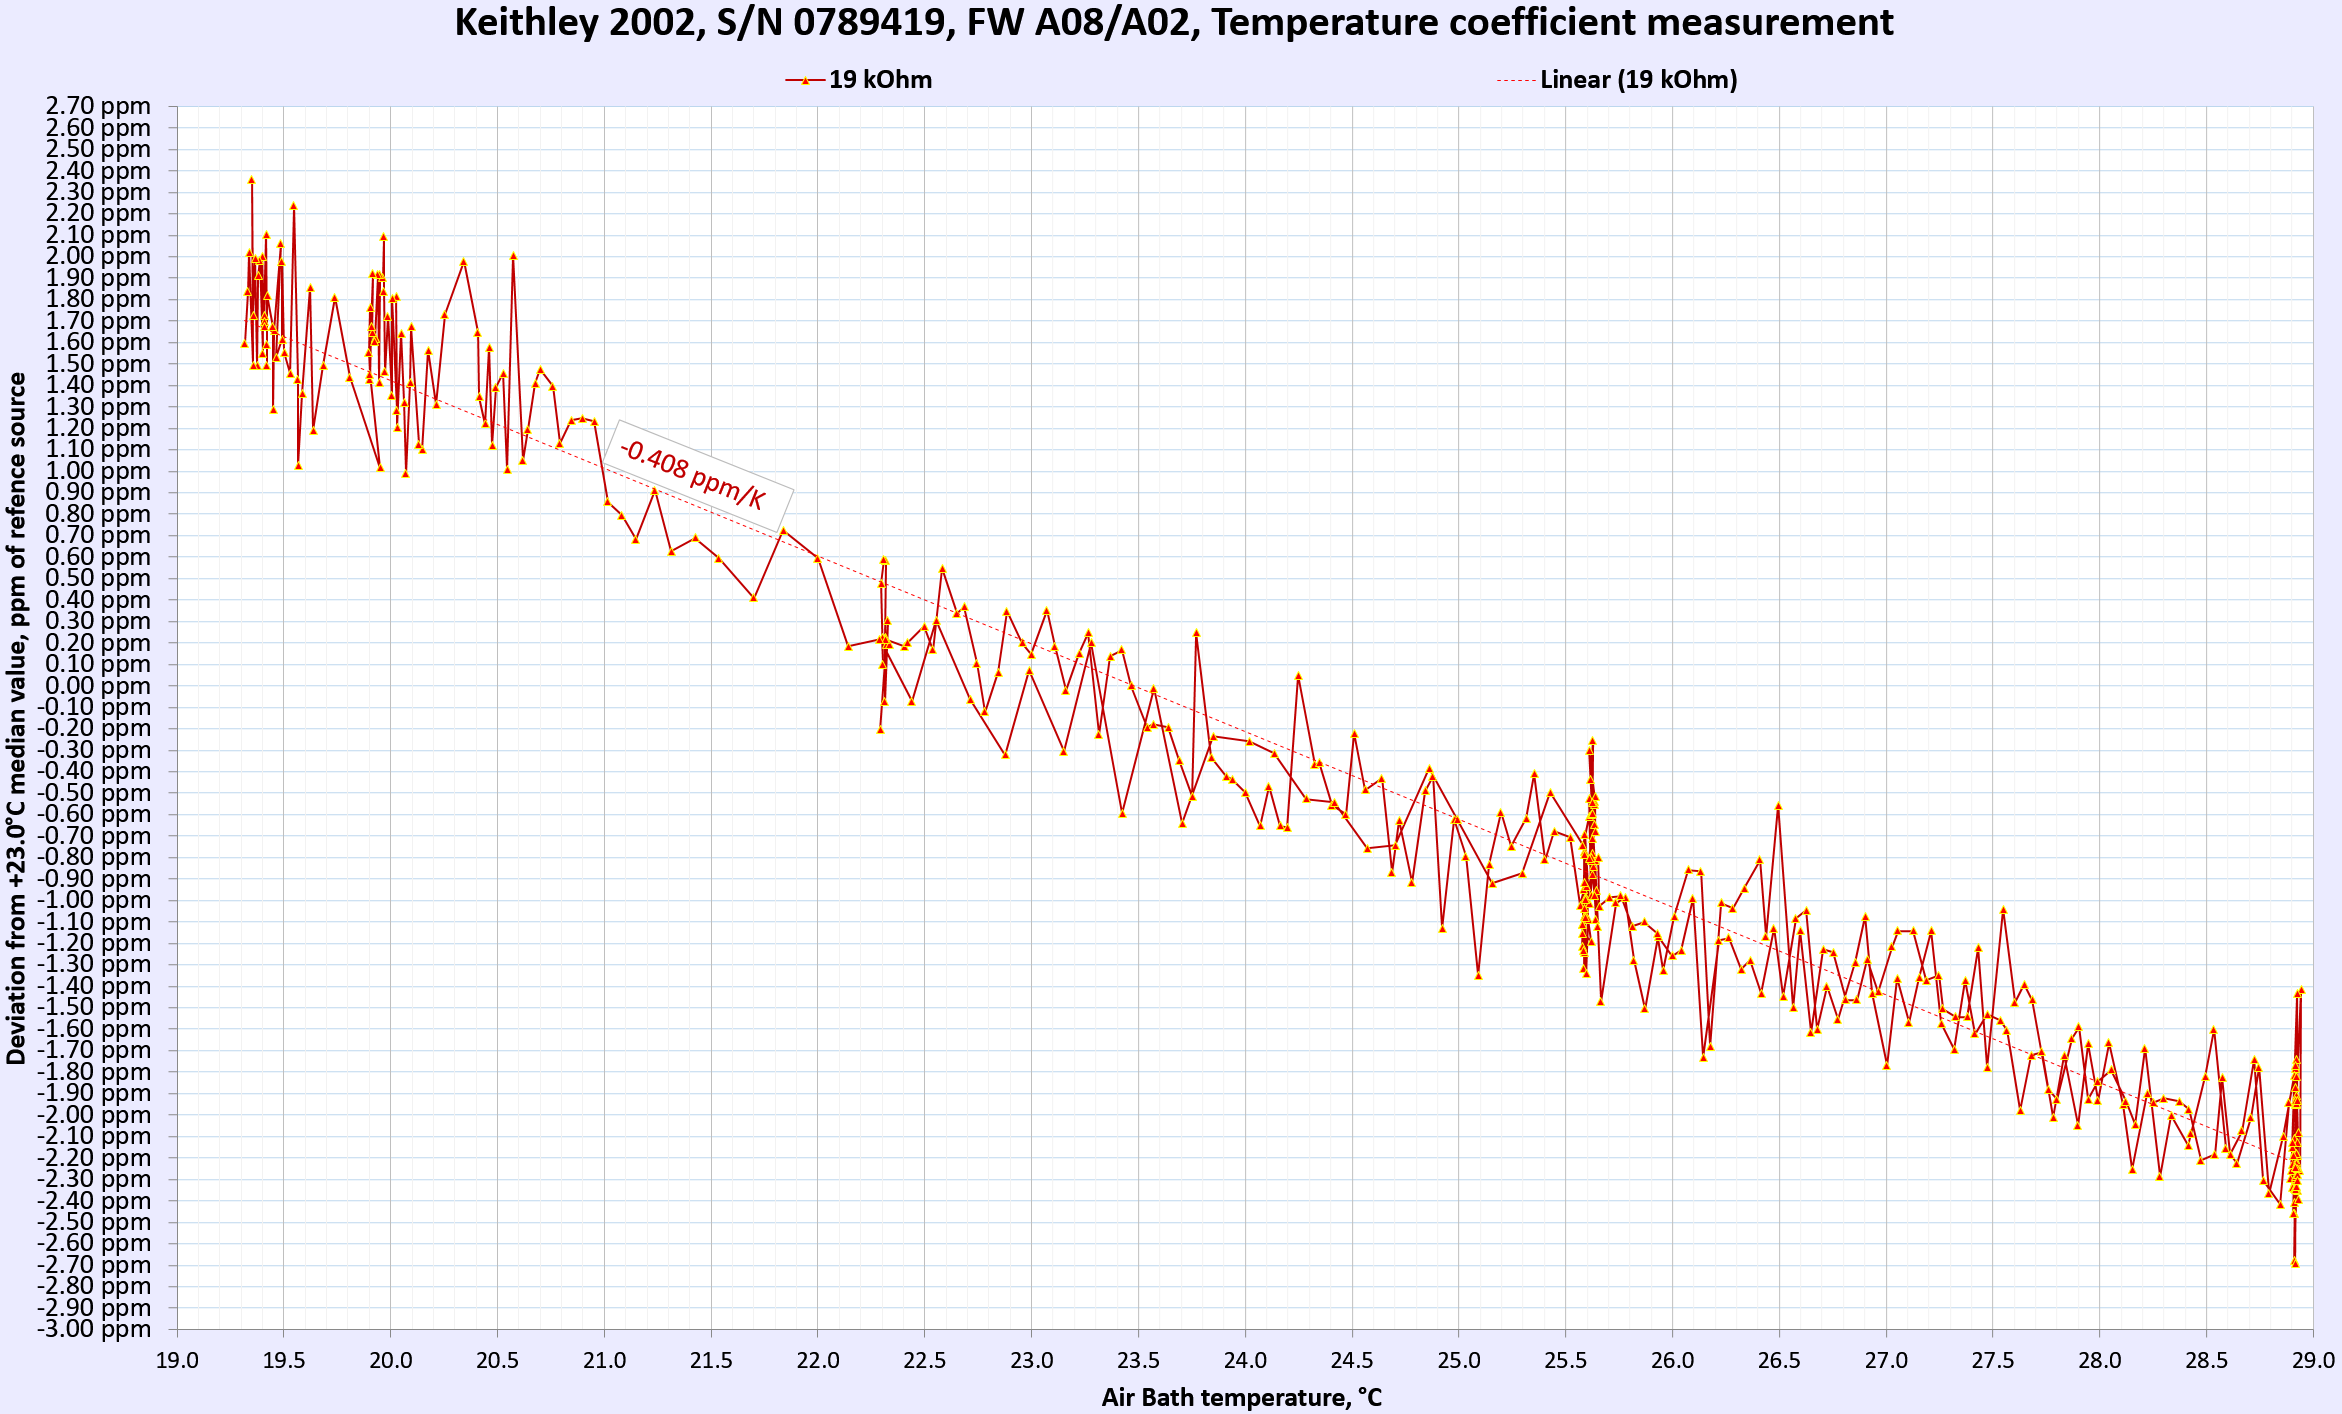 |
| 2 kΩ | 1899.880 Ω | ±0.8 ppm of rdg + ±0.05 ppm of range / K | -0.18 ppm/K, YES |  |
| 200 Ω | 189.99194 Ω | ±2.5 ppm of rdg + ±0.5 ppm of range / K | -1.29 ppm/K, YES |  |
| 20 Ω | 19.000192 Ω | ±2.5 ppm of rdg + ±0.7 ppm of range / K | -0.69 ppm/K, YES | 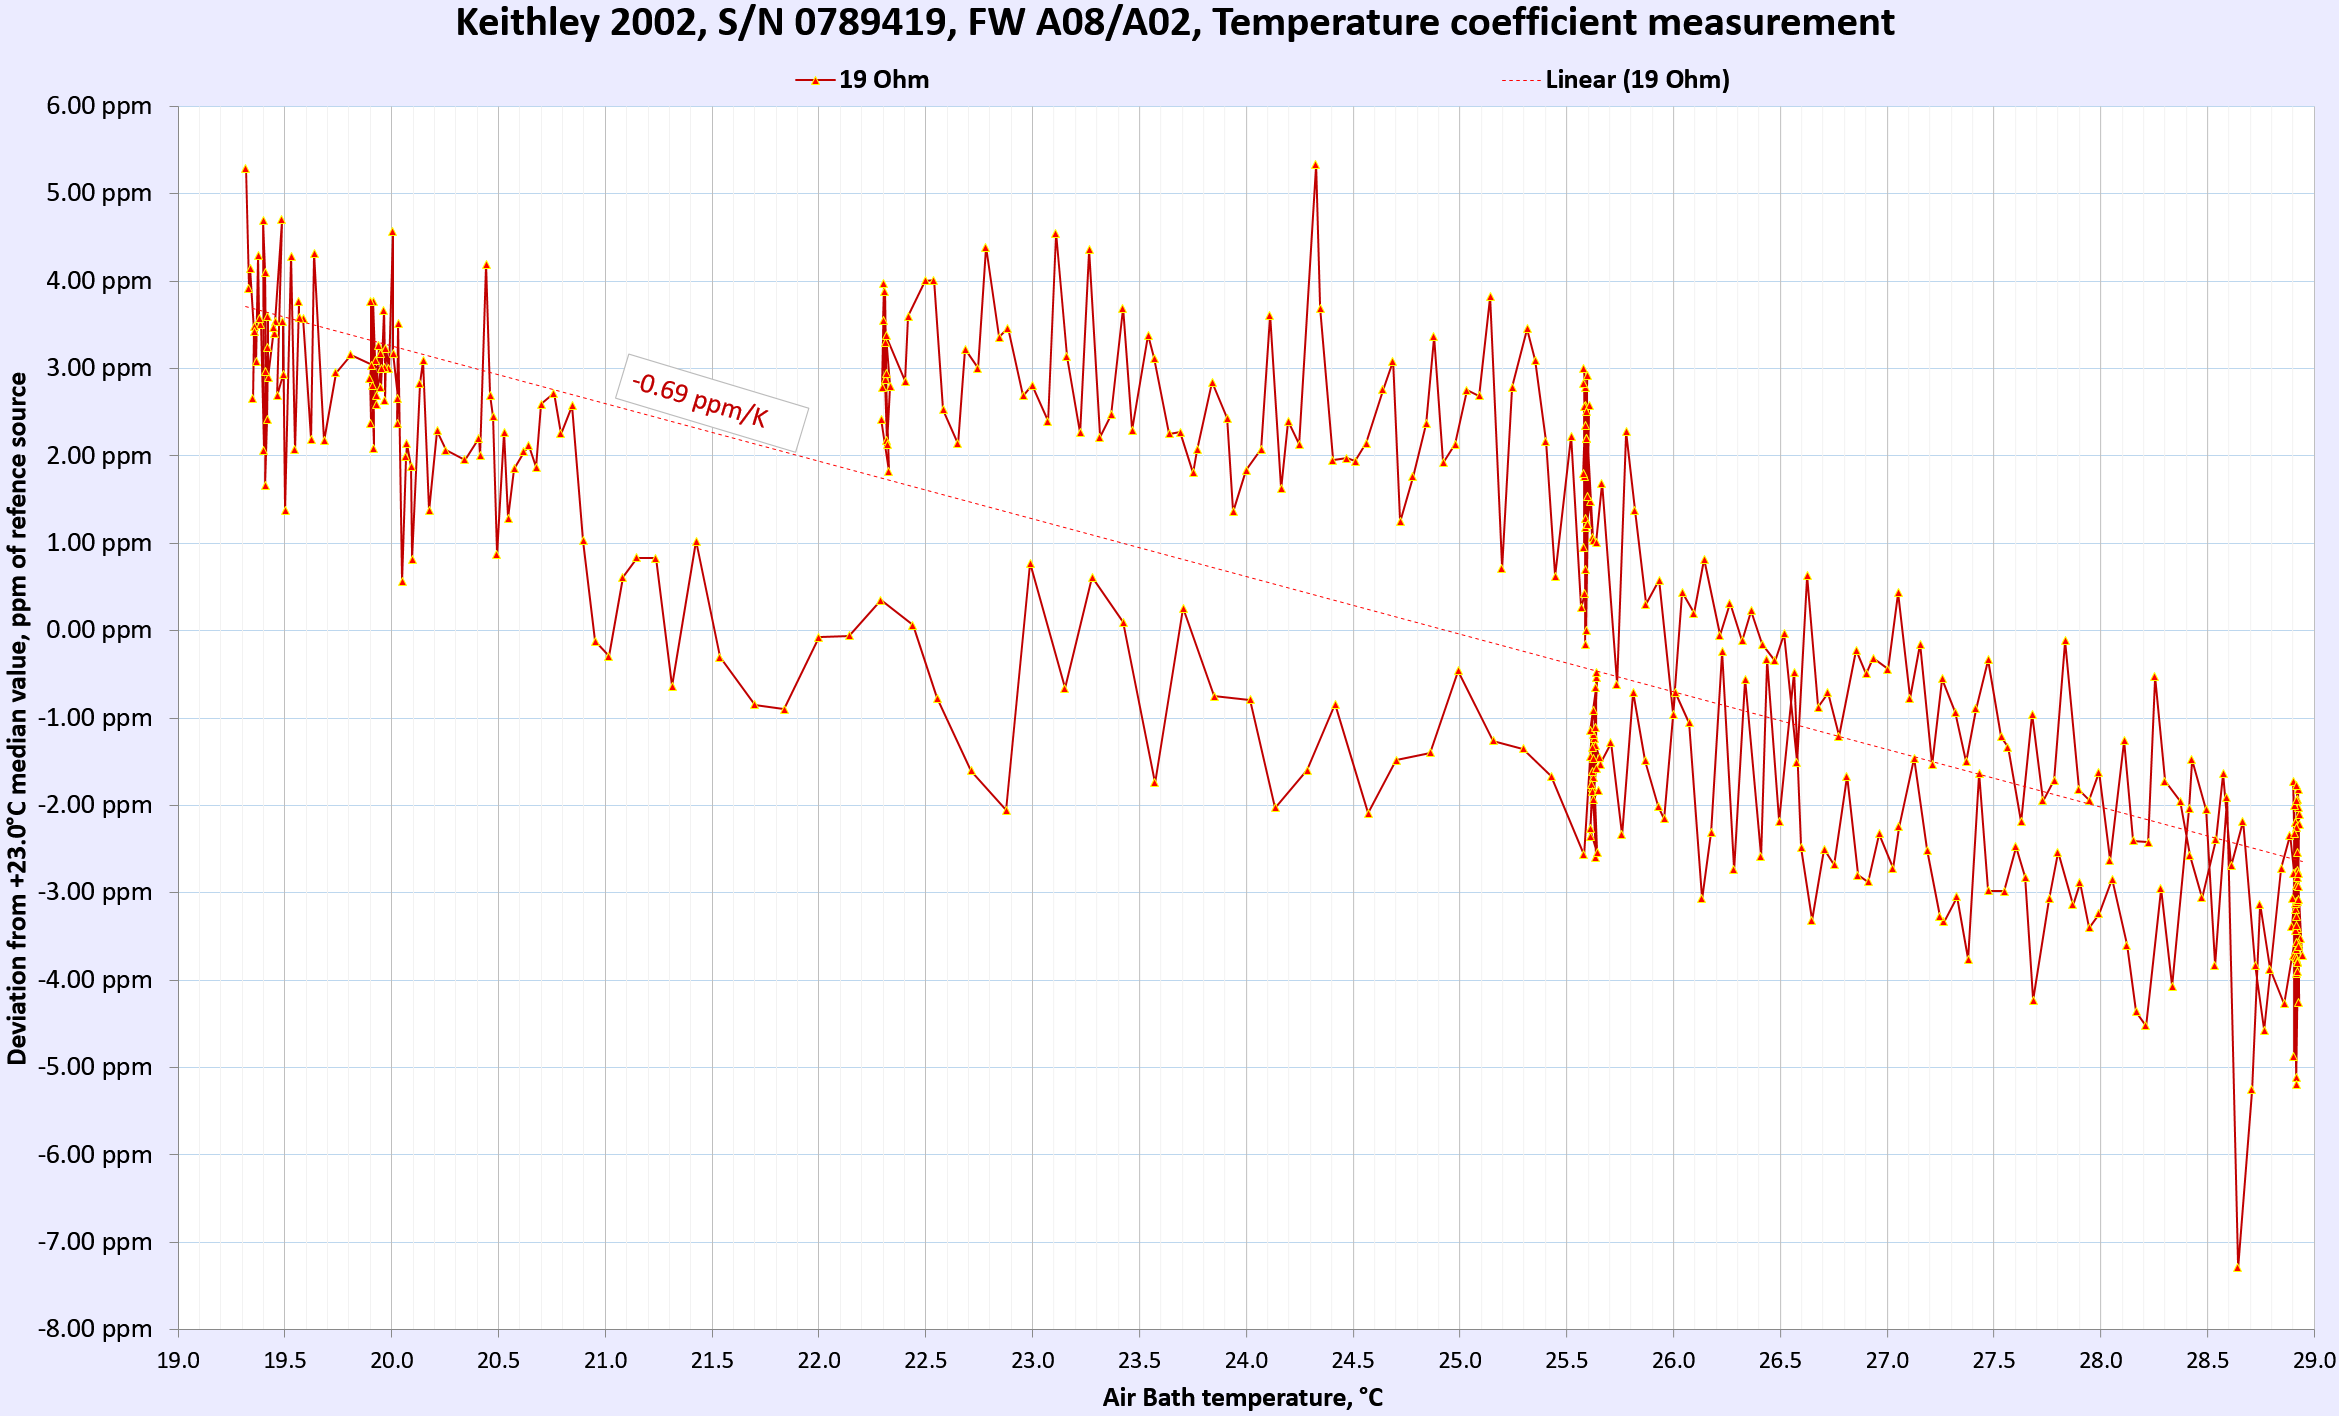 |
| 200 µA DC | 100 µADC, 190 µADC | ±50 ppm of rdg + ±5 ppm of range / K | -2.5 ppm/K, YES | 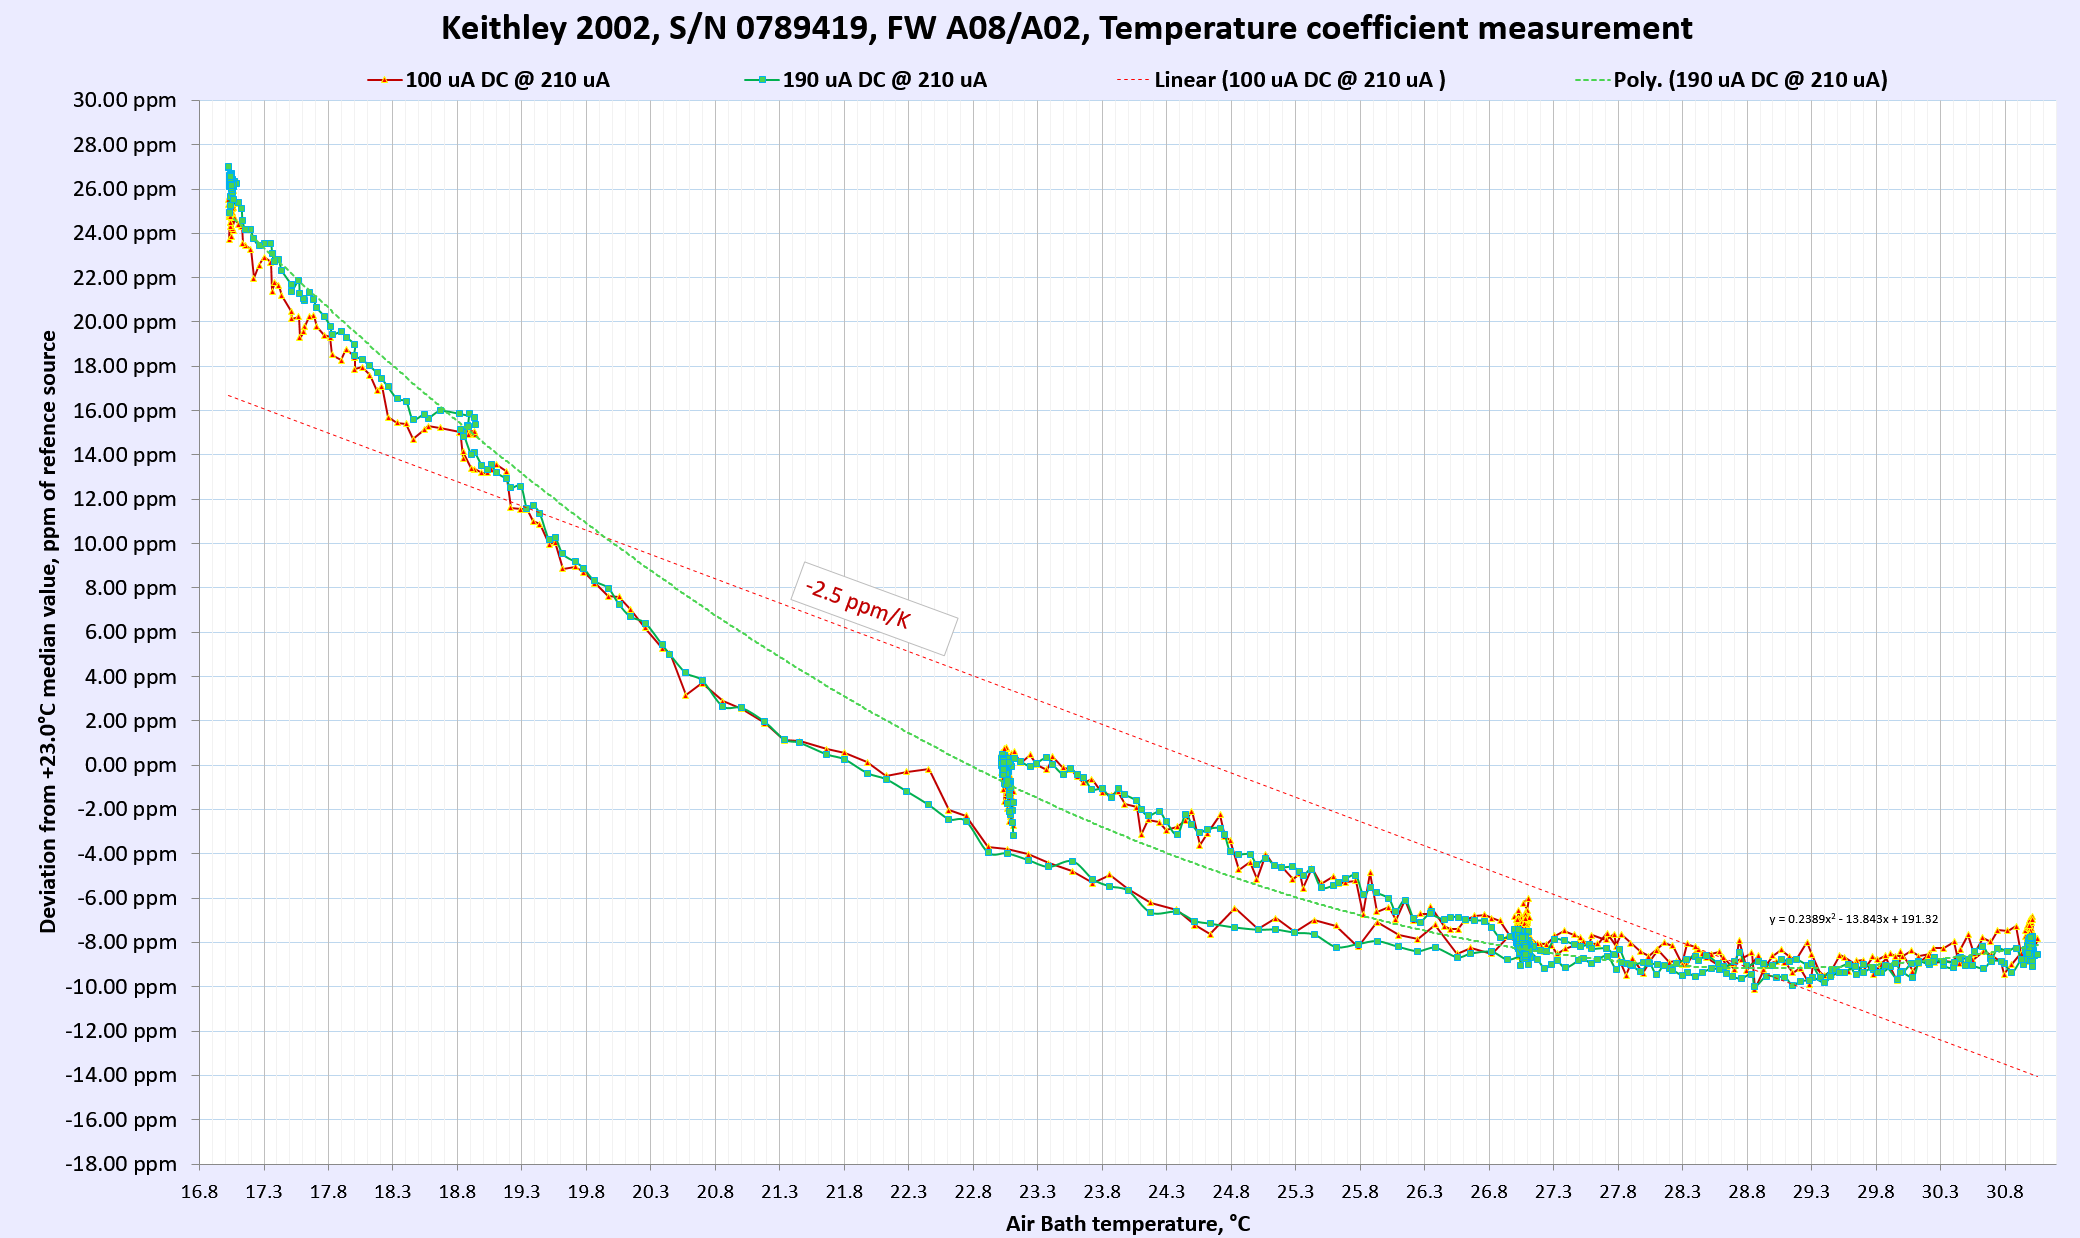 |
| 2 mA DC | 1 mADC, 1.9 mADC | ±50 ppm of rdg + ±5 ppm of range / K | -3.5 ppm/K, YES |  |
| 20 mA DC | 10 mADC, 19 mADC | ±50 ppm of rdg + ±5 ppm of range / K | +8.4 ppm/K, YES |  |
| 200 mA DC | 100 mADC, 190 mADC | ±50 ppm of rdg + ±5 ppm of range / K | +9.8 ppm/K, YES | 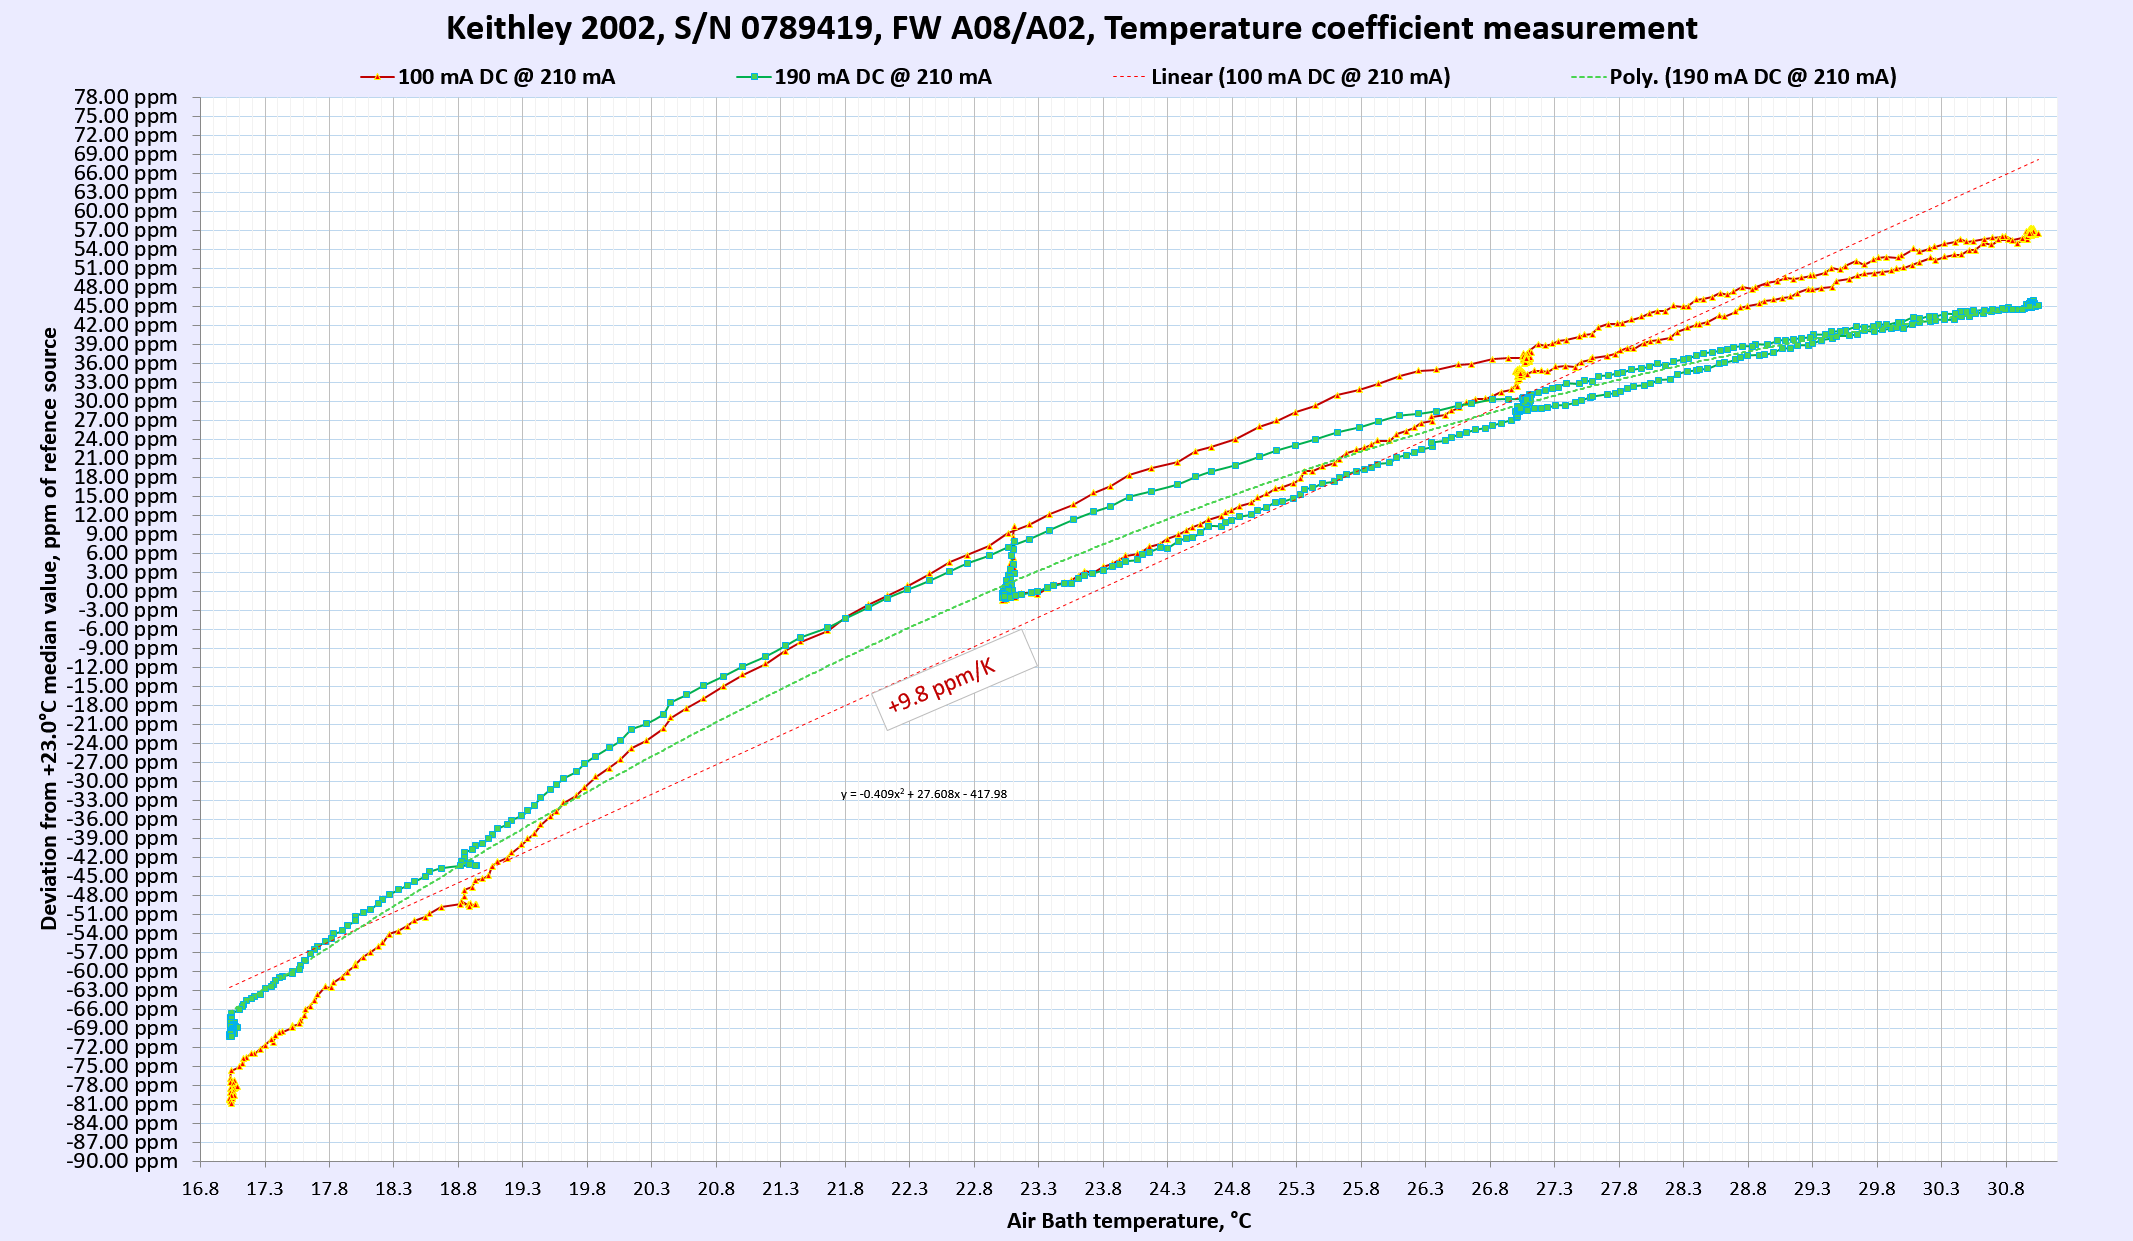 |
Table 9: Temperature stability of Keithley 2002 DMM
AC Voltage and AC current thermal stability and performance were not tested. Overall we can happily report that the meter under test passed and met the manufacturer’s specification for temperature stability at tested ranges and points.
Keithley 2002 calibration results as returned, January 15, 2023
List of verification and reference equipment used related to this calibration and adjustment is shown in table below. It is essentially the same equipment as used earlier in November 2022, but with fresh verification.
| Type | Manufacturer | Model P/N | Options/value | Serial number | CEID | Calibration date | Due date |
|---|---|---|---|---|---|---|---|
| DCC | MIL | 6010B | XRI | XRB1 | 01/07/2023 | 04/07/2023 | |
| BVD | MIL | 6000A | XRI | XRB2 | 05/05/2022 | 05/05/2023 | |
| MFC | Fluke | 5720A | 03/HLK | 7530212 | XHC1 | 01/10/2023 | 07/10/2023 |
| Amplifier | Fluke | 5725A | 5930005 | XHB1 | 01/10/2023 | 08/07/2023 | |
| DC STD | xDevs.com | 792×[2] | 9.99997622 VDC | ±0.3 ppm | XD01 | 11/12/2022 | 11/12/2023 |
| STDR | ESI | SR104 | 10000.0013 KΩ | ±0.2 ppm | G202088930104 | 10/26/2021 | 10/26/2023 |
| STDR | OhmLabs | 109 | 1.000037 GΩ | ±20 ppm | MR05 | 06/05/2022 | 06/05/2023 |
| DMM | HP | 3458A | 001,X02 | MY45040325 | XD2 | 10/25/2022 | 05/25/2023 |
| DMM | HP | 3458A | 001,X02 | XRI | XD3 | 01/06/2023 | 07/06/2023 |
| Divider | Fluke | 752A | 4295200 | XR01 | 01/09/2023 | 01/10/2023 |
Table 10: Reference standards used for as returned calibration and adjustment
Some traceable accredited certificates for used standards also available on links below.
xDevs.com 792× 10V DC Reference against Fluke 732B, USA Technical Maintenance Inc, March 3, 2020
xDevs.com 792× 10V DC Reference against NIST PJVS, Taiwan NML CMS ITRI, August 8, 2019
Fluke SL935 1 Ω and 10 KΩ USA Process Insturments, 28 November 2017
Fluke SL935 1 Ω and 10 KΩ USA Process Insturments, 31 May 2018
Fluke SL935 1 Ω and 10 KΩ Taiwan NML CMS ITRI, 12 August 2019
ESI SR104 10 KΩ USA Process Insturments, 17 March 2020
Calibrator was extensively tested prior to adjustment of Keithley 2002. This was a large project on it’s own and will be highlighted in future articles in better detail. For now just some information about DC Voltage and resistance functions is persented from past data few years back.

Image 9: DC Voltage specifications for Fluke 5720A
Stability and correct operation of 5720A is evaluated periodically, usually with interval less than 30 days between points. This is done automatically with reference 3458A and spot intercomparisons to fixed standards.

Image 10: Stability of Fluke 5720A DC Voltage function, against 24 hour k=2 spec
At first glance graph does not look so good, but actually it is very impressive. Vertical axis show percentage of the tight 24 hour 95% Fluke 5720A specification. To determine absolute shift one you need multiply published absolute accuracy specification to percent value from the plot. For example base range 11V maximum deviation math shown below.
U11VDC = 2.75 ppm * 50% = 1.375 ppm.
Even worst range, which is passively divided 220mV offers stability better than 4.5 ppm over term more than a year, thanks to proper support with external standards and good calibrator care. In fact this confirms the widely known experience from calibration labs and previous publications, showing these instruments rather conservatively specified and offering much better performance. Especially with help of modern metrology software and historical statistic analysis and some scripting.

Image 11: Resistance output specifications for Fluke 5720A
Next test is resistance stability for every resistance output available from Fluke 5720A.

Image 12: Stability of Fluke 5720A resistance function, against 24 hour k=2 spec
Worst change was detected on August 17, 2019 for 1900 Ω resistance output, due to fresh ACAL adjustment to Fluke SL935 10000 Ω output, externally calibrated by National Taiwan Lab CMS ITRI on August 12, 2019. This change was equal -3.28 ppm. Calibrator’s 10 kΩ output change on same date was much smaller at -2.08 ppm.
All resistance outputs from 1 Ω to 100 MΩ were verified with chain of calibrations with fixed resistance references with help of MIL 6010B and 6000A systems.
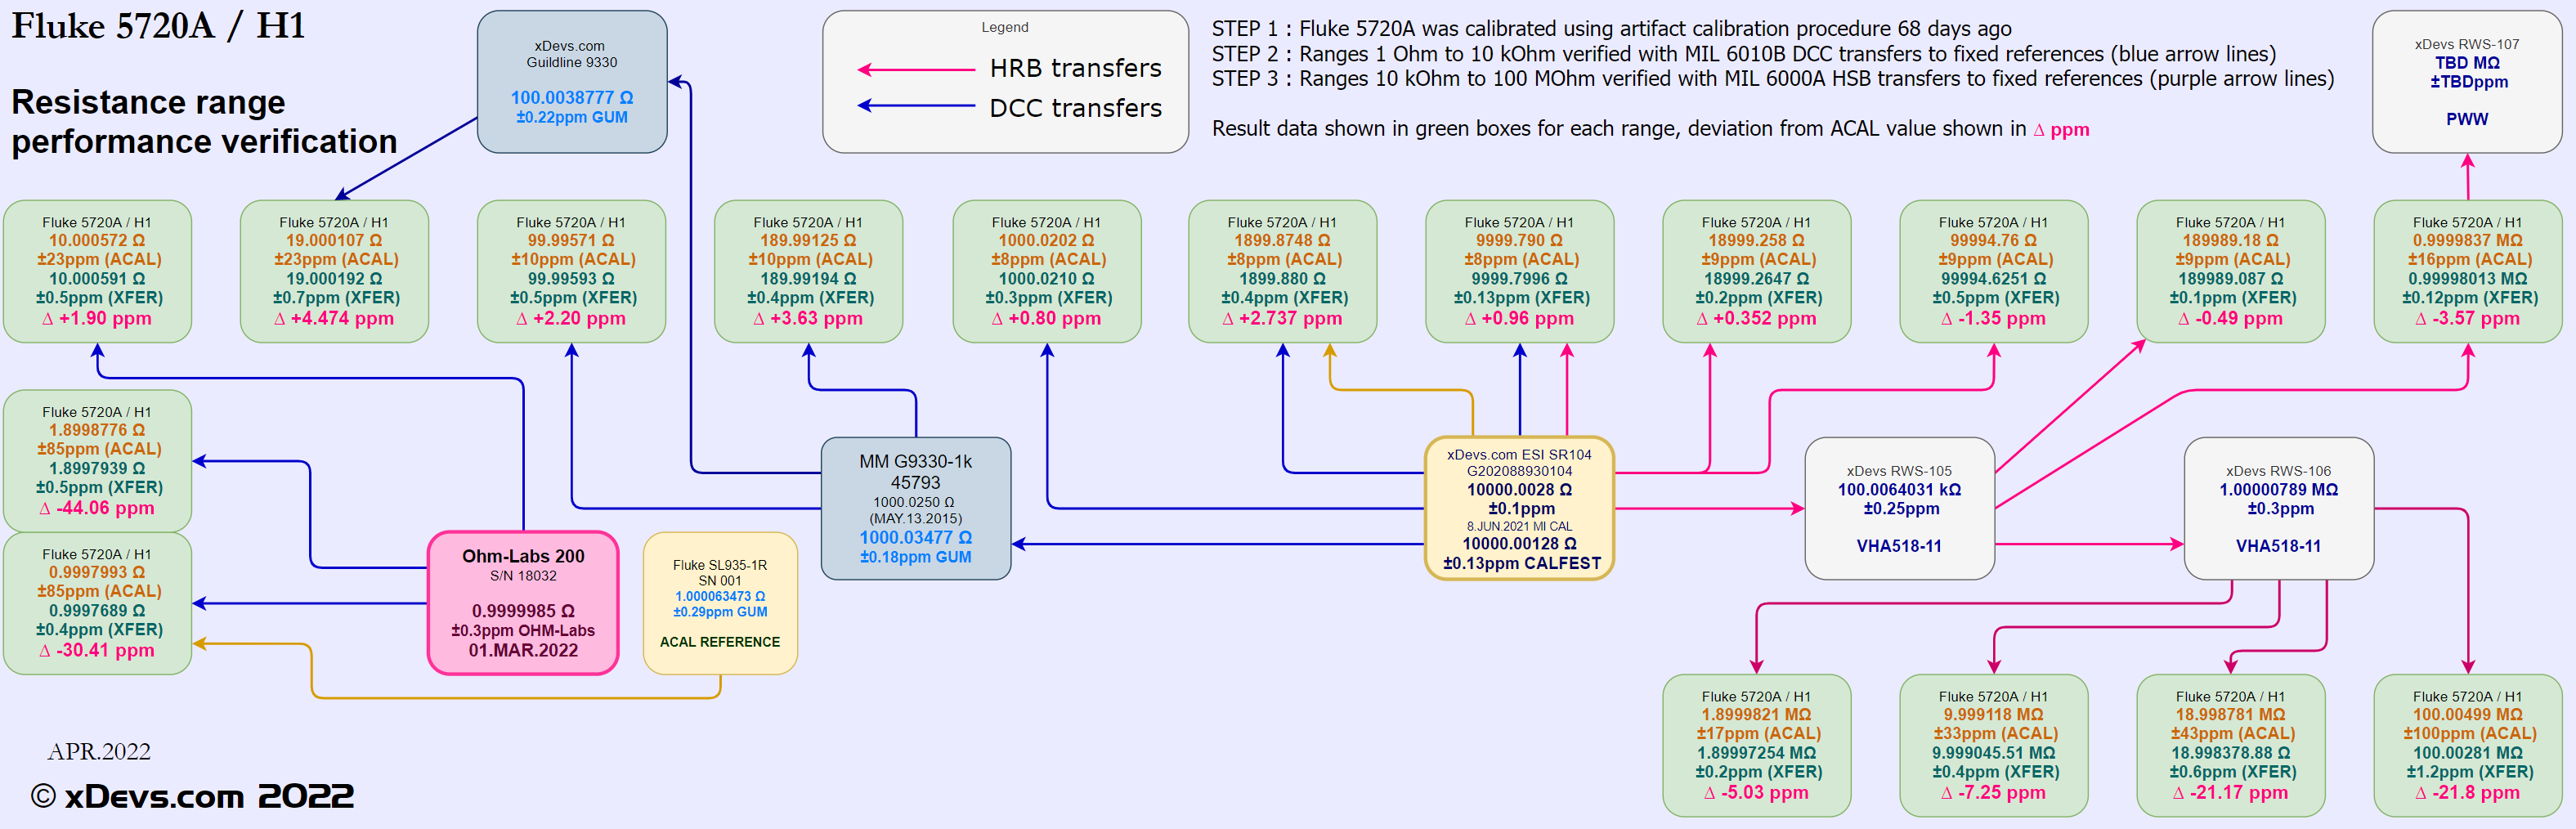
Image 13: Previous verification map for all 5720A resistance points, April 2022
Both user level and factory low-level adjustment procedures were performed on this Keithley 2002 due to previous history of repairs and long overdue original adjustment period. Calibration adjustment procedures were performed using the same calibrator with remote GPIB control to both instruments. Low level adjustment procedure can be only done with GPIB remote control, while user level comprehensive calibration adjustment can be performed by an operator from the front panel.
| Keithley 2002 User Level Adjustment steps | RDr1: +1.8999129E+02,OHM,0.0000E+00 | Keithley 2002 Low Level Adjustment steps | HWR7: *ESE 1 |
|---|---|---|---|
| WR7: :CAL:PROT:INIT | HWR1: OPER | HWR7: *ESE 1 | HWR1: EXTSENSE OFF |
| HWR7: *ESE 1 | HWR7: :CAL:PROT:DC:OHM200 1.8999129e+02;*OPC | HWR1: EXTSENSE OFF | HWR1: OUT 100.000 V, 0 Hz;*CLS;OPER |
| HWR7: *CLS | RDr7: 0,“No error” | HWR1: OUT 20 V, 1 kHz;*CLS;OPER | HWR1: OPER |
| HWR7: :CAL:PROT:DC:ZERO;*OPC | HWR7: *ESE 1 | HWR1: OPER | HWR7: :CAL:PROT:LLEV:STEP 9;*OPC |
| RDr7: 0,“No error” | HWR1: OUT 1.900000e+01 OHM;*CLS;OPER | HWR7: :CAL:PROT:LLEV:STEP 1;*OPC | RDr7: 0,“No error” |
| HWR1: EXTSENSE OFF | HWR1: EXTSENSE ON | RDr7: 0,“No error” | HWR7: *ESE 1 |
| HWR1: OUT 2.00000000e+00 V;*CLS;OPER | RDr1: +1.9000177E+01,OHM,0.0000E+00 | HWR7: *ESE 1 | HWR1: EXTSENSE OFF |
| HWR1: OPER | HWR7: :CAL:PROT:DC:OHM20 1.9000177e+01;*OPC | HWR1: EXTSENSE OFF | HWR1: OUT -20.00000 V, 0 Hz;*CLS;OPER |
| HWR7: :CAL:PROT:DC:V2 2.00000000;*OPC | RDr7: 0,“No error” | HWR1: OUT 20.0000 V, 30 kHz;*CLS;OPER | HWR1: OPER |
| RDr7: 0,“No error” | HWR1: CUR_POST AUX | HWR1: OPER | HWR7: :CAL:PROT:LLEV:STEP 10;*OPC |
| HWR7: *ESE 1 | HWR7: *ESE 1 | HWR7: :CAL:PROT:LLEV:STEP 2;*OPC | RDr7: 0,“No error” |
| HWR1: OUT 2.000000e+01 V;*CLS;OPER | HWR1: EXTSENSE OFF | RDr7: 0,“No error” | HWR1: STBY |
| HWR1: OPER | HWR1: OUT 2.000000e-04 A;*CLS;OPER | HWR7: *ESE 1 | HWR7: *ESE 1 |
| HWR7: :CAL:PROT:DC:V20 20.000000000;*OPC | HWR1: OPER | HWR1: EXTSENSE OFF | HWR1: EXTSENSE ON |
| RDr7: 0,“No error” | HWR7: :CAL:PROT:DC:A200U 200E-6;*OPC | HWR1: OUT 200 V, 1 kHz;*CLS;OPER | HWR1: OUT 0 Ohm, 0 Hz;*CLS;OPER |
| HWR1: OUT 0 V;*CLS;OPER | RDr7: 0,“No error” | HWR1: OPER | HWR1: OPER |
| HWR1: STBY | HWR1: CUR_POST AUX | HWR7: :CAL:PROT:LLEV:STEP 3;*OPC | HWR7: :CAL:PROT:LLEV:STEP 11;*OPC |
| HWR7: *ESE 1 | HWR7: *ESE 1 | RDr7: 0,“No error” | RDr7: 0,“No error” |
| HWR1: OUT 1.000000e+06 OHM;*CLS;OPER | HWR1: EXTSENSE OFF | HWR7: *ESE 1 | HWR7: *ESE 1 |
| HWR1: EXTSENSE ON | HWR1: OUT 2.000000e-03 A;*CLS;OPER | HWR1: EXTSENSE OFF | HWR1: EXTSENSE OFF |
| RDr1: +9.9998240E+05,OHM,0.0000E+00 | HWR7: :CAL:PROT:DC:A2M 2E-3;*OPC | HWR1: OUT 200.000 V, 30 kHz;*CLS;OPER | HWR1: OUT 20.00000 mA, 1 kHz;*CLS;OPER |
| HWR1: OPER | RDr7: 0,“No error” | HWR1: OPER | HWR1: OPER |
| HWR7: :CAL:PROT:DC:OHM1M 9.9998240e+05;*OPC | HWR1: CUR_POST AUX | HWR7: :CAL:PROT:LLEV:STEP 4;*OPC | HWR7: :CAL:PROT:LLEV:STEP 12;*OPC |
| RDr7: 0,“No error” | HWR7: *ESE 1 | RDr7: 0,“No error” | RDr7: 0,“No error” |
| HWR7: *ESE 1 | HWR1: EXTSENSE OFF | HWR7: *ESE 1 | |
| HWR1: OUT 1.900000e+05 OHM;*CLS;OPER | HWR1: OUT 2.000000e-02 A;*CLS;OPER | HWR1: EXTSENSE OFF | 2VRMS 1 Hz source is connected to meter |
| HWR1: EXTSENSE ON | HWR7: :CAL:PROT:DC:A20M 20E-3;*OPC | HWR1: OUT 1.5000000 V, 1 kHz;*CLS;OPER | Keysight 33522B used as a source here. |
| RDr1: +1.8998915E+05,OHM,0.0000E+00 | RDr7: 0,“No error” | HWR1: OPER | |
| HWR1: OPER | HWR1: CUR_POST AUX | HWR7: :CAL:PROT:LLEV:STEP 5;*OPC | HWR7: *ESE 1 |
| HWR7: :CAL:PROT:DC:OHM200K 1.8998915e+05;*OPC | HWR7: *ESE 1 | RDr7: 0,“No error” | HWR7: :CAL:PROT:LLEV:STEP 13;*OPC |
| RDr7: 0,“No error” | HWR1: EXTSENSE OFF | HWR7: *ESE 1 | RDr7: 0,“No error” |
| HWR7: *ESE 1 | HWR1: OUT 2.000000e-01 A;*CLS;OPER | HWR1: EXTSENSE OFF | HWR7: *ESE 1 |
| HWR1: OUT 1.900000e+04 OHM;*CLS;OPER | HWR7: :CAL:PROT:DC:A200M 200E-3;*OPC | HWR1: OUT 200.000 mV, 1 kHz;*CLS;OPER | HWR7: :CAL:PROT:DATE 2023,01,13 |
| HWR1: EXTSENSE ON | RDr7: 0,“No error” | HWR1: OPER | RDr7: 0,“No error” |
| RDr1: +1.8999266E+04,OHM,0.0000E+00 | HWR1: CUR_POST AUX | HWR7: :CAL:PROT:LLEV:STEP 6;*OPC | HWR7: :CAL:PROT:NDUE 2024,01,13 |
| HWR1: OPER | HWR7: *ESE 1 | RDr7: 0,“No error” | RDr7: 0,“No error” |
| HWR7: :CAL:PROT:DC:OHM20K 1.8999266e+04;*OPC | HWR1: EXTSENSE OFF | HWR7: *ESE 1 | HWR7: :CAL:PROT:SAVE |
| RDr7: 0,“No error” | HWR1: OUT 1.000000e+00 A;*CLS;OPER | HWR1: EXTSENSE OFF | HWR7: :CAL:PROT:LOCK;*OPC |
| HWR7: *ESE 1 | HWR1: OPER | HWR1: OUT 5.0000 mV, 100 kHz;*CLS;OPER | ERD7: 0,“No error” |
| HWR1: OUT 1.900000e+03 OHM;*CLS;OPER | HWR7: :CAL:PROT:DC:A2 1;*OPC | HWR1: OPER | |
| HWR1: EXTSENSE ON | RDr7: 0,“No error” | HWR7: :CAL:PROT:LLEV:STEP 7;*OPC |
|
| RDr1: +1.8998719E+03,OHM,0.0000E+00 | HWR1: STBY | RDr7: 0,“No error” | |
| HWR1: OPER | HWR7: *ESE 1 | HWR7: *ESE 1 | |
| HWR7: :CAL:PROT:DC:OHM2K 1.8998719e+03;*OPC | HWR7: :CAL:PROT:DC:OPEN;*OPC | HWR1: EXTSENSE OFF | |
| RDr7: 0,“No error” | RDr7: 0,“No error” | HWR1: OUT 0.500000 mV, 1 kHz;*CLS;OPER | |
| HWR7: *ESE 1 | HWR7: *ESE 1 | HWR1: OPER | |
| HWR1: OUT 1.900000e+02 OHM;*CLS;OPER | HWR7: :CAL:UNPR:ACC;*OPC | HWR7: :CAL:PROT:LLEV:STEP 8;*OPC | |
| HWR1: EXTSENSE ON | RDr7: 0,“No error” | RDr7: 0,“No error” |
Fixed 1 GΩ standard equipped with special BPO silver-plated connectors used for highest resistance range calibration. Unlike more popular resistance standards such as Fluke 742A this unit has a BPO or MUSA connector. BPO connector is male coaxial, often with 75 Ω impedance type, has panel mounting with solder connection pin and metal tag connected to outer tube. The body parts are silver plated brass and center contact is silver plated beryllium copper. This standard was connected to K2002 under test with BPO to BNC cable and BNC to single banana jack adapters. This measurement is challenging and very sensitive to any external interference and noise. It is important to have shielded connections on high resistance ranges.
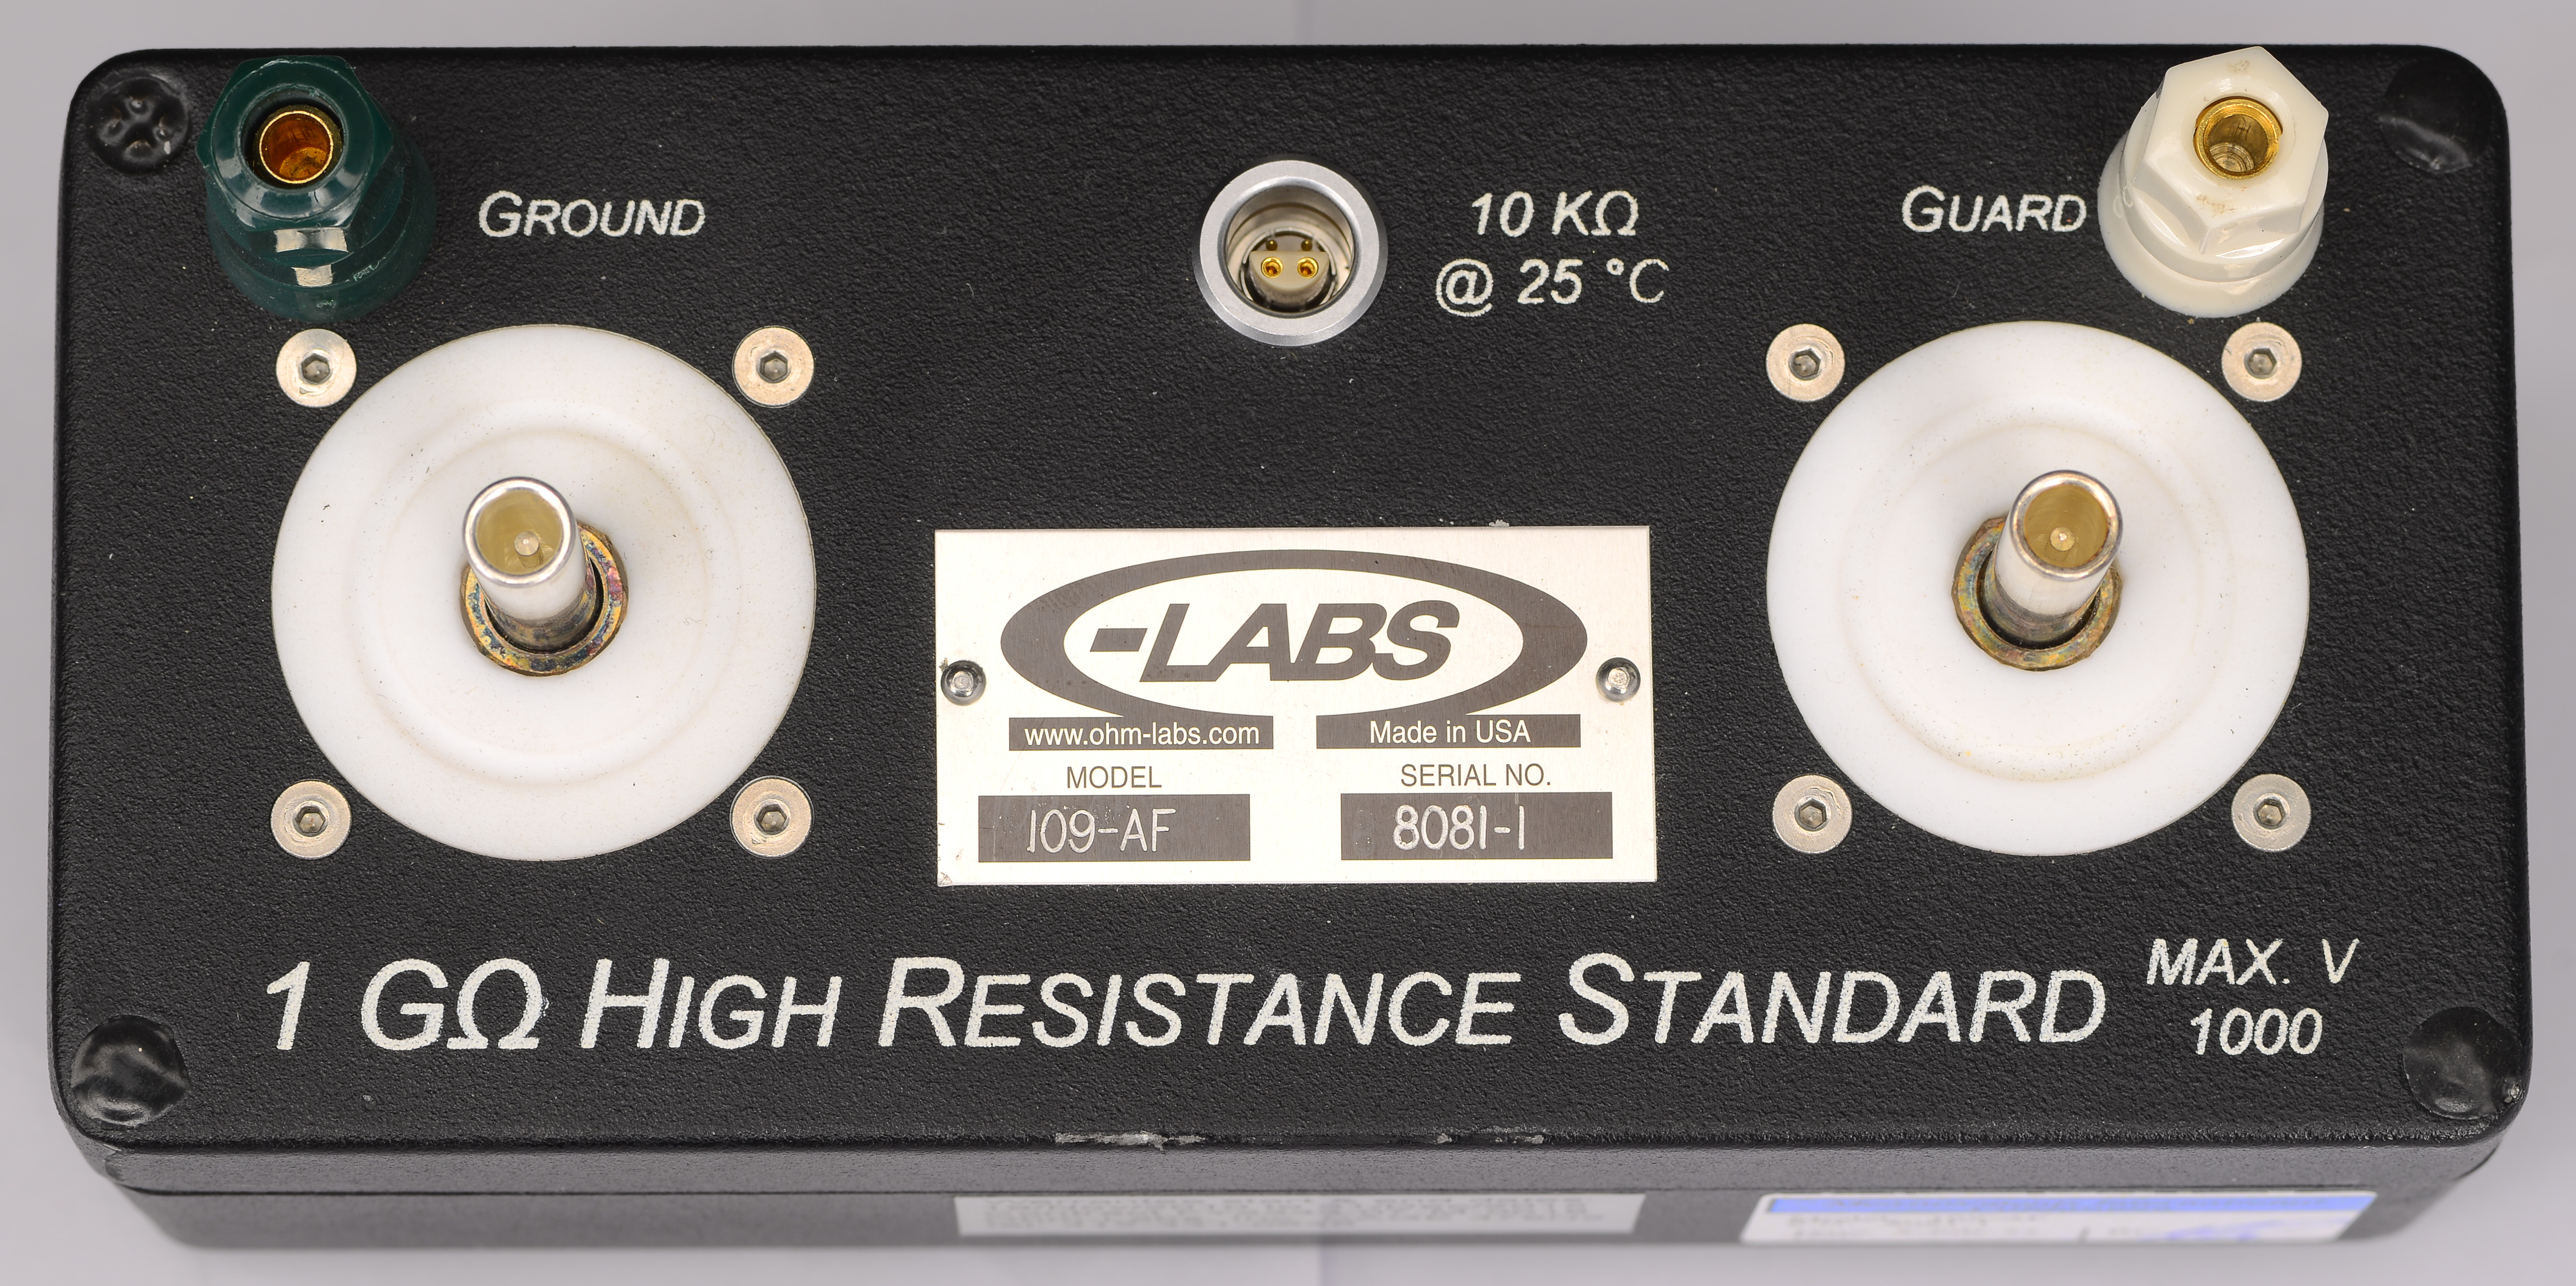
Image 14: High-resistance standard to test 1 GΩ calibration point
Now to the actual calibration results after adjustments. Same procedures and calibration settings with minor bug fixes were used as before in November. Keithley 2002 was adjusted using manufacturer procedures with low-level and comprehensive user level adjustment methods. Fluke 5720A with an attached booster Fluke 5725A was adjusted using standards on January 10, 2023 shortly before the tests began.
| Keithley 2002,0789419,A08/A02, Last adjustment date 13.JAN.2023. Performance verification xDevs.com Rev.2556/2553 15.JAN.2023 | ||||||||
|---|---|---|---|---|---|---|---|---|
| DC zero test procedure for all test points that verify offset of the DCV function. 4-wire copper short at DMM | ||||||||
| Test Description | Zero Value | DUT | Source U | Lower Limit | Upper Limit | Deviation | DUT Spec | Test Status |
| Short 0 mVDC | 0.000 | -0.02 µV | 1.4 µV | -2.6 µV | 2.6 µV | 0.85 % | 1.2 µV | PASS |
| Short 0.0 VDC | 0.000 | -0.08 µV | 1.4 µV | -5.4 µV | 5.4 µV | 1.48 % | 4 µV | PASS |
| Short 00.0 VDC | 0.000 | 0.30 µV | 1.4 µV | -81.4 µV | 81.4 µV | 0.37 % | 80 µV | PASS |
| Short 000.0 VDC | 0.000 | -24 µV | 1.4 µV | -601.4 µV | 601.4 µV | 3.99 % | 0.6 mV | PASS |
| Short 0000.0 VDC | 0.000 | -30 µV | 1.4 µV | -6001.4 µV | 6001.4 µV | 0.50 % | 6 mV | PASS |
Table 11: DC Zero offset performance, as adjusted and returned
Below are Keithley’s specifications for DC Voltage that we verify performance against. Check ranges and interval under calibration is marked in blue.
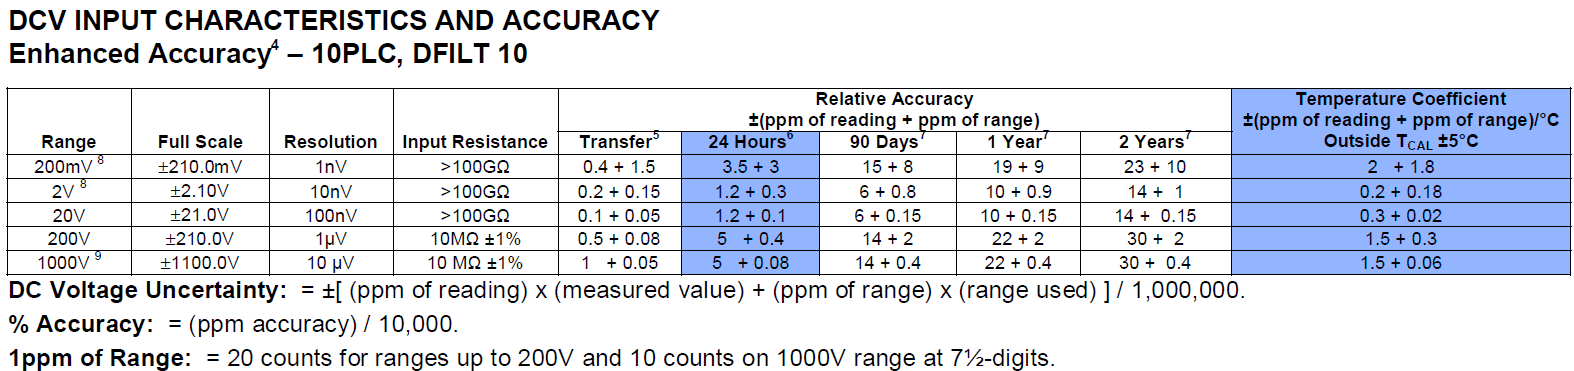
Image 15: Tested DC Voltage specifications marked in blue
Temperature coefficient was tested and confirmed to meet specification, as shown in Table 9 earlier. All ranges zero offset for DC Voltage was well under 5% of expected allowed error, no problems here. Next step is verify gain, per procedure outlined in the calibration manual from the manufacturer.
| Keithley 2002,0789419,A08/A02, Last adjustment date 13.JAN.2023. Performance verification xDevs.com Rev.2556/2553 15.JAN.2023 | ||||||||
|---|---|---|---|---|---|---|---|---|
| DCV Test | 0.1V-1000V | DUT | Source U | Low Limit | Hi limit | Measured | 24h spec | Result |
| 0.02 VDC (0.20 Range) | 0.0200 | 0.020000233 | 22.50 ppm | 0.01999888 | 0.02000112 | 11.7 ppm | 33.5 ppm | PASS 28.87 % |
| 0.1 VDC (0.20 Range) | 0.1000 | 0.10000054 | 6.50 ppm | 0.0999984 | 0.1000016 | 5.4 ppm | 9.5 ppm | PASS 47.35 % |
| 0.2 VDC (0.20 Range) | 0.2000 | 0.20000038 | 4.50 ppm | 0.1999978 | 0.2000022 | 1.9 ppm | 6.5 ppm | PASS 23.91 % |
| -0.02 VDC (0.20 Range) | -0.0200 | -0.020000009 | 22.50 ppm | -0.02000112 | -0.01999888 | 0.4 ppm | 33.5 ppm | PASS 1.12% |
| -0.1 VDC (0.20 Range) | -0.1000 | -0.09999977 | 6.50 ppm | -0.1000016 | -0.0999984 | -2.3 ppm | 9.5 ppm | PASS 19.98 % |
| -0.2 VDC (0.20 Range) | -0.2000 | -0.19999934 | 4.50 ppm | -0.2000022 | -0.1999978 | -3.3 ppm | 6.5 ppm | PASS 42.06 % |
| 0.2 VDC (2.00 Range) | 0.2000 | 0.20000036 | 6.00 ppm | 0.19999796 | 0.20000204 | 1.8 ppm | 4.2 ppm | PASS 24.58 % |
| 1.0 VDC (2.00 Range) | 1.0000 | 0.99999924 | 3.20 ppm | 0.999995 | 1.000005 | -0.8 ppm | 1.8 ppm | PASS 20.70 % |
| 1.9 VDC (2.00 Range) | 1.9000 | 1.8999984 | 2.87 ppm | 1.8999917 | 1.9000083 | -0.9 ppm | 1.5 ppm | PASS 26.43 % |
| 2.0 VDC (2.00 Range) | 2.0000 | 1.9999984 | 2.85 ppm | 1.9999913 | 2.0000087 | -0.8 ppm | 1.5 ppm | PASS 25.07 % |
| -0.2 VDC (2.00 Range) | -0.2000 | -0.20000104 | 6.00 ppm | -0.20000204 | -0.19999796 | 5.2 ppm | 4.2 ppm | PASS 71.00 % |
| -1.0 VDC (2.00 Range) | -1.0000 | -1.0000015 | 3.20 ppm | -1.000005 | -0.999995 | 1.5 ppm | 1.8 ppm | PASS 41.94 % |
| -1.9 VDC (2.00 Range) | -1.9000 | -1.9000023 | 2.87 ppm | -1.9000083 | -1.8999917 | 1.2 ppm | 1.5 ppm | PASS 38.03 % |
| -2.0 VDC (2.00 Range) | -2.0000 | -2.0000024 | 2.85 ppm | -2.0000087 | -1.9999913 | 1.2 ppm | 1.5 ppm | PASS 37.80 % |
| 1.0 VDC (20.00 Range) | 1 | 1.0000031 | 5.50 ppm | 0.9999913 | 1.0000087 | 3.1 ppm | 3.2 ppm | PASS 48.72 % |
| 10.0 VDC (20.00 Range) | 10 | 9.9999987 | 1.90 ppm | 9.999967 | 10.000033 | -0.1 ppm | 1.4 ppm | PASS 5.51 % |
| 19.0 VDC (20.00 Range) | 19 | 18.999994 | 1.71 ppm | 18.999943 | 19.000057 | -0.3 ppm | 1.3 ppm | PASS 15.78 % |
| 20.0 VDC (20.00 Range) | 20 | 19.999996 | 1.70 ppm | 19.99994 | 20.00006 | -0.2 ppm | 1.3 ppm | PASS 9.81 % |
| -1.0 VDC (20.00 Range) | -1 | -1.0000043 | 5.50 ppm | -1.0000087 | -0.9999913 | 4.3 ppm | 3.2 ppm | PASS 67.58 % |
| -10.0 VDC (20.00 Range) | -10 | -10.000008 | 1.90 ppm | -10.000033 | -9.999967 | 0.8 ppm | 1.4 ppm | PASS 32.63 % |
| -19.0 VDC (20.00 Range) | -19 | -19.000007 | 1.71 ppm | -19.000057 | -18.999943 | 0.4 ppm | 1.3 ppm | PASS 17.13 % |
| -20.0 VDC (20.00 Range) | -20 | -20.000005 | 1.70 ppm | -20.00006 | -19.99994 | 0.2 ppm | 1.3 ppm | PASS 11.10 % |
| 10 VDC (200.00 Range) | 10 | 10.000013 | 6.50 ppm | 9.999805 | 10.000195 | 1.3 ppm | 13.0 ppm | PASS 8.94 % |
| 100 VDC (200.00 Range) | 100 | 100.00002 | 2.90 ppm | 99.99913 | 100.00087 | 0.2 ppm | 5.8 ppm | PASS 3.08 % |
| 200 VDC (200.00 Range) | 200 | 199.99983 | 2.70 ppm | 199.99838 | 200.00162 | -0.8 ppm | 5.4 ppm | PASS 13.79 % |
| -10 VDC (200.00 Range) | -10 | -10.000062 | 6.50 ppm | -10.000195 | -9.999805 | 6.2 ppm | 13.0 ppm | PASS 42.31 % |
| -100 VDC (200.00 Range) | -100 | -100.00021 | 2.90 ppm | -100.00087 | -99.99913 | 2.1 ppm | 5.8 ppm | PASS 32.23 % |
| -200 VDC (200.00 Range) | -200 | -200.00024 | 2.70 ppm | -200.00162 | -199.99838 | 1.2 ppm | 5.4 ppm | PASS 19.54 % |
| 100 VDC (1000.00 Range) | 100 | 100.00006 | 7.0 ppm | 99.99872 | 100.00128 | 0.6 ppm | 5.8 ppm | PASS 6.60 % |
| 200 VDC (1000.00 Range) | 200 | 200.00003 | 5.0 ppm | 199.99792 | 200.00208 | 0.15 ppm | 5.4 ppm | PASS 2.04 % |
| 1000 VDC (1000.00 Range) | 1000 | 1000.0061 | 3.4 ppm | 999.98152 | 1000.0185 | 6.13 ppm | 15.1 ppm | PASS 30.19 % |
| -100 VDC (1000.00 Range) | -100 | -100.00047 | 7.0 ppm | -100.00128 | -99.99872 | 4.7 ppm | 5.8 ppm | PASS 51.70 % |
| -200 VDC (1000.00 Range) | -200 | -200.00039 | 5.0 ppm | -200.00208 | -199.99792 | 1.95 ppm | 5.4 ppm | PASS 26.50 % |
| -1000 VDC (1000.00 Range) | -1000 | -1000.0058 | 3.4 ppm | -1000.0185 | -999.98152 | 5.84 ppm | 15.1 ppm | PASS 28.79 % |
Table 12: DC Gain performance, as adjusted and returned
Now all ranges and functions are in solid green after adjustment. Cardinal points at all ranges are well inside 24 hour specs, including points at 5% of range. Key 10V and negative 10V measurement on 20V shows excellent deviation under 1 ppm, compared to Keithley 2002 specification ±1.4 ppm.
Below are Keithley’s specifications for resistance that we verify performance against. Temperature coefficient of 1 GΩ range was not tested. I don’t think that Keithley 2002 is typically used much on this range, since it is typically in the realm of electrometers and special high resistance equipment. Best ranges of 2002 are 2 kΩ and 20 kΩ thanks to high stability Vishay BMF resistors used for those ranges.
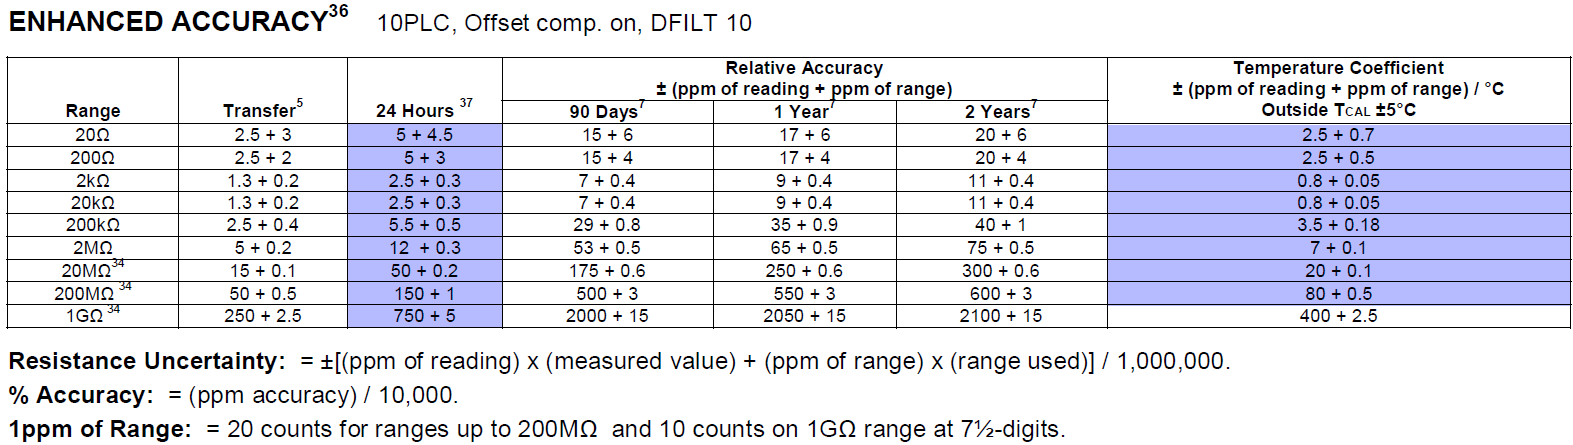
Image 16: Tested Resistance specifications marked in blue
1 GΩ resistance range is verified by using external Ohm-Labs Inc. fixed standard, calibrated by Measurements International at 1.000037 GΩ with uncertainty 9 ppm.
| Keithley 2002,0789419,A08/A02, Last adjustment date 13.JAN.2023. Performance verification xDevs.com Rev.2556/2553 15.JAN.2023 | |||||||
|---|---|---|---|---|---|---|---|
| 4-wire Zero test procedure for all test points that verify Zero offset of the OHMF function. 4-wire kelvin short installed at DMM | |||||||
| 20 Ω Range | 0.0000221 Ω | 0.0000500 Ω | -0.0001435 | 0.0001435 | 15.40 % | 0.0000935 Ω | PASS |
| 200 Ω Range | 0.0000070 Ω | 0.0000500 Ω | -0.00068 | 0.00068 | 1.03 % | 0.0006300 Ω | PASS |
| 2 kΩ Range | -0.0000600 Ω | 0.0000500 Ω | -0.00068 | 0.00068 | 8.82 % | 0.0006300 Ω | PASS |
| 20 kΩ Range | -0.0032000 Ω | 0.0000500 Ω | -0.00635 | 0.00635 | 50.39 % | 0.0063000 Ω | PASS |
| 200 kΩ Range | -0.0026000 Ω | 0.0000500 Ω | -0.10505 | 0.10505 | 2.48 % | 0.1050000 Ω | PASS |
| 2-wire Zero test procedure for all test points that verify Zero offset of the OHMF function. 4-wire kelvin short installed at DMM | |||||||
| OHM ZERO 2W | DUT | Source unc. | Low Limit | Hi limit | Measured | 24h spec | Result |
| 20R Ω Range | 0.303723 Ω | 0.5 Ω | -0.5000935 | 0.5000935 | 60.73 % | 9.35E-05 Ω | PASS |
| 200R Ω Range | 0.300388 Ω | 0.5 Ω | -0.50063 | 0.50063 | 60.00 % | 0.00063 Ω | PASS |
| 2K Ω Range | 0.29802 Ω | 0.5 Ω | -0.50063 | 0.50063 | 59.53 % | 0.00063 Ω | PASS |
| 20K Ω Range | 0.3001 Ω | 0.5 Ω | -0.4063 | 0.4063 | 73.86 % | 0.0063 Ω | PASS |
| 200K Ω Range | 0.34 Ω | 0.5 Ω | -0.905 | 0.905 | 37.57 % | 0.105 Ω | PASS |
| 2M Ω Range | 0.3 Ω | 0.5 Ω | -9.63 | 9.63 | 3.12 % | 0.63 Ω | PASS |
| 20M Ω Range | 0.8 Ω | 0.5 Ω | -94.2 | 94.2 | 0.85 % | 4.2 Ω | PASS |
| 200M Ω Range | 0 Ω | 0.5 Ω | -20210.0 | 20210.0 | 0.00 % | 210 Ω | PASS |
| 1G Ω Range | 0 Ω | 0.5 Ω | -105000 | 105000 | 0.00 % | 5000 Ω | PASS |
Table 13: Resistance zero offset performance, as adjusted and returned
Zero offset for resistance ranges is good, and even 2-wire offset is improved quite noticeably after adjustment. So a solid pass on these points and now ready to move on to a test that had a lot of failures on meter as received.
| Keithley 2002,0789419,A08/A02, Last adjustment date 13.JAN.2023. Performance verification xDevs.com Rev.2556/2553 15.JAN.2023 | ||||||||
|---|---|---|---|---|---|---|---|---|
| 4-wire resistance test procedure for all test points that verify gain of the OHMF function. 4-wire connection MFC to DMM | ||||||||
| 1 Ω OCOMP | 0.9997727 Ω | 0.999792 Ω | 32 ppm | 9.9964571E-01 | 9.9989969E-01 | 19.304 ppm | 95.02 ppm | PASS, 19.25 % of 100.26 ppm |
| 1.9 Ω OCOMP | 1.8997973 Ω | 1.899809 Ω | 25 ppm | 1.8996503E+00 | 1.8999443E+00 | 6.159 ppm | 52.37 ppm | PASS, 10.69 % of 57.61 ppm |
| 10 Ω OCOMP | 10.000602 Ω | 10.0006364 Ω | 5 ppm | 1.0000412E+01 | 1.0000792E+01 | 3.440 ppm | 14.00 ppm | PASS, 23.63 % of 14.56 ppm |
| 19 Ω OCOMP | 19.0001771 Ω | 19.000162 Ω | 4 ppm | 1.8999916E+01 | 1.9000438E+01 | -0.795 ppm | 9.74 ppm | PASS, 7.55 % of 10.53 ppm |
| 100 Ω OCOMP | 99.995756 Ω | 99.99582 Ω | 1.7 ppm | 9.9994486E+01 | 9.9997026E+01 | 0.640 ppm | 11.00 ppm | PASS, 5.75 % of 11.13 ppm |
| 190 Ω OCOMP | 189.991291 Ω | 189.991145 Ω | 1.7 ppm | 1.8998942E+02 | 1.8999316E+02 | -0.768 ppm | 8.16 ppm | PASS, 9.22 % of 8.33 ppm |
| 1.0 kΩ OCOMP | 1000.02101 Ω | 1000.02139 Ω | 1.7 ppm | 1.0000162E+03 | 1.0000258E+03 | 0.380 ppm | 3.10 ppm | PASS, 10.75 % of 3.54 ppm |
| 1.9 kΩ OCOMP | 1899.8719 Ω | 1899.87238 Ω | 1.7 ppm | 1.8998633E+03 | 1.8998805E+03 | 0.253 ppm | 2.82 ppm | PASS, 7.68 % of 3.29 ppm |
| 10 kΩ OCOMP | 9999.8 Ω | 9999.8045 Ω | 1.6 ppm | 9.9997530E+03 | 9.9998470E+03 | 0.450 ppm | 3.10 ppm | PASS, 12.90 % of 3.49 ppm |
| 19 kΩ OCOMP | 18999.2663 Ω | 18999.2794 Ω | 1.7 ppm | 1.8999181E+04 | 1.8999352E+04 | 0.690 ppm | 2.82 ppm | PASS, 20.96 % of 3.29 ppm |
| 100 kΩ | 99994.752 Ω | 99994.888 Ω | 2 ppm | 9.9993902E+04 | 9.9995602E+04 | 1.360 ppm | 6.50 ppm | PASS, 20.00 % of 6.80 ppm |
| 190 kΩ | 189989.15 Ω | 189989.348 Ω | 2 ppm | 1.8998763E+05 | 1.8999067E+05 | 1.042 ppm | 6.03 ppm | PASS, 16.41 % of 6.35 ppm |
| 1.0 MΩ | 999982.4 Ω | 999984.59 Ω | 2.5 ppm | 9.9996730E+05 | 9.9999750E+05 | 2.190 ppm | 12.60 ppm | PASS, 17.05 % of 12.85 ppm |
| 1.9 MΩ | 1899978.3 Ω | 1899977.94 Ω | 3 ppm | 1.8999492E+06 | 1.9000074E+06 | -0.189 ppm | 12.32 ppm | PASS, 1.52 % of 12.48 ppm |
| 10 MΩ 2W | 9999094 Ω | 9999074 Ω | 10 ppm | 9.9984901E+06 | 9.9996979E+06 | -2.000 ppm | 50.40 ppm | PASS, 3.89 % of 51.38 ppm |
| 19 MΩ 2W | 18998711 Ω | 18998530.8 Ω | 20 ppm | 1.8997377E+07 | 1.9000045E+07 | -9.485 ppm | 50.21 ppm | PASS, 17.55 % of 54.05 ppm |
| 100 MΩ 2W | 100005110 Ω | 100003046 Ω | 50 ppm | 9.9984909E+07 | 1.0002531E+08 | -20.644 ppm | 152.00 ppm | PASS, 12.90 % of 160.01 ppm |
| 1 GΩ 2W | 1.000037 GΩ | 1.000105 GΩ | 20 ppm | 0.999262 G | 1.000812 G | 68.487 ppm | 755 ppm | PASS, 9.07 % of 755.26 ppm |
Table 14: Resistance gain performance, as adjusted and returned
All is green now in the resistance realm. Worst deviation is on the 20 Ω range at point 50% of the scale (10 Ω resistance). All measurements from 100 Ω to 2 MΩ now fall to less than 2.2 ppm deviation from the well-known standard. Next are AC voltage tests. Below are Keithley’s specifications for AC Voltage that we verify performance against.

Image 17: Tested AC Voltage specifications marked in blue
Frequency bands above 20 kHz for high voltage range (700V points) were not tested. We have ability to source those points, however Model 2002 has 2 * 107 V × Hz limit beyond which damage to the instrument is possible. Same reason to limit frequency to below 100 kHz on 200 V point. Calibrator is unable to source frequencies higher than 1.1999 MHz so points above 1 MHz weren’t tested at lower ranges either.
| Keithley 2002,0789419,A08/A02, Last adjustment date 13.JAN.2023. Performance verification xDevs.com Rev.2556/2553 15.JAN.2023 | ||||||||
|---|---|---|---|---|---|---|---|---|
| Procedure for all test points that verify Gain & flatness of the AC Voltage. 2-wire connection at LO and ACV is used between DMM and MFC | ||||||||
| 20 mV AC+DC @ 10 Hz | 0.02004476 | 0.0400 % | 0.019819 | 0.020181 | 0.2238 % | 0.8650 % | PASS 25.85 % | |
| 20 mV AC+DC @ 20 Hz | 0.02004002 | 0.0280 % | 0.019821 | 0.020179 | 0.2001 % | 0.8650 % | PASS 23.12 % | |
| 20 mV AC+DC @ 50 Hz | 0.02003541 | 0.0270 % | 0.019822 | 0.020178 | 0.1771 % | 0.8650 % | PASS 20.46 % | |
| 20 mV AC+DC @ 60 Hz | 0.02003707 | 0.0270 % | 0.019822 | 0.020178 | 0.1854 % | 0.8650 % | PASS 21.42 % | |
| 20 mV AC+DC @ 100 Hz | 0.02003088 | 0.0270 % | 0.019822 | 0.020178 | 0.1544 % | 0.8650 % | PASS 17.84 % | |
| 20 mV AC+DC @ 1.0 kHz | 0.02003368 | 0.0270 % | 0.019822 | 0.020178 | 0.1684 % | 0.8650 % | PASS 19.46 % | |
| 20 mV AC+DC @ 6.25 kHz | 0.02002735 | 0.0270 % | 0.019822 | 0.020178 | 0.1368 % | 0.8650 % | PASS 15.80 % | |
| 20 mV AC+DC @ 10.0 kHz | 0.02003951 | 0.0270 % | 0.019822 | 0.020178 | 0.1976 % | 0.8650 % | PASS 22.83 % | |
| 20 mV AC+DC @ 20.0 kHz | 0.02003491 | 0.0270 % | 0.019822 | 0.020178 | 0.1746 % | 0.8650 % | PASS 20.17 % | |
| 20 mV AC+DC @ 50.0 kHz | 0.02004034 | 0.0370 % | 0.019820 | 0.020180 | 0.2017 % | 0.8650 % | PASS 23.30 % | |
| 20 mV AC+DC @ 100.0 kHz | 0.020029145 | 0.0650 % | 0.019854 | 0.020146 | 0.1457 % | 0.6650 % | PASS 21.81 % | |
| 20 mV AC+DC @ 200.0 kHz | 0.02000164 | 0.0800 % | 0.019671 | 0.020329 | 0.0082 % | 1.5650 % | PASS 0.52 % | |
| 20 mV AC+DC @ 300.0 kHz | 0.02001306 | 0.0800 % | 0.019671 | 0.020329 | 0.0653 % | 1.5650 % | PASS 4.17 % | |
| 20 mV AC+DC @ 500.0 kHz | 0.020114365 | 0.2100 % | 0.019078 | 0.020922 | 0.5718 % | 4.4000 % | PASS 12.98 % | |
| 20 mV AC+DC @ 1.0 MHz | 0.020671945 | 0.6500 % | 0.018990 | 0.021010 | 3.3597 % | 4.4000 % | PASS 75.54 % | |
| 200 mV AC+DC @ 10 Hz | 0.19996818 | 0.0260 % | 0.199418 | 0.200582 | -0.0159 % | 0.2650 % | PASS 5.97 % | |
| 200 mV AC+DC @ 20 Hz | 0.19997246 | 0.0115 % | 0.199447 | 0.200553 | -0.0138 % | 0.2650 % | PASS 5.19 % | |
| 200 mV AC+DC @ 50 Hz | 0.19998128 | 0.0105 % | 0.199899 | 0.200101 | -0.0094 % | 0.0400 % | PASS 22.65 % | |
| 200 mV AC+DC @ 60 Hz | 0.19998247 | 0.0105 % | 0.199899 | 0.200101 | -0.0088 % | 0.0400 % | PASS 21.21 % | |
| 200 mV AC+DC @ 100 Hz | 0.19999109 | 0.0105 % | 0.199899 | 0.200101 | -0.0045 % | 0.0400 % | PASS 10.78 % | |
| 200 mV AC+DC @ 1.0 kHz | 0.20000692 | 0.0105 % | 0.199899 | 0.200101 | 0.0035 % | 0.0400 % | PASS 8.37 % | |
| 200 mV AC+DC @ 6.25 kHz | 0.20001299 | 0.0105 % | 0.199889 | 0.200111 | 0.0065 % | 0.0450 % | PASS 14.07 % | |
| 200 mV AC+DC @ 10.0 kHz | 0.20001476 | 0.0105 % | 0.199889 | 0.200111 | 0.0074 % | 0.0450 % | PASS 15.98 % | |
| 200 mV AC+DC @ 20.0 kHz | 0.20001296 | 0.0105 % | 0.199889 | 0.200111 | 0.0065 % | 0.0450 % | PASS 14.04 % | |
| 200 mV AC+DC @ 50.0 kHz | 0.19997056 | 0.0205 % | 0.199819 | 0.200181 | -0.0147 % | 0.0700 % | PASS 20.19 % | |
| 200 mV AC+DC @ 100.0 kHz | 0.19974617 | 0.0485 % | 0.199273 | 0.200727 | -0.1269 % | 0.3150 % | PASS 39.82 % | |
| 200 mV AC+DC @ 200.0 kHz | 0.19919302 | 0.0800 % | 0.195790 | 0.204210 | -0.4035 % | 2.0250 % | PASS 19.91 % | |
| 200 mV AC+DC @ 300.0 kHz | 0.19893440 | 0.0800 % | 0.195790 | 0.204210 | -0.5328 % | 2.0250 % | PASS 26.29 % | |
| 200 mV AC+DC @ 500.0 kHz | 0.19905747 | 0.1200 % | 0.195360 | 0.204640 | -0.4713 % | 2.2000 % | PASS 21.39 % | |
| 200 mV AC+DC @ 1.0 MHz | 0.20077622 | 0.2600 % | 0.195080 | 0.204920 | 0.3881 % | 2.2000 % | PASS 17.52 % | |
| 2.0 V AC+DC @ 10 Hz | 2.0002508 | 0.0220 % | 1.994260 | 2.005740 | 0.0125 % | 0.2650 % | PASS 4.71 % | |
| 2.0 V AC+DC @ 20 Hz | 2.0002788 | 0.0083 % | 1.994535 | 2.005465 | 0.0139 % | 0.2650 % | PASS 5.26 % | |
| 2.0 V AC+DC @ 50 Hz | 2.0003154 | 0.0041 % | 1.999118 | 2.000882 | 0.0158 % | 0.0400 % | PASS 39.23 % | |
| 2.0 V AC+DC @ 60 Hz | 2.0003172 | 0.0041 % | 1.999118 | 2.000882 | 0.0159 % | 0.0400 % | PASS 39.45 % | |
| 2.0 V AC+DC @ 100 Hz | 2.0003059 | 0.0041 % | 1.999118 | 2.000882 | 0.0153 % | 0.0400 % | PASS 38.04 % | |
| 2.0 V AC+DC @ 1.0 kHz | 2.0001765 | 0.0041 % | 1.999118 | 2.000882 | 0.0088 % | 0.0400 % | PASS 21.95 % | |
| 2.0 V AC+DC @ 6.25 kHz | 2.0003130 | 0.0041 % | 1.999018 | 2.000982 | 0.0157 % | 0.0450 % | PASS 34.64 % | |
| 2.0 V AC+DC @ 10.0 kHz | 2.0003263 | 0.0041 % | 1.999018 | 2.000982 | 0.0163 % | 0.0450 % | PASS 36.12 % | |
| 2.0 V AC+DC @ 20.0 kHz | 2.0002962 | 0.0041 % | 1.999018 | 2.000982 | 0.0148 % | 0.0450 % | PASS 32.78 % | |
| 2.0 V AC+DC @ 50.0 kHz | 1.9996814 | 0.0070 % | 1.998460 | 2.001540 | -0.0159 % | 0.0700 % | PASS 22.64 % | |
| 2.0 V AC+DC @ 100.0 kHz | 1.9973228 | 0.0115 % | 1.993470 | 2.006530 | -0.1339 % | 0.3150 % | PASS 42.47 % | |
| 2.0 V AC+DC @ 200.0 kHz | 1.9917263 | 0.0340 % | 1.958820 | 2.041180 | -0.4137 % | 2.0250 % | PASS 20.43 % | |
| 2.0 V AC+DC @ 300.0 kHz | 1.9889816 | 0.0340 % | 1.958820 | 2.041180 | -0.5509 % | 2.0250 % | PASS 27.20 % | |
| 2.0 V AC+DC @ 500.0 kHz | 1.9890385 | 0.0900 % | 1.954200 | 2.045800 | -0.5481 % | 2.2000 % | PASS 24.89 % | |
| 2.0 V AC+DC @ 1.0 MHz | 1.9978560 | 0.1500 % | 1.953000 | 2.047000 | -0.1072 % | 2.2000 % | PASS 4.86 % | |
| 20 V AC+DC @ 10 Hz | 19.997927 | 0.0220 % | 19.915600 | 20.084400 | -0.0104 % | 0.4000 % | PASS 2.59 % | |
| 20 V AC+DC @ 20 Hz | 19.998453 | 0.0083 % | 19.918350 | 20.081650 | -0.0077 % | 0.4000 % | PASS 1.93 % | |
| 20 V AC+DC @ 50 Hz | 19.999290 | 0.0040 % | 19.963210 | 20.036790 | -0.0035 % | 0.1800 % | PASS 1.97 % | |
| 20 V AC+DC @ 60 Hz | 19.999526 | 0.0040 % | 19.963210 | 20.036790 | -0.0024 % | 0.1800 % | PASS 1.32 % | |
| 20 V AC+DC @ 100 Hz | 20.000350 | 0.0040 % | 19.963210 | 20.036790 | 0.0018 % | 0.1800 % | PASS 0.97 % | |
| 20 V AC+DC @ 1.0 kHz | 20.000711 | 0.0040 % | 19.963210 | 20.036790 | 0.0036 % | 0.1800 % | PASS 1.97 % | |
| 20 V AC+DC @ 6.25 kHz | 19.998099 | 0.0040 % | 19.959210 | 20.040790 | -0.0095 % | 0.2000 % | PASS 4.75 % | |
| 20 V AC+DC @ 10.0 kHz | 19.998653 | 0.0040 % | 19.959210 | 20.040790 | -0.0067 % | 0.2000 % | PASS 3.37 % | |
| 20 V AC+DC @ 20.0 kHz | 20.001131 | 0.0040 % | 19.959210 | 20.040790 | 0.0057 % | 0.2000 % | PASS 2.83 % | |
| 20 V AC+DC @ 50.0 kHz | 20.003420 | 0.0070 % | 19.954600 | 20.045400 | 0.0171 % | 0.2200 % | PASS 7.77 % | |
| 20 V AC+DC @ 100.0 kHz | 19.995510 | 0.0100 % | 19.908000 | 20.092000 | -0.0225 % | 0.4500 % | PASS 4.99 % | |
| 20 V AC+DC @ 200.0 kHz | 19.976840 | 0.0280 % | 19.144400 | 20.855600 | -0.1158 % | 4.2500 % | PASS 2.72 % | |
| 20 V AC+DC @ 300.0 kHz | 19.987975 | 0.0280 % | 19.144400 | 20.855600 | -0.0601 % | 4.2500 % | PASS 1.41 % | |
| 20 V AC+DC @ 500.0 kHz | 20.075260 | 0.0900 % | 18.782000 | 21.218000 | 0.3763 % | 6.0000 % | PASS 6.27 % | |
| 20 V AC+DC @ 1.0 MHz | 20.428847 | 0.1400 % | 18.772000 | 21.228000 | 2.1442 % | 6.0000 % | PASS 35.73 % | |
| 200.0 V AC+DC @ 10 Hz | 200.03863 | 0.0220 % | 199.426000 | 200.574000 | 0.0193 % | 0.2650 % | PASS 7.26 % | |
| 200.0 V AC+DC @ 20 Hz | 200.04170 | 0.0083 % | 199.453500 | 200.546500 | 0.0209 % | 0.2650 % | PASS 7.86 % | |
| 200.0 V AC+DC @ 50 Hz | 200.04433 | 0.0048 % | 199.900400 | 200.099600 | 0.0222 % | 0.0450 % | PASS 48.98 % | |
| 200.0 V AC+DC @ 60 Hz | 200.04326 | 0.0048 % | 199.900400 | 200.099600 | 0.0216 % | 0.0450 % | PASS 47.80 % | |
| 200.0 V AC+DC @ 100 Hz | 200.04370 | 0.0048 % | 199.900400 | 200.099600 | 0.0218 % | 0.0450 % | PASS 48.28 % | |
| 200.0 V AC+DC @ 1.0 kHz | 200.05018 | 0.0048 % | 199.900400 | 200.099600 | 0.0251 % | 0.0450 % | PASS 55.44 % | |
| 200.0 V AC+DC @ 6.25 kHz | 200.01296 | 0.0048 % | 199.860400 | 200.139600 | 0.0065 % | 0.0650 % | PASS 9.94 % | |
| 200.0 V AC+DC @ 10.0 kHz | 200.02226 | 0.0048 % | 199.860400 | 200.139600 | 0.0111 % | 0.0650 % | PASS 17.08 % | |
| 200.0 V AC+DC @ 20.0 kHz | 200.04465 | 0.0048 % | 199.860400 | 200.139600 | 0.0223 % | 0.0650 % | PASS 34.25 % | |
| 200.0 V AC+DC @ 50.0 kHz | 200.03584 | 0.0075 % | 199.815000 | 200.185000 | 0.0179 % | 0.0850 % | PASS 21.01 % | |
| 200.0 V AC+DC @ 100 kHz | 199.90553 | 0.0133 % | 199.343500 | 200.656500 | -0.0472 % | 0.3150 % | PASS 14.98 % | |
| 700.0 V AC+DC @ 50 Hz | 699.96195 | 0.0079 % | 699.101952 | 700.898048 | -0.0054 % | 0.1204 % | PASS 4.50 % | |
| 700.0 V AC+DC @ 60 Hz | 699.9952 | 0.0079 % | 699.101952 | 700.898048 | -0.0007 % | 0.1204 % | PASS 0.57 % | |
| 700.0 V AC+DC @ 100 Hz | 700.02635 | 0.0079 % | 699.101952 | 700.898048 | 0.0038 % | 0.1204 % | PASS 3.12 % | |
| 700.0 V AC+DC @ 1.0 kHz | 700.1860 | 0.0079 % | 699.101952 | 700.898048 | 0.0266 % | 0.1204 % | PASS 22.02 % | |
| 700.0 V AC+DC @ 6.25 kHz | 700.1185 | 0.0111 % | 698.869650 | 701.130350 | 0.0169 % | 0.1504 % | PASS 11.22 % | |
| 700.0 V AC+DC @ 10.0 kHz | 700.1647 | 0.0111 % | 698.869650 | 701.130350 | 0.0235 % | 0.1504 % | PASS 15.60 % | |
| 700.0 V AC+DC @ 20.0 kHz | 700.2332 | 0.0111 % | 698.869650 | 701.130350 | 0.0333 % | 0.1504 % | PASS 22.09 % | |
Table 15: AC Voltage gain and flatness performance, as adjusted and returned
Everything passed in solid green for AC Voltage, with the worst deviation 55% for 200 V 1 kHz test point. Even challenging 20 mV point (10% of 210mV range) is able to meet specs well.
Below are Keithley’s specifications for DC Current that we verify performance against.

Image 18: Tested DC Current specifications marked in blue
Important change on this test was implemented compared to previous “as received” verification. There was noticeable slope of the DC current readout from 2002 with applied test current 1.0 and 2.0 A. This is due to self-heating of the current shunt and circuits around it when such large current is constantly applied.
| Keithley 2002,0789419,A08/A02, Last adjustment date 13.JAN.2023. Performance verification xDevs.com Rev.2556/2553 15.JAN.2023 | ||||||||
|---|---|---|---|---|---|---|---|---|
| Procedure for all test points that verify Gain of the DC Current DCI. 2-wire connection at LO and DCI is used between DMM and MFC. | ||||||||
| Zero µADC | 0 | 4.45E-10 | ZERO REF | |||||
| 1 µADC | 1E-06 | 1.00058E-06 | 1619.37 ppm | 9.971316E-07 | 1.002868E-06 | 0.058 % | 1249 ppm | PASS 28.36 % |
| 2 µADC | 2E-06 | 2.00063E-06 | 821.32 ppm | 1.997058E-06 | 2.002942E-06 | 315 ppm | 649 ppm | PASS 30.08 % |
| -1 µADC | -1E-06 | -9.99365E-07 | 1619.37 ppm | -1.00287E-06 | -9.971296E-07 | -0.063 % | 1251 ppm | PASS 31.03 % |
| -2 µADC | -2E-06 | -1.99946E-06 | 821.32 ppm | -2.002944E-06 | -1.997056E-06 | -270 ppm | 651 ppm | PASS 25.77 % |
| Zero 00 µADC | 0 | 5.65E-10 | ZERO REF | |||||
| 10 µADC | 1E-05 | 1.000066E-05 | 181.97 ppm | 9.996481E-06 | 1.000352E-05 | 66 ppm | 170 ppm | PASS 26.51 % |
| 20 µADC | 2E-05 | 2.000069E-05 | 101.99 ppm | 1.999576E-05 | 2.000424E-05 | 35 ppm | 110 ppm | PASS 23.17 % |
| -10 µADC | -1E-05 | -9.999485E-06 | 181.97 ppm | -1.000352E-05 | -9.996479E-06 | -51 ppm | 170 ppm | PASS 20.68 % |
| 20 µADC | -2E-05 | -1.99996E-05 | 101.99 ppm | -2.000424E-05 | -1.999576E-05 | -20 ppm | 110 ppm | PASS 13.33 % |
| Zero 000 µADC | 0 | 5.85E-10 | ZERO REF | |||||
| 100 µADC | 0.0001 | 0.0001000006 | 38.00 ppm | 9.999E-05 | 0.00010001 | 6 ppm | 62 ppm | PASS 8.73 % |
| 200 µADC | 0.0002 | 0.0002 | 30.00 ppm | 0.0001999828 | 0.0002000172 | -0 ppm | 56 ppm | PASS 0.16 % |
| -100 µADC | -0.0001 | -0.0001000005 | 38.00 ppm | -0.00010001 | -9.999E-05 | 5 ppm | 62 ppm | PASS 6.33 % |
| -200 µADC | -0.0002 | -0.0002000013 | 30.00 ppm | -0.0002000172 | -0.0001999828 | 7 ppm | 56 ppm | PASS 10.31 % |
| Zero mADC | 0 | 3.75E-09 | ZERO REF | |||||
| -1.0 mADC | 0.001 | 0.001000006 | 26.00 ppm | 0.000999914 | 0.001000086 | 6 ppm | 60 ppm | PASS 9.48 % |
| 2.0 mADC | 0.002 | 0.001999999 | 24.00 ppm | 0.001999842 | 0.002000158 | -1 ppm | 55 ppm | PASS 0.96 % |
| -1.0 mADC | -0.001 | -0.001000004 | 26.00 ppm | -0.001000086 | -0.000999914 | 4 ppm | 60 ppm | PASS 6.58 % |
| -2.0 mADC | -0.002 | -0.002000014 | 24.00 ppm | -0.002000158 | -0.001999842 | 7 ppm | 55 ppm | PASS 11.33 % |
| Zero 00 mADC | 0 | 3.45E-08 | ZERO REF | |||||
| 10 mADC | 0.01 | 0.01000011 | 26 ppm | 0.00999914 | 0.01000086 | 11 ppm | 60 ppm | PASS 16.36 % |
| 20 mADC | 0.02 | 0.02000012 | 24 ppm | 0.01999842 | 0.02000158 | 6 ppm | 55 ppm | PASS 10.04 % |
| -10 mADC | -0.01 | -0.01000012 | 26 ppm | -0.01000086 | -0.00999914 | 12 ppm | 60 ppm | PASS 19.04 % |
| -20 mADC | -0.02 | -0.02000026 | 24 ppm | -0.02000158 | -0.01999842 | 13 ppm | 55 ppm | PASS 21.62 % |
| Zero 000 mADC | 0 | 3.1E-07 | ZERO REF | |||||
| 100 mADC | 0.1 | 0.1000015 | 27.5 ppm | 0.09998875 | 0.1000112 | 15 ppm | 85 ppm | PASS 17.24 % |
| 200 mADC | 0.2 | 0.1999979 | 26.25 ppm | 0.1999788 | 0.2000212 | -11 ppm | 80 ppm | PASS 12.59 % |
| -100 mADC | -0.1 | -0.1000022 | 27.5 ppm | -0.1000113 | -0.09998875 | 22 ppm | 85 ppm | PASS 24.51 % |
| -200 mADC | -0.2 | -0.2000009 | 26.25 ppm | -0.2000213 | -0.1999787 | 5 ppm | 80 ppm | PASS 5.34 % |
| Zero ADC | 0 | 1.4E-06 | ZERO REF | |||||
| 2 ADC | 2 | 2.000063 | 43 ppm | 1.999204 | 2.000796 | 31 ppm | 355 ppm | PASS 8.79 % |
| 1 ADC | 1 | 0.999893 | 46 ppm | 0.999594 | 1.000406 | -107 ppm | 360 ppm | PASS 29.48 % |
| -1 ADC | -1 | -0.9998992 | 46 ppm | -1.000406 | -0.999594 | -101 ppm | 360 ppm | PASS 27.77 % |
| -2 ADC | -2 | -2.000169 | 43 ppm | -2.000796 | -1.999204 | 85 ppm | 355 ppm | PASS 23.66 % |
Table 16: DC current gain and zero offset performance, as adjusted and returned
Original calibration program had 5 minute soak time to allow the shunt to stabilize under power, but as additional checks showed this 2002 needed much more time. So new procedure 2556 was modified to accommodate for additional time during the warm-up stage. Since our Calkit Python application logs all readings and timestamps of every single GPIB-command sent to calibrator and DMM I’ve plotted a chart to demonstrate observed results.
Three different Keithley 2002 were tested for 2A range heating effects and all three show similar behavior. Based on this it is deemed to be typical for these instruments. Perhaps Keithley 2001 is also the same as DALE SPU-52-1 2W current shunt for high current range is identical between these instruments.

Image 19: Self-heating effect at higher currents due to shunt PCR/TCR
New method has a new test order for the higher 2A range of K2002. First -2A DC applied and calibrator is allowed to settle to steady state. Then DMM is configured to log current measurements during 20 minutes (vs 5 minutes for old script) which is about 3000 readings at NPLC10.
After this, median of last 15 readings is saved as the final point. There was still small residual readings drift but it was already under 2 ppm/minute, so considered as acceptable.
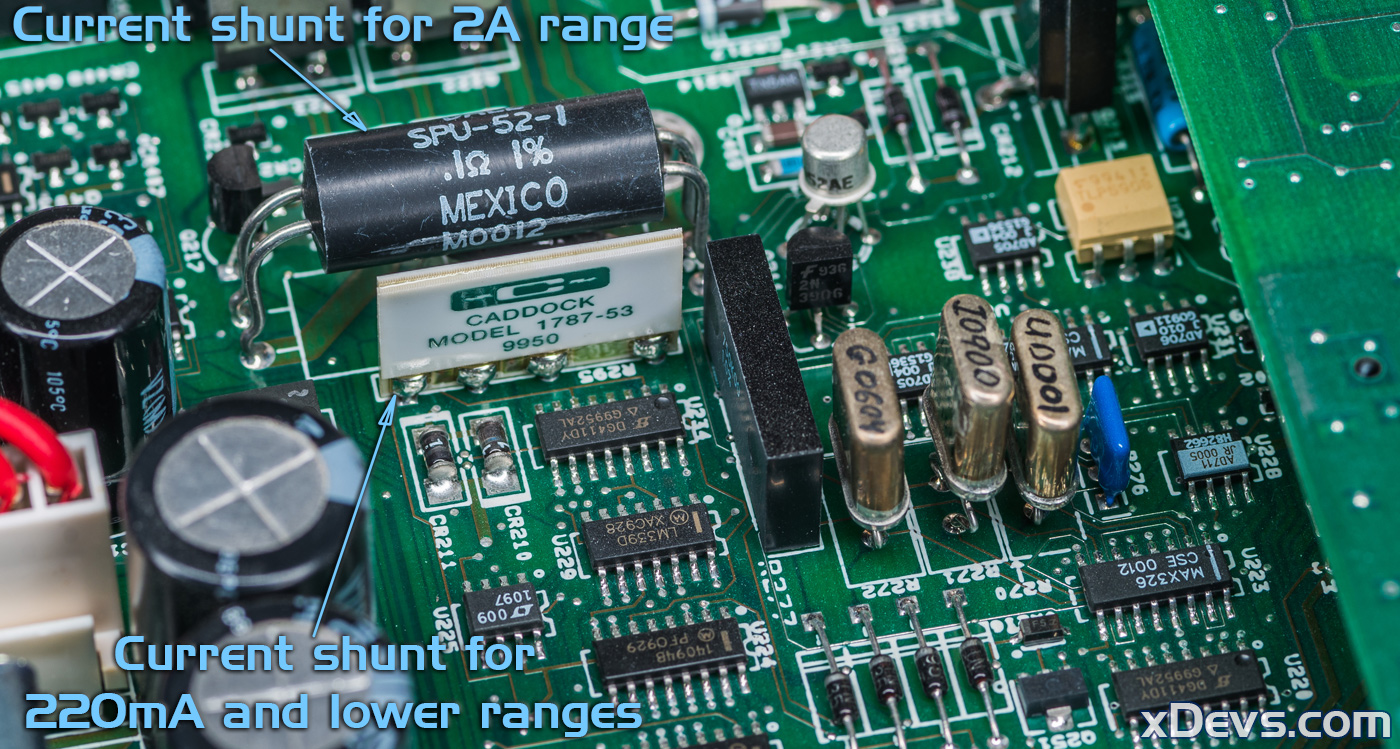
Image 20: Shunts used in Keithley 2002 (photo of different unit shown for reference)
Please note, that while this sounds like a problem, it is actually normal for condition for benchtop DMM. This self-heating effect is still well inside even strict 24-hour specifications of the instrument’s 2A DCI range, as one can guess from the dashed blue line of spec limit, all the way on the top of the plot. Keithley already accounted for possible self-heating errors and included them in a generous 360 ppm specification for 24 hrs. period.
Even very expensive high-end DMMs like Model 2002 use real-world imperfect components which change parameters under applied power due material physics and design constrains. That is also why high-end calibrators that are capable of testing 7½-digit DMMs are filled with custom components, precision ovens and high stability resistive networks. All this results in a large size (Wavetek 4808 is 32kg, Fluke 5720A is 27kg), lot of power consumption and prices just slightly below $100k USD.
Obviously benchtop DMM like Keithley 2002 is designed to be a practical instrument at a lower price point, so performance here is less demanding. This is why DALE SPU-52-1 2W is used in this bench DMM, despite it’s ±100 ppm/°C specification.
Below are Keithley’s specifications for AC Current that we verify performance against. Sourcing currents with frequency above 10 kHz is outside of 5720A capabilities so those points were not tested.

Image 21: Tested AC Current specifications marked in blue
| Keithley 2002,0789419,A08/A02, Last adjustment date 13.JAN.2023. Performance verification xDevs.com Rev.2556/2553 15.JAN.2023 | ||||||||
|---|---|---|---|---|---|---|---|---|
| Procedure for all test points that verify Gain of the AC Current ACI. 2-wire connection at LO and ACI is used between DMM and MFC. | ||||||||
| ACI Test | 200µA-2A | DUT | Source unc. | Low Limit | Hi limit | Measured | 24h spec | Result, % spec |
| 10 µA AC @ 50 Hz | 1e-05 | 9.728500e-06 | 0.0165 % | 9.95335E-06 | 1.00467E-05 | -2.7150 % | 0.4500 % | REF |
| 50 µA AC @ 50 Hz | 5e-05 | 5.000220e-05 | 0.0165 % | 4.98267E-05 | 5.01733E-05 | 0.0044 % | 0.3300 % | PASS 1.33 % |
| 100 µA AC @ 50 Hz | 0.0001 | 9.997700e-05 | 0.0165 % | 9.96685E-05 | 0.000100332 | -0.0230 % | 0.3150 % | PASS 7.29 % |
| 200 µA AC @ 50 Hz | 0.0002 | 1.998824e-04 | 0.0165 % | 0.000199352 | 0.000200648 | -0.0588 % | 0.3075 % | PASS 19.09 % |
| 1.0 mA AC @ 50 Hz | 0.001 | 9.993727e-04 | 0.0138 % | 0.000996847 | 0.00100315 | -0.0627 % | 0.3015 % | PASS 20.78 % |
| 2.0 mA AC @ 50 Hz | 0.002 | 1.999318e-03 | 0.0138 % | 0.00199371 | 0.00200629 | -0.0341 % | 0.3007 % | PASS 11.33 % |
| 10 mA AC @ 50 Hz | 0.01 | 9.994131e-03 | 0.0138 % | 0.00996847 | 0.0100315 | -0.0587 % | 0.3015 % | PASS 19.45 % |
| 20 mA AC @ 50 Hz | 0.02 | 1.999414e-02 | 0.0138 % | 0.0199371 | 0.0200629 | -0.0293 % | 0.3007 % | PASS 9.73 % |
| 100 mA AC @ 50 Hz | 0.1 | 9.998597e-02 | 0.0134 % | 0.0996851 | 0.100315 | -0.0140 % | 0.3015 % | PASS 4.65 % |
| 200 mA AC @ 50 Hz | 0.2 | 2.000265e-01 | 0.0134 % | 0.199372 | 0.200628 | 0.0132 % | 0.3007 % | PASS 4.40 % |
| 1.0 A AC @ 50 Hz | 1.0 | 9.990631e-01 | 0.0308 % | 0.996177 | 1.00382 | -0.0937 % | 0.3515 % | PASS 26.55 % |
| 2.0 A AC @ 50 Hz | 2.0 | 1.999296e+00 | 0.0308 % | 1.99237 | 2.00763 | -0.0352 % | 0.3507 % | PASS 9.99 % |
| 10 µA AC @ 60 Hz | 1e-05 | 9.768800e-06 | 0.0165 % | 9.96835E-06 | 1.00317E-05 | -2.3120 % | 0.3000 % | REF |
| 50 µA AC @ 60 Hz | 5e-05 | 5.003850e-05 | 0.0165 % | 4.99017E-05 | 5.00983E-05 | 0.0770 % | 0.1800 % | PASS 42.60 % |
| 100 µA AC @ 60 Hz | 0.0001 | 1.000013e-04 | 0.0165 % | 9.98185E-05 | 0.000100182 | 0.0013 % | 0.1650 % | PASS 0.78 % |
| 200 µA AC @ 60 Hz | 0.0002 | 1.998909e-04 | 0.0165 % | 0.000199652 | 0.000200348 | -0.0546 % | 0.1575 % | PASS 34.45 % |
| 1.0 mA AC @ 60 Hz | 0.001 | 9.994923e-04 | 0.0138 % | 0.000998347 | 0.00100165 | -0.0508 % | 0.1515 % | PASS 33.37 % |
| 2.0 mA AC @ 60 Hz | 0.002 | 1.999520e-03 | 0.0138 % | 0.00199671 | 0.00200329 | -0.0240 % | 0.1507 % | PASS 15.86 % |
| 10 mA AC @ 60 Hz | 0.01 | 9.995526e-03 | 0.0138 % | 0.00998347 | 0.0100165 | -0.0447 % | 0.1515 % | PASS 29.41 % |
| 20 mA AC @ 60 Hz | 0.02 | 1.999627e-02 | 0.0138 % | 0.0199671 | 0.0200329 | -0.0186 % | 0.1507 % | PASS 12.32 % |
| 100 mA AC @ 60 Hz | 0.1 | 9.999913e-02 | 0.0134 % | 0.0998351 | 0.100165 | -0.0009 % | 0.1515 % | PASS 0.57 % |
| 200 mA AC @ 60 Hz | 0.2 | 2.000417e-01 | 0.0134 % | 0.199672 | 0.200328 | 0.0209 % | 0.1507 % | PASS 13.79 % |
| 1.0 A AC @ 60 Hz | 1.0 | 9.991929e-01 | 0.0308 % | 0.997677 | 1.00232 | -0.0807 % | 0.2015 % | PASS 39.59 % |
| 2.0 A AC @ 60 Hz | 2.0 | 1.999432e+00 | 0.0308 % | 1.99537 | 2.00463 | -0.0284 % | 0.2007 % | PASS 13.99 % |
| 10 µA AC @ 1.0 kHz | 1e-05 | 9.734200e-06 | 0.0165 % | 9.97135E-06 | 1.00287E-05 | -2.6580 % | 0.2700 % | REF |
| 50 µA AC @ 1.0 kHz | 5e-05 | 5.001250e-05 | 0.0165 % | 4.99167E-05 | 5.00833E-05 | 0.0250 % | 0.1500 % | PASS 16.57 % |
| 100 µA AC @ 1.0 kHz | 0.0001 | 1.000014e-04 | 0.0165 % | 9.98485E-05 | 0.000100152 | 0.0014 % | 0.1350 % | PASS 1.03 % |
| 200 µA AC @ 1.0 kHz | 0.0002 | 1.999370e-04 | 0.0165 % | 0.000199712 | 0.000200288 | -0.0315 % | 0.1275 % | PASS 24.50 % |
| 1.0 mA AC @ 1.0 kHz | 0.001 | 9.996766e-04 | 0.0138 % | 0.000998647 | 0.00100135 | -0.0323 % | 0.1215 % | PASS 26.45 % |
| 2.0 mA AC @ 1.0 kHz | 0.002 | 1.999922e-03 | 0.0138 % | 0.00199731 | 0.00200269 | -0.0039 % | 0.1207 % | PASS 3.19 % |
| 10 mA AC @ 1.0 kHz | 0.01 | 9.997750e-03 | 0.0138 % | 0.00998647 | 0.0100135 | -0.0225 % | 0.1215 % | PASS 18.40 % |
| 20 mA AC @ 1.0 kHz | 0.02 | 2.000137e-02 | 0.0138 % | 0.0199731 | 0.0200269 | 0.0068 % | 0.1207 % | PASS 5.63 % |
| 100 mA AC @ 1.0 kHz | 0.1 | 1.000220e-01 | 0.0134 % | 0.0998351 | 0.100165 | 0.0220 % | 0.1515 % | PASS 14.47 % |
| 200 mA AC @ 1.0 kHz | 0.2 | 2.000983e-01 | 0.0134 % | 0.199672 | 0.200328 | 0.0492 % | 0.1507 % | PASS 32.48 % |
| 1.0 A AC @ 1.0 kHz | 1.0 | 9.994080e-01 | 0.0308 % | 0.995177 | 1.00482 | -0.0592 % | 0.4515 % | PASS 13.08 % |
| 2.0 A AC @ 1.0 kHz | 2.0 | 1.999977e+00 | 0.0308 % | 1.99037 | 2.00963 | -0.0012 % | 0.4507 % | PASS 0.26 % |
| 10 µA AC @ 10.0 kHz | 1e-05 | 9.738500e-06 | 0.1400 % | 9.946E-06 | 1.0054E-05 | -2.6150 % | 0.4000 % | REF |
| 50 µA AC @ 10.0 kHz | 5e-05 | 5.004890e-05 | 0.1400 % | 4.979E-05 | 5.021E-05 | 0.0978 % | 0.2800 % | PASS 31.24 % |
| 100 µA AC @ 10.0 kHz | 0.0001 | 1.000675e-04 | 0.1400 % | 9.9595E-05 | 0.000100405 | 0.0675 % | 0.2650 % | PASS 22.52 % |
| 200 µA AC @ 10.0 kHz | 0.0002 | 2.000610e-04 | 0.1400 % | 0.000199205 | 0.000200795 | 0.0305 % | 0.2575 % | PASS 10.41 % |
| 1.0 mA AC @ 10.0 kHz | 0.001 | 9.999335e-04 | 0.1400 % | 0.000996085 | 0.00100391 | -0.0067 % | 0.2515 % | PASS 2.31 % |
| 2.0 mA AC @ 10.0 kHz | 0.002 | 2.000202e-03 | 0.1400 % | 0.00199219 | 0.00200781 | 0.0101 % | 0.2507 % | PASS 3.52 % |
| 10 mA AC @ 10.0 kHz | 0.01 | 9.998835e-03 | 0.1300 % | 0.00996185 | 0.0100381 | -0.0117 % | 0.2515 % | PASS 4.11 % |
| 20 mA AC @ 10.0 kHz | 0.02 | 2.000104e-02 | 0.1300 % | 0.0199239 | 0.0200761 | 0.0052 % | 0.2507 % | PASS 1.85 % |
| 100 mA AC @ 10.0 kHz | 0.1 | 1.000721e-01 | 0.1100 % | 0.0993885 | 0.100611 | 0.0721 % | 0.5015 % | PASS 14.04 % |
| 200 mA AC @ 10.0 kHz | 0.2 | 2.001703e-01 | 0.1100 % | 0.198779 | 0.201221 | 0.0852 % | 0.5007 % | PASS 16.61 % |
| 1.0 A AC @ 10.0 kHz | 1.0 | 9.962851e-01 | 0.6100 % | 0.978885 | 1.02111 | -0.3715 % | 1.5015 % | PASS 22.92 % |
| 2.0 A AC @ 10.0 kHz | 2.0 | 1.991554e+00 | 0.6100 % | 1.95779 | 2.04221 | -0.4223 % | 1.5007 % | PASS 26.07 % |
Table 17: AC current gain and flatness performance, as adjusted and returned
AC current specifications for 2002 are quite wide, so there are no problems to meet all points in solid green here.
DC Voltage INL tests of Keithley 2002
Multimeter like Model 2002 is based on long-scale multi-slope integrating analog-to-digital converter (ADC) that converts the analog signal from the input front-end circuits to usable measurement and a digital signal that can be read by the device and provided to the display or interface bus. Non-linearity in an ADC refers to the deviation of the actual measured value from the “true” value, as the input signal changes within range of the instrument.
Non-linearity in an ADC can be caused by several factors, including the device’s internal components and the measurement configuration. For example, the ADC’s internal components such as the amplifier, comparator, and reference voltage can all cause nonlinearity effects. Additionally, the measurement environment can also affect the non-linearity, such as temperature and humidity variations due to non-zero thermal and humidity coefficients of various circuits inside DMM.
To check for non-linearity in a Keithley 2002 with a 29-bit ADC highly stable low-INL programmable voltage source with a known value is required. Such source can be for example Fluke 5720A, which we already used for performance verification earlier. However, INL specification of the 5720A is quite similar to own spec for DUT 2002, so something better is required to satisfy the metrology concept of using better reference standard to test device under test.
Golden reference for DC Voltage linearity is Quantum Voltage Standard but it’s a very expensive and rare system. Second best alternative is characterized and tested HP 3458A DMM, famous for its excellent INL performance. So we can use reference 3458A measuring 5720A source output to test our DUT Keithley 2002. Both reference 3458A and 2002 multimeters should be connected to the same precision voltage calibrator and measurements should be taken at multiple different voltage level steps to sweep thru full range. The measurements should be then compared to the known value obtained from 3458A, and the deviation from this reference value is the DUT’s non-linearity result, with source’s Fluke 5720A INL error essentially canceled out.

Image 22: System used to verify Keithley 2002 DCV linearity
It is important to note that nonlinearity can be also caused by a variety of external factors and it is not always possible to completely oslate it to DUT only without using intrinsic quantum voltage source. However, it can be minimized by using high-quality components, proper calibration methods, and by performing measurements in a controlled environment with stable temperature and humidity, so it is possible to test INL within 0.1 ppm on ±12 VDC sweep and a bit worse than this level for other ranges. Some more details are available in a dedicated article about INL benchmarking.
Operator errors and precise timing of INL sweep is ensured by automating this test with Python application. Demo code example used to perform such INL benchmark on 10V sweep is provided below for reference. It can be easily modified to test other ranges / sweep points.
Python 3 program source code to collect INL data points with K2002
This application perform configuration of source (Fluke 5720A), reference DMM (HP 3458A) and DUT Keithley 2002 DMM. After configuration is completed ACAL DCV is executed on the reference 3458A DMM and data collection of voltage sweep from -FS to +FS begins. Each data point is increased by 1% step and multiple samples are taken to reduce influence of the sampling noise. Results are recorded into semicolon-separated CSV file on the filesystem. Whole test takes few hours to complete.
Example test records DSV-file with 219 captured INL data voltage points
This datafile can be now used to plot visual X-Y chart for easy visual representation of INL performance. Python 3 again can help us here with numpy and matplotlib libraries for correlation analysis. Data between DUT DMM is reference DMM is correlated using best fit function and residual INL error is displayed relative to DUT DMM range. For easier understanding relative parts per million (ppm) scale is used.
Python 3 LinKit program to analyze and plot data
Configuration of the program, input filename, plotting parameters and chart scales are defined in separate configuration file linkit.conf. Make sure it is placed in same folder to linearity_plot.py program.
INL LinKit plotter configuration file
Finished plots are shown with simple GUI window and also saved into two images in PNG-format. Larger PNG image can be used for print or presentation, while smaller version is provided as thumbnail on web-page article like this one. Filename of the saved PNG image set is matched to input datafile name. Image files will be overwritten if they already exist in current directory.
INL LinKit plotter large PNG-image file output
INL LinKit plotter small PNG-image file output
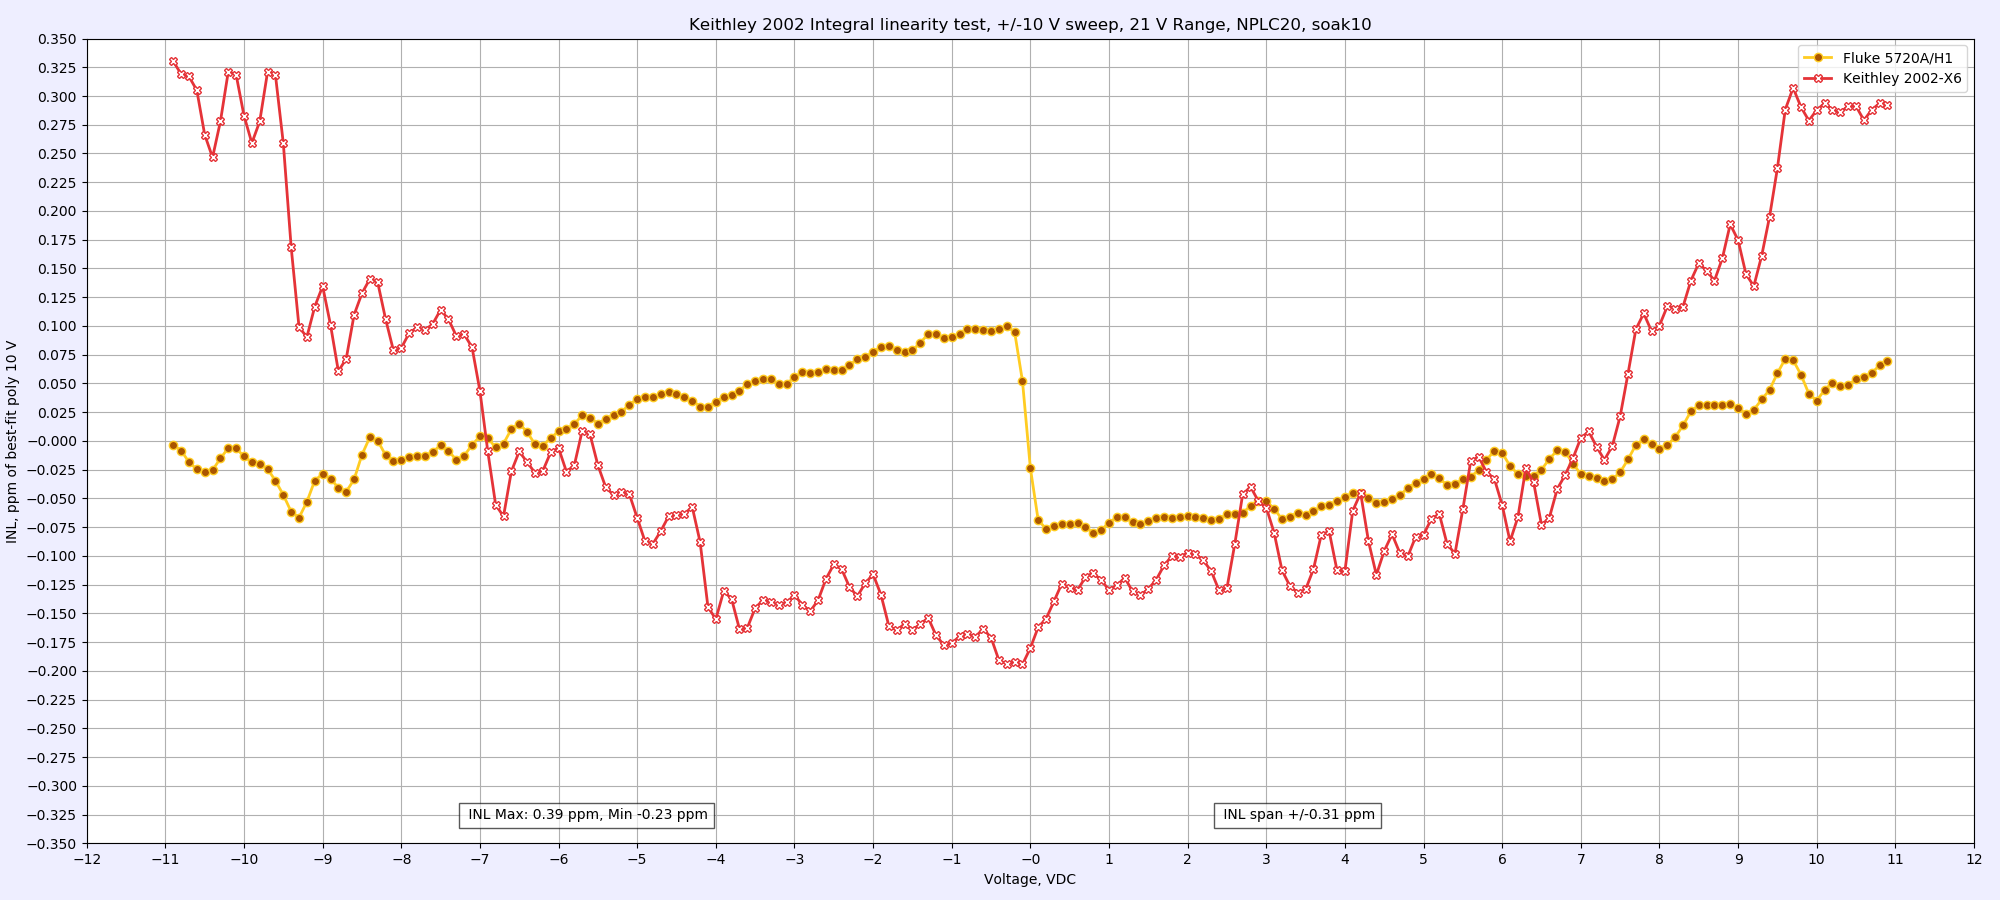
Now that instrumentation and method is defined, we can return back to our DUT Keithley 2002 instrument. INL verification was performed on its base 20V range before any calibration adjustments and on all ranges but 1kV after calibration adjustments. This is shown on chart below:

Image 23: ±11V span INL of Keithley 2002 under test, before adjustments
Keep in mind that ±11 VDC sweep covers only 50% of the range Keithley 2002 has. This test is limited by the maximum voltage of reference HP 3458A.
It was decided to keep voltage sweep limited to have closer look on common metrology range from 1V to 11V for zener calibrations. DUT Keithley 2002 data is plotted in red color. Vertical scale here is mere ±0.25 ppm of full-scale (12V for 3458A and 21V for 2002). Tandem of three different 3458A units used to correct calibrator’s INL output. HP 3458A is a proven golden standard (short of quantum standard) for DC voltage linearity, so this is what used for as reference after multiple tests on our 3458As.
As expected all HP meters demonstrate residual INL well under 0.1 ppm, typical for good working meters of this model. Keithley is quite impressive as well, with the worst error reaching +0.13 ppm at -11 VDC point and -0.05 ppm around -3.0 VDC. This meter as result is well capable of high resolution transfers on these voltages, useful for applications like divider calibration, etc.
Same INL tests were repeated after calibration adjustment. Results are available below:
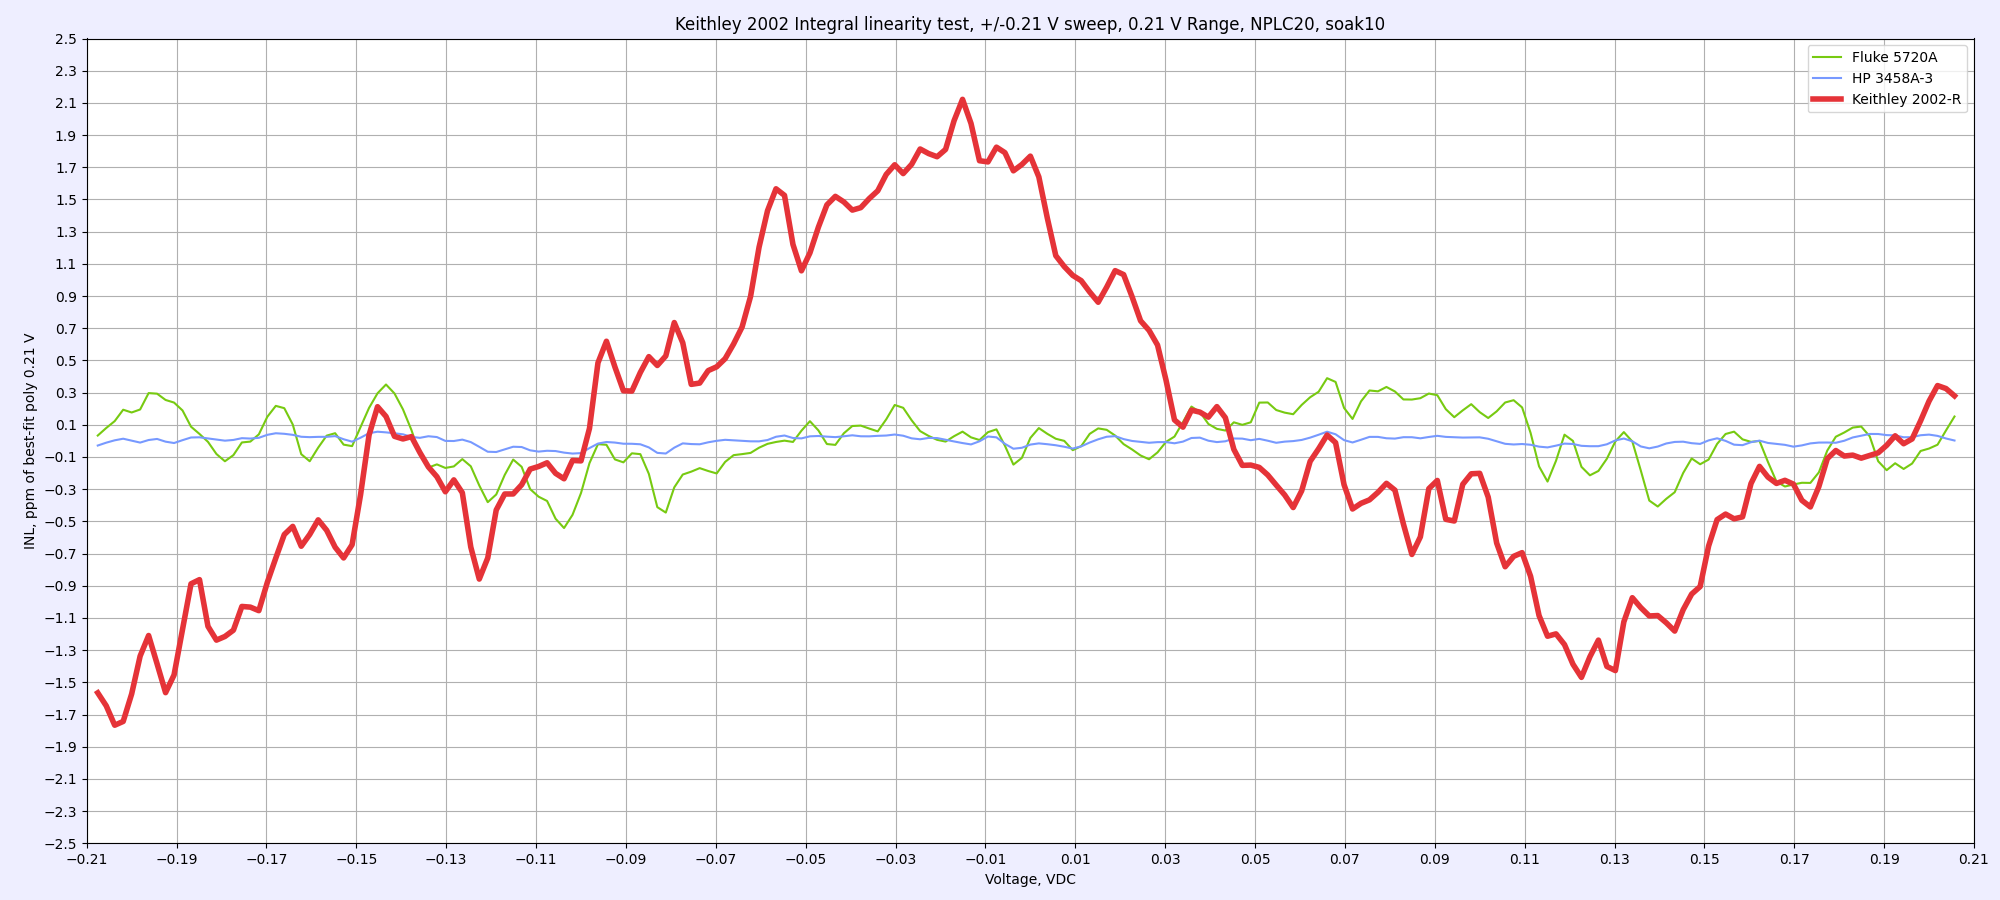
Image 24: ±0.21 V span INL of Keithley 2002 under test, after adjustments
Sweep ±0.2 V was verified against both 3458A running on 1V DC range. Non-matching positive and negative sections of the sweep hints at thermal stability/setup systematic error, so this result is likely invalid. From a measured temperature coefficient of 210mV range this Keithley has -0.97 ppm/°C and temperature change of a few degrees could easily propagate into INL deviation within a few ppm.
My reference HP 3458A DMMs don’t have temperature coefficient on 1V range so they have essentially just straight lines with some noise under 0.1ppm, as expected from comparison of two 3458A. Keep in mind that all these plots are versus reference 3458A, not 5720A programmed source.
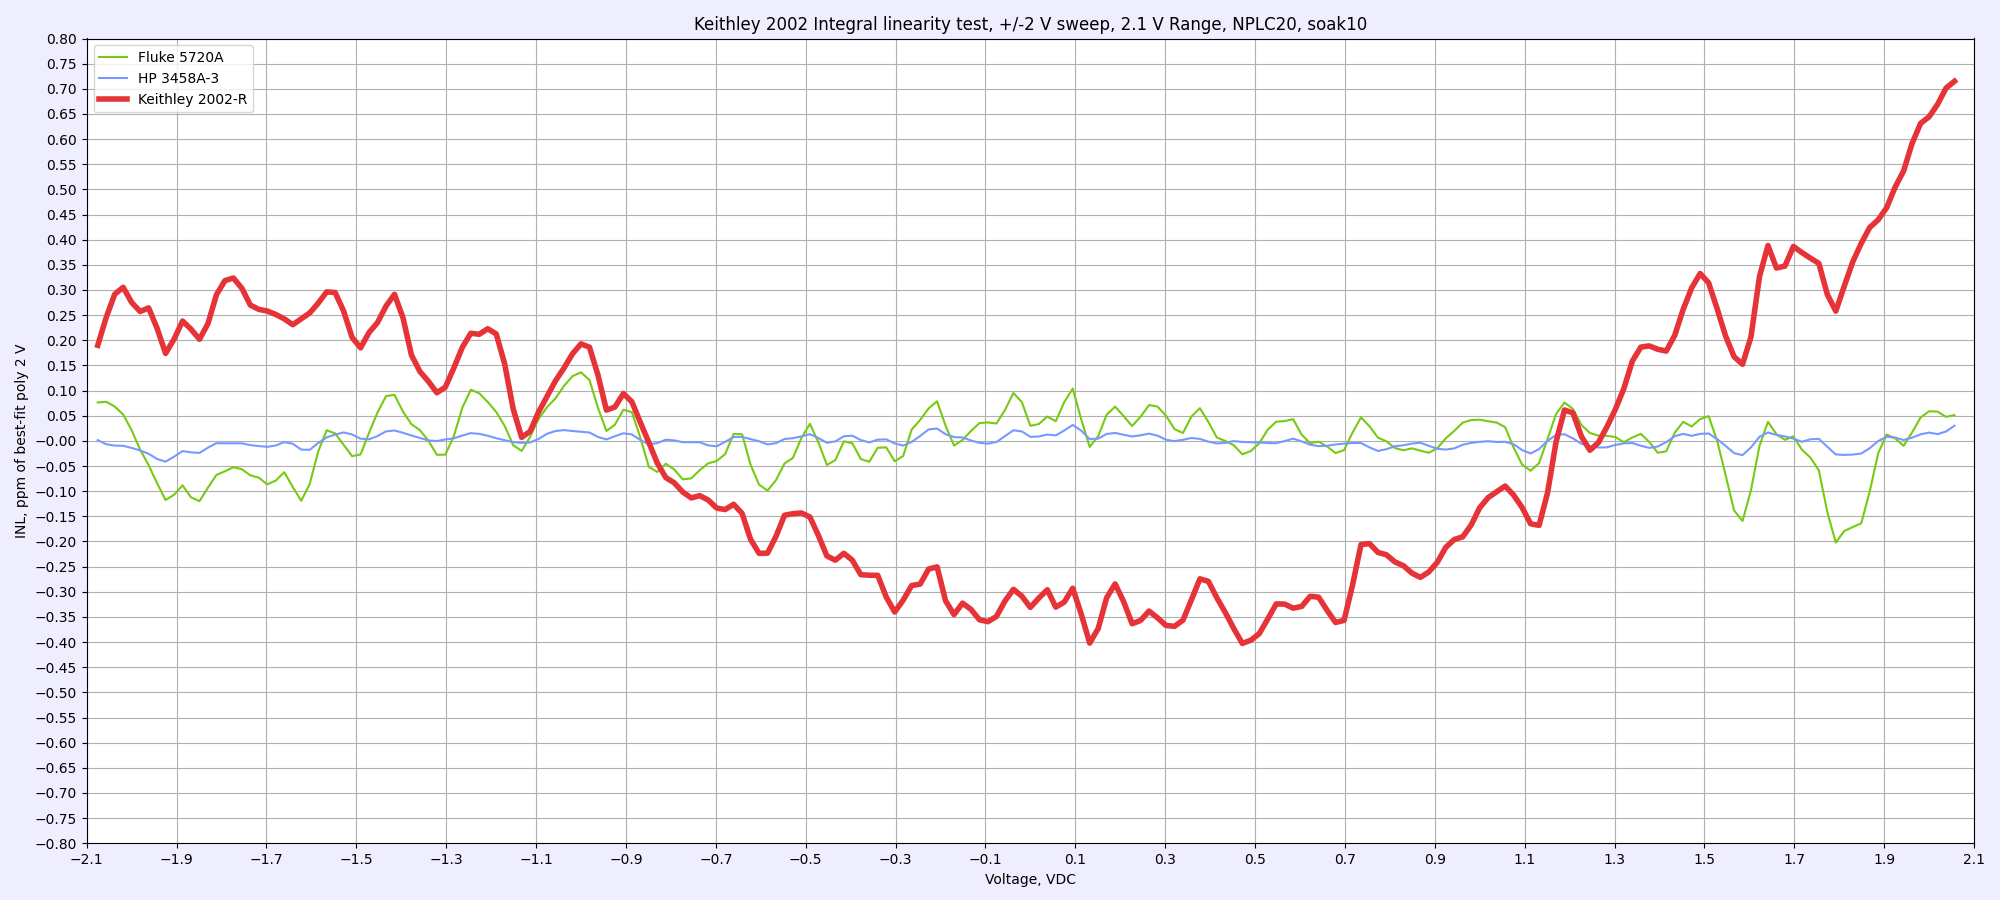
Image 25: ±2.1 V span INL of Keithley 2002 under test, after adjustments
The INL chart for 2.1 V range looks better already and is more or less symmetrical around 0V point. This brings more confidence in data, and we have the worst error at +0.7 ppm for over +2 V section and -0.4 ppm for points in -0.3 to +0.7 V.

Image 26: ±11 V span INL of Keithley 2002 under test, after adjustments
Base range 21 V for 2002 is twice wider than 12V of 3458A, so here data points are limited to only half the scale. Switching HP 3458A to a higher 100 V range to allow ±21V range would bring 5 MΩ (two 3458A with 10 MΩ input divider) loading to the node between calibrator and DMMs. This loading could be a source of errors and to be tested another time.
Notice the vertical axis scale at ±0.2 ppm, which are maximum INL limits from Keithley specification. Meter under test able to show INL below 0.1 ppm for all voltages below -9.9 to maximum tested +11 VDC. Transferring 10 V to 7 V (typical when measuring raw LTZ1000-zener reference against calibrated 10V source) can be done with this 2002 with error less than 0.2 ppm, given the other noise and temperature stability limitations.

Image 27: ±110 V span INL of Keithley 2002 under test, after adjustments
Same test is done with 210V range on Keithley. This time all meters are loading output with their 10 MΩ dividers, so HP reference meters switched to 100 V range to allow it. Fluke 5720A has plenty of drive capability to meet this load, but additional cable voltage could be affecting errors. Use this curve as indicative data only.
Back to numbers, we get maximum deviation around +0.4 to -0.2 ppm and are following fairly uniform curve.

Image 28: ±210 V span INL of Keithley 2002 under test, after adjustments
Same test repeated with HP 3458A meters configured on 1 kV ranges and sweep extended to full ±210 V levels to cover the full scale of 210 V range that 2002 has. It produced the similar result with more pronounced -0.4 ppm error around zero point. Perhaps some of the slope can be attributed to heating of Caddock input divider in Keithley 2002, since 3458A shows mostly linear response here.
INL on the 1kV range was not tested this time.
Long term drift and stability test of the USAC FX 10V zener reference
LTZ1000A-based xDevs.com FX reference has some years in the field under its belt already. It was recalibrated in 2020 and now is back again to the creator to get fresh injection of ppms.
This 10 V source is designed to fit in a small metal enclosure and requires a bipolar ±12 V power supply or battery pack to operate. Output is provided at low thermal bare copper spade lug only terminals.

Image 29: 10V DC zener xDevs.com FX module donated to USA Cal Club in 2019
Initial adjustment and calibration by xDevs.com Lab in May 2019.
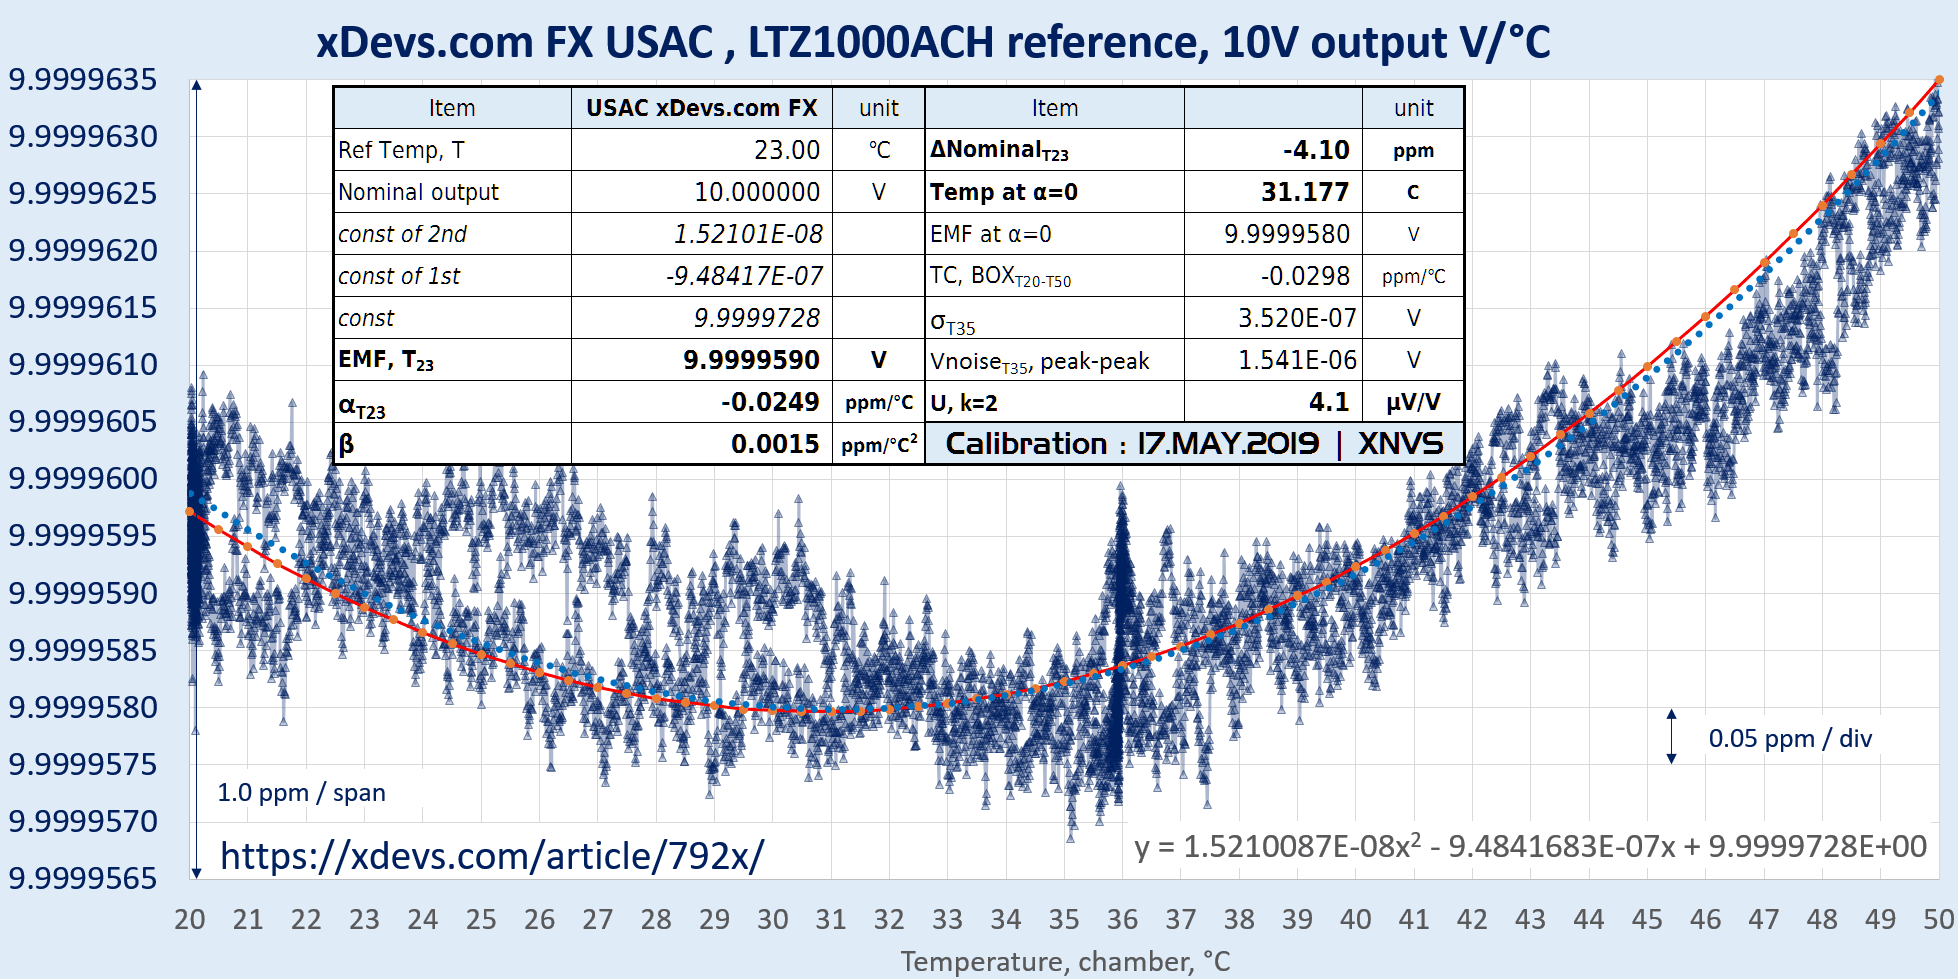
Image 30: Original calibration data on xDevs.com FX from May 2019
Recalibration of same reference in January 2021:
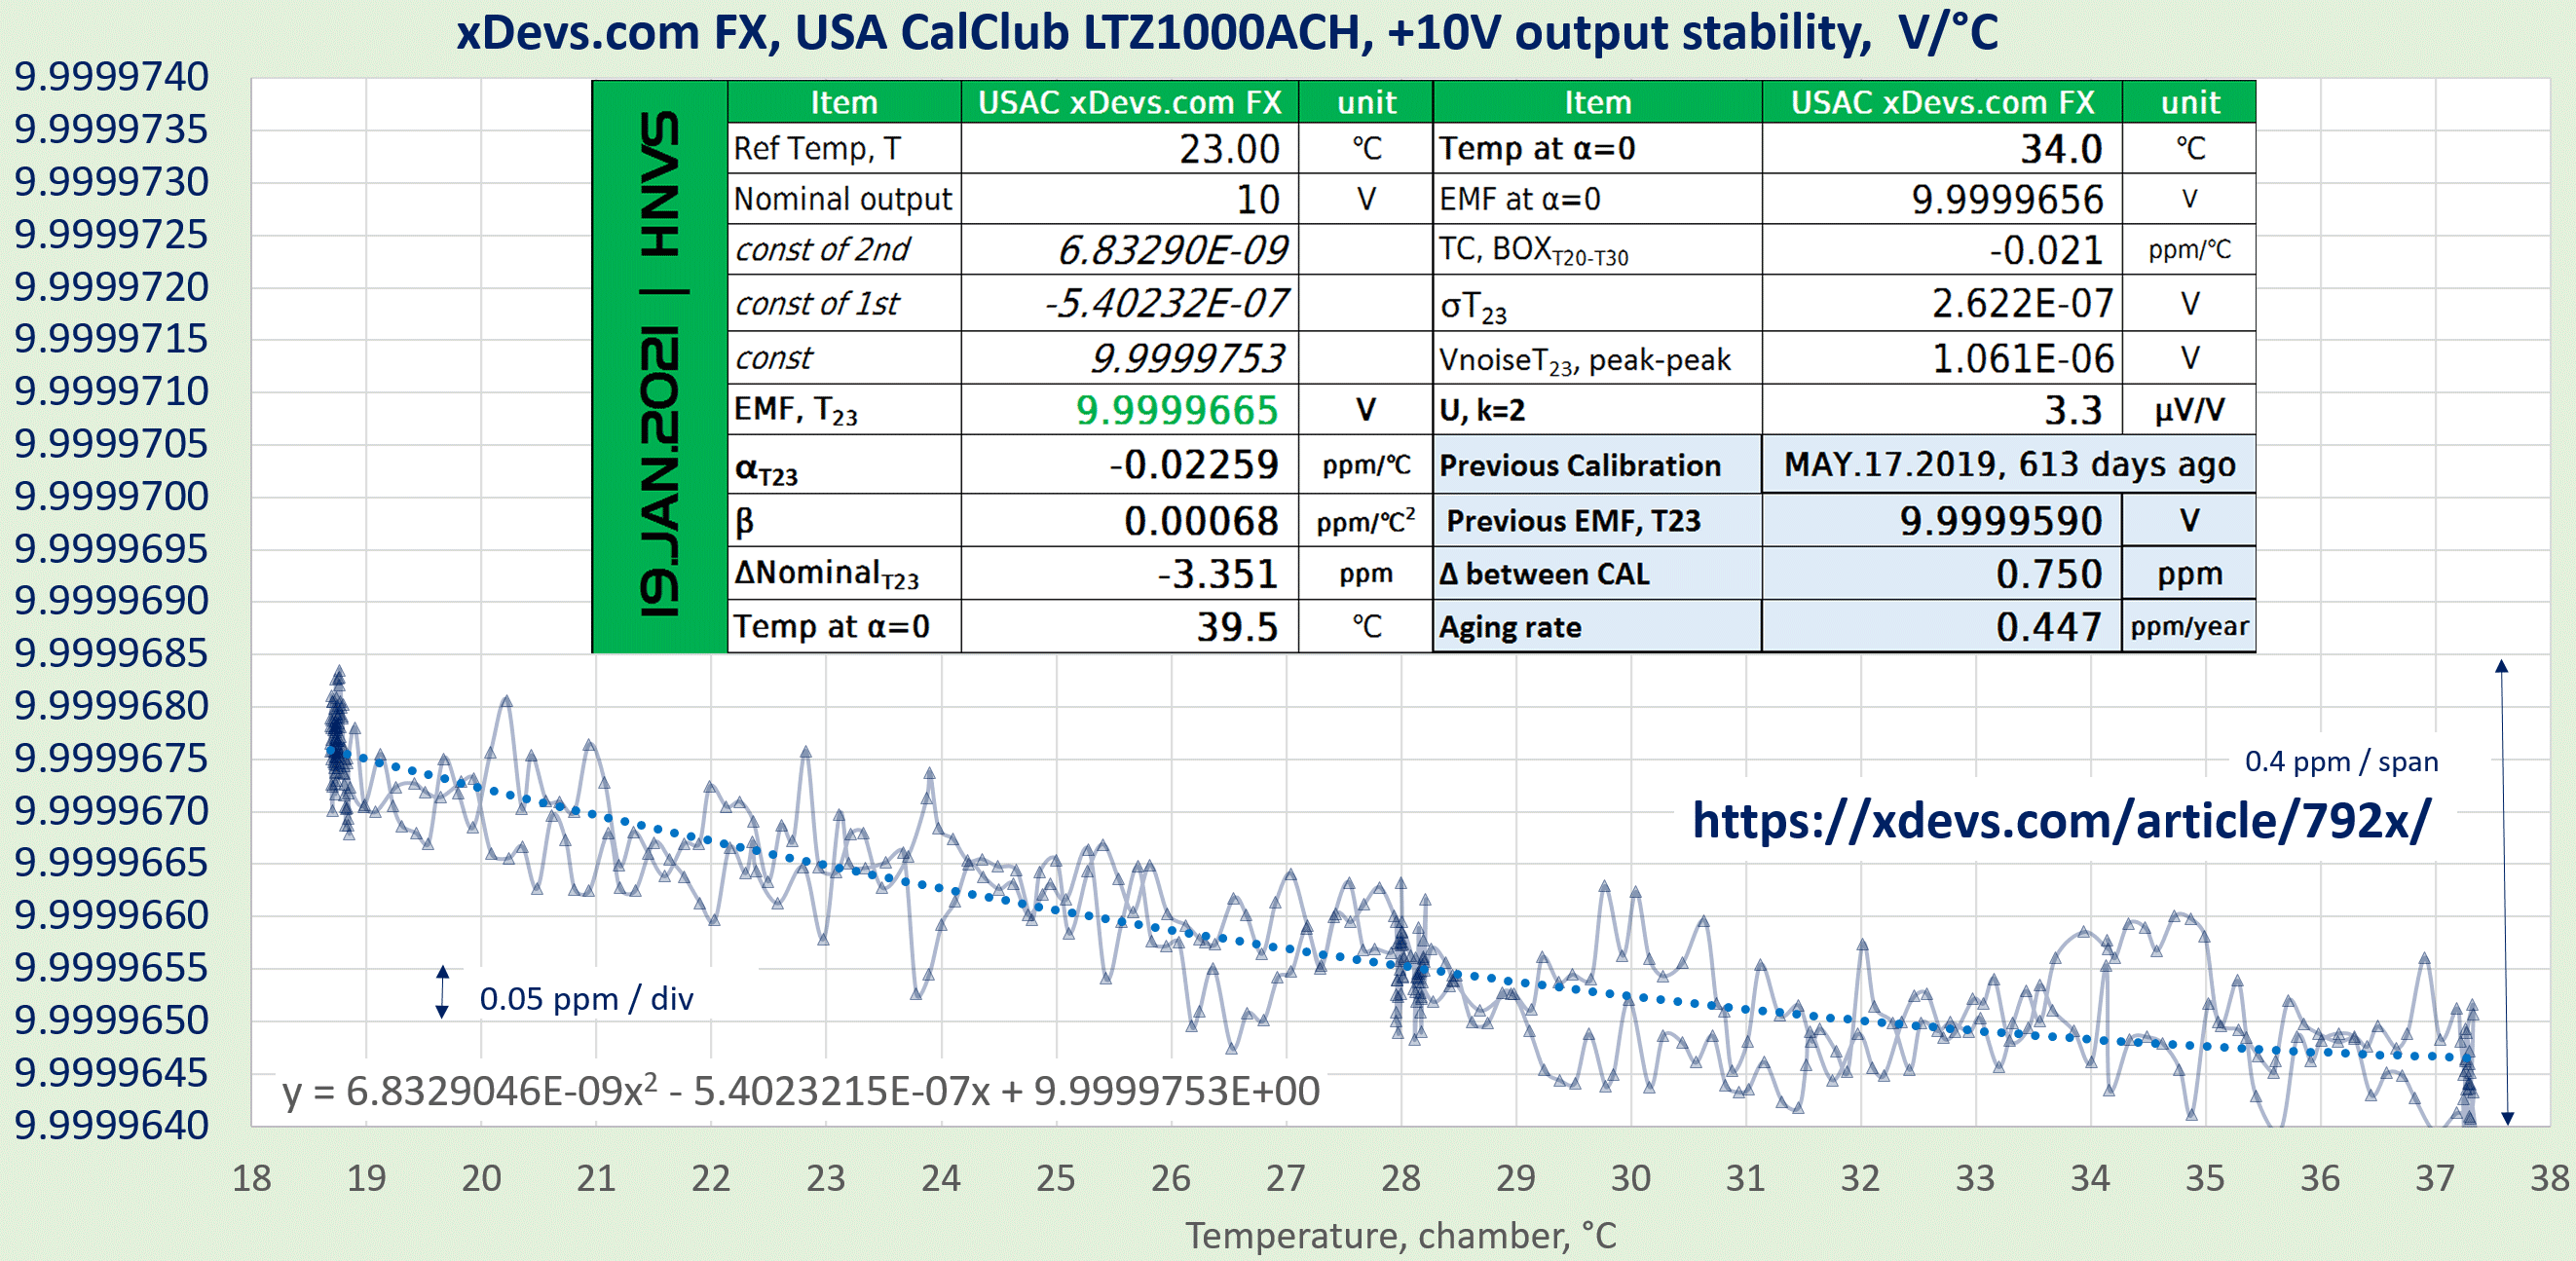
Image 31: Previous calibration data on xDevs.com FX from January 2021
xDevs.com FX calibration report, December 2020
Recalibration of this reference in November/December 2022:

Image 32: Latest timescale voltage measurement on xDevs.com FX as received November 2022
Intermediate measurement result after 41 days log.

Image 33: Longer capture until December 23 2022. Fresh ADR1000-based reference added on plot.
If we add the freshly built ADR1000-based zener standard it is interesting how the new Analog Devices chip has large linear drift. Typical LTZ1000A are known to settle much faster after initial few months of runtime.

Image 34: Final chart with reference logged from November 17, 2022 until January 14, 2023
Final dataset, 64 days long duration with USAC FX reference measured differentially against xDevs Voltage array with two Fluke 732A and 792X standards. Keithley 2182A nanovoltmeter used to digitize differential voltage between references in both polarities. Switching between different DUT zener and reference standards was done with DataProof 160A low thermal EMF scanner.
Short-term peak to peak noise of USAC FX zener output is around 0.2ppm which is typical for LTZ1000A zener output. Settling to the final value took under a day, as expected. It is best to power up the module and wait 12-24 hours after shipping to allow for this settling time.
Verification of temperature stability also performed on this FX reference. It remains to be stable with very close results with previous data. Newly calculated coefficients are α = -0.0242 ppm/°C and negligible β = +0.0003 ppm/°C2 with sweet spot temperature +69.6 °C.

Image 35: Temperature coefficient calibration on xDevs.com FX USAC unit, from +18 °C to +29.5 °C
Value of the reference assigned on January 15, 2023 at 9.99996194 VDC with uncertainty ±0.3 ppm to xDevs voltage bank array.
But without a link to the known standard this number is not worth those bytes downloaded from this page, so below is some background information on how xDevs obtained such low uncertainty for this DC voltage measurement. Zener bank array values were obtained and calibrated directly against Quantum Voltage System in early October 2022 via Datron 4910 transit zener reference array. Deviation of output voltage from using linear Keysight E36312A power supply to energize USA Club FX reference to +/-12.6 VDC compared to Fluke 792A bipolar +/-11 V battery power pack was less than 0.1 ppm.

Image 36: Long-term drift estimation using linear fit
Also the same type FX reference is utilized in our 792X in-house reference for which history since January 2018 is collected. Based on low uncertainty transfers from quantum voltage standards in the past, long term drift of that 10 V output proved to be around -0.24 ppm/year after initial stabilization in the first year. Below photo of our transfer Datron 4910 4-zener travel voltage array that was used to obtain fresh quantum-referenced volt.

Image 37: Traceability standard used previously for “xDevs.com Volt” verification
To reduce risk of damages during shipment, travel standard was shipped in the Pelican 1590 hard case. Battery-powered temperature/pressure/humidity recorder was included in the package to monitor environment changes inside the case while in transit. 4910 was switched to travel mode which maintains LTZ1000 zener cores and their ovens powered up. In this mode Datron 4910 can maintain calibration and last on battery at least 6 days, which is suitable for ground shipment. All data points with assigned uncertainty on in-house xDevs.com 792X zener are plotted on the overall chart below.
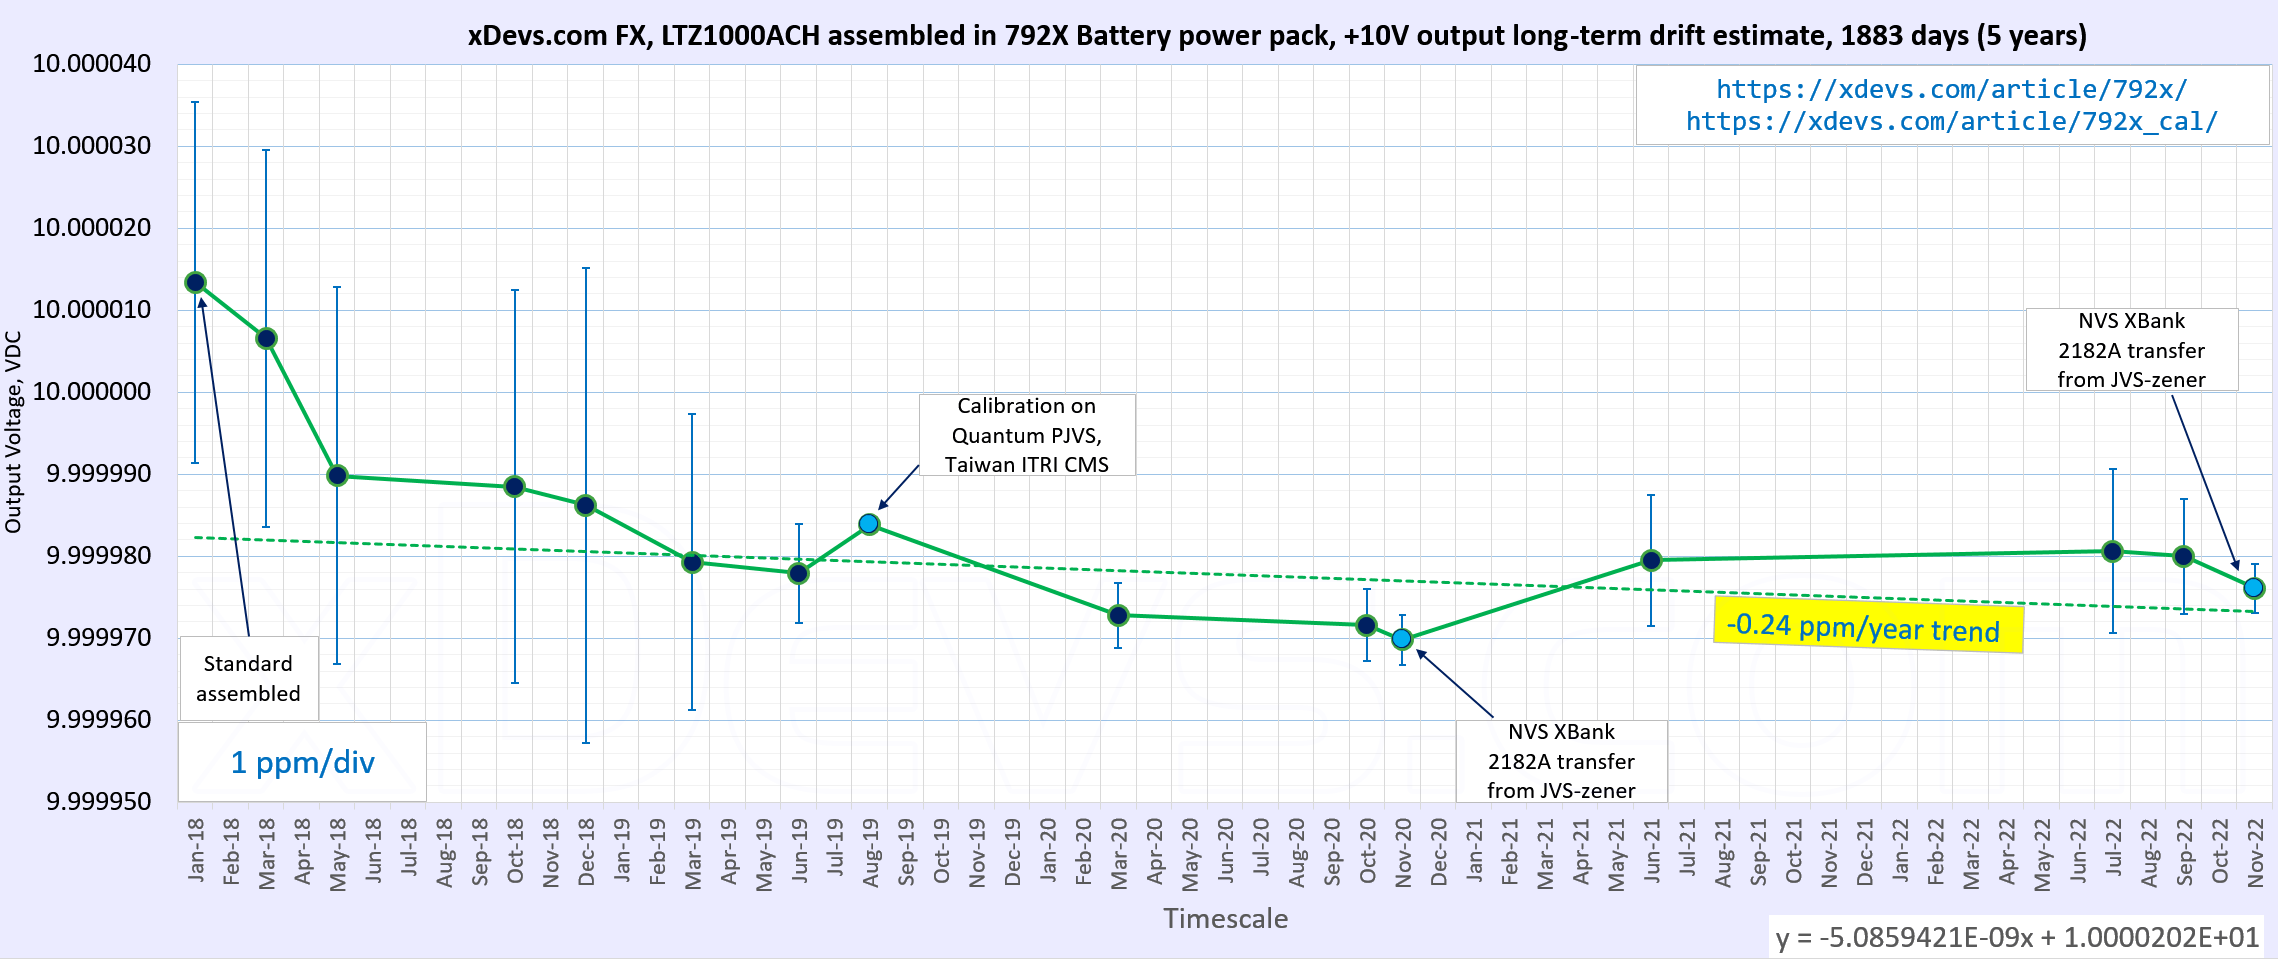
Image 38: 5 year drift of in-house xDevs.com 792X with same design FX LTZ1000A-unit
Traceability map now completed with all DC zener standards used to determine Type A uncertainty of the calibration. This is a glimpse of how way to maintain the low uncertainty for voltage measurements in the lab. Very similar procedures are essentially used for all good accredited laboratories, since only very few can afford to purchase and operate complex quantum voltage standard system. Perhaps this will change in the distant future but for nearest decade we are still bound to cryogenic superconductor Josephson arrays for any absolute voltage uncertainty below 10-6 level.
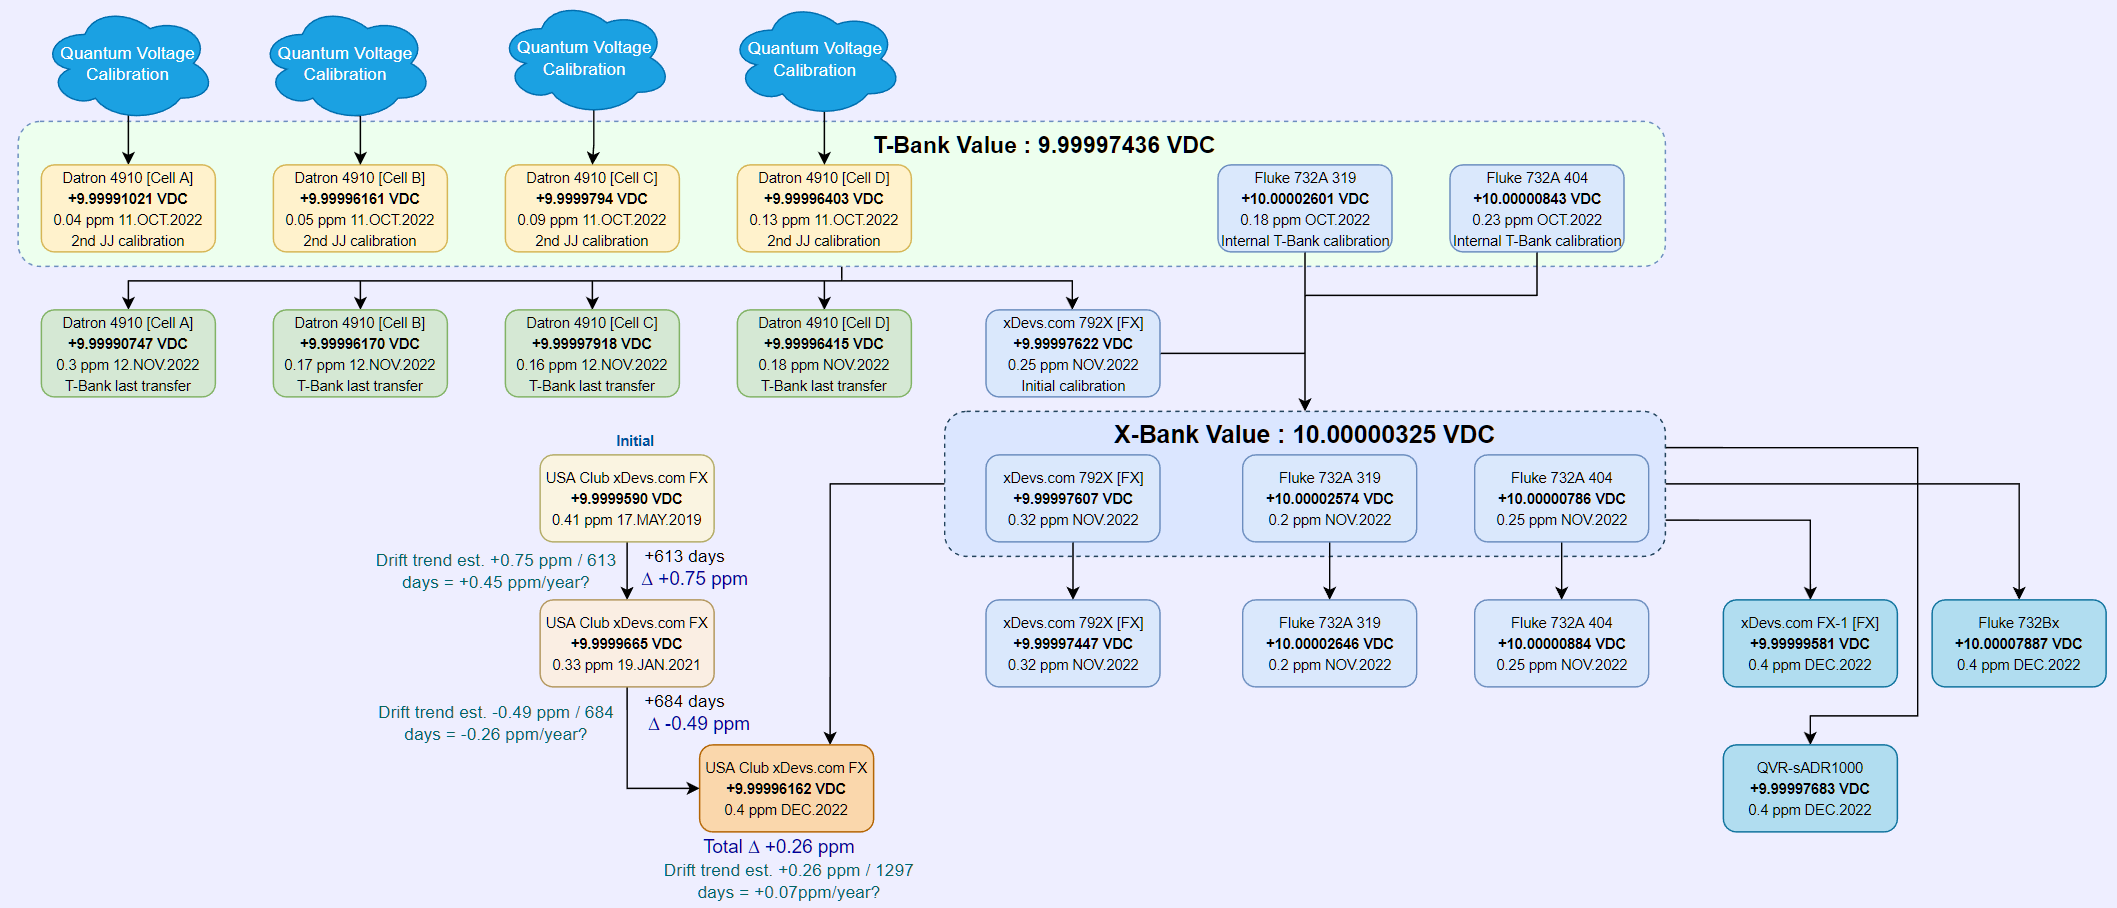
Image 39: Traceability map to quantum realization of voltage via direct transfers chain
On this note DC zener standard verification of travel FX from USA Club group is completed on January 15, 2023.
L&N 4040B resistance standard for USA CalClub Round 3
To make round 3 more interesting xDevs.com is happy to donate L&N 4040B 10000 Ω resistance standard with fresh calibration done on January 10, 2023. Hopefully it will be helpful to members for their transfers and experiments with hobby calibration chains. Measurement setup was explained in a dedicated review article about this unit. Feel free to check it for more details.

Image 40: Calibration and TCR performance of donated L&N 4040B resistance standard
With data from this calibration we can calculate new temperature coefficients α = +8.461 ppm/°C and β = -0.577 ppm/°C2. Reversal of TCR curve calculated to be at +30.3 °C, very close to last year value of +30.1 °C.
This would be suggest the optimal temperature for this standard use without air-bath. Offset from nominal 10 kΩ is now +5.77 ppm, which is still pretty good for this old standard.
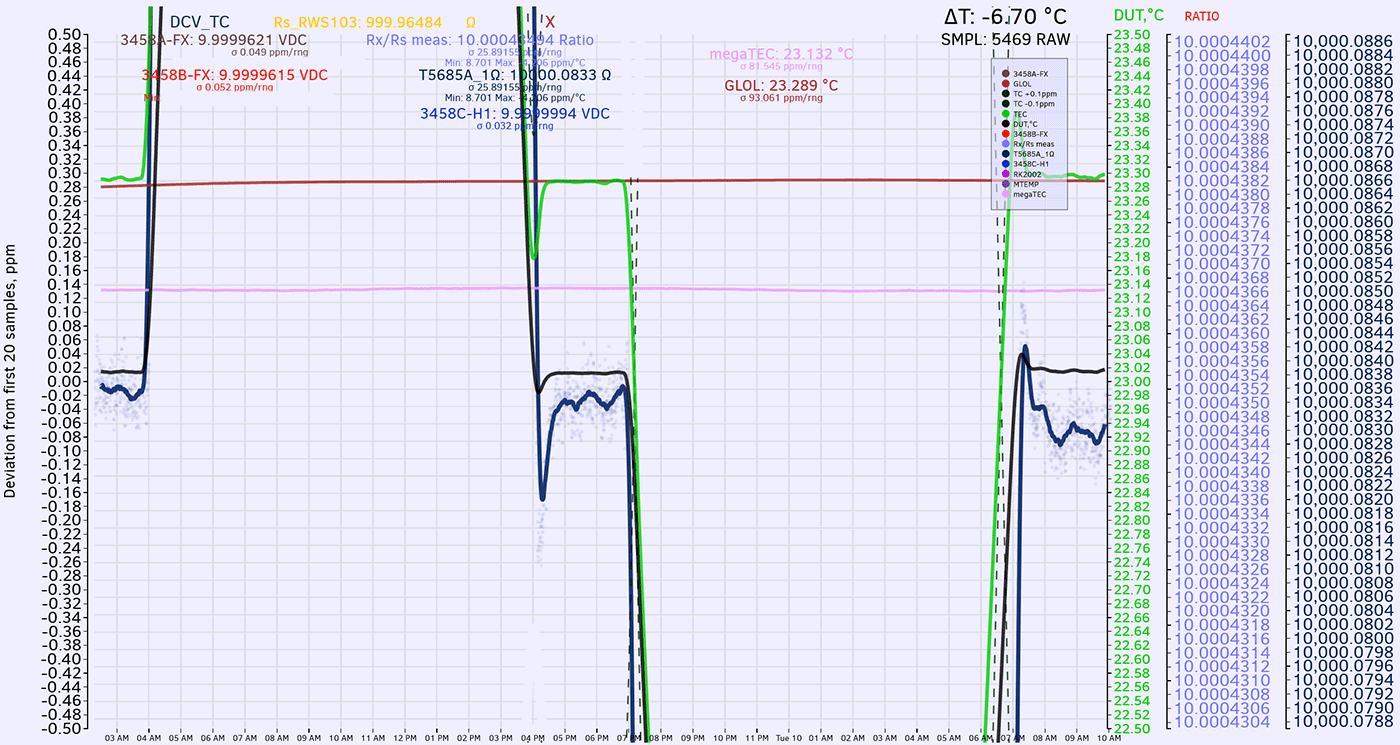
Image 41: Retrace hysteresis timescale plot of 4040B. Resistance points marked in dark blue chart
Retrace hysteresis due to temperature change is also very good for this standard. TCR measurement test sweep took 34 hours, with points key levels at +23.3 °C, +29.5 °C, +23.3 °C, +18.3 °C and final return to +23.3 °C. Final ratio deviation after this was under -0.1 ppm from original value at the beginning of the test.
And last but not least, final estimate of long-term drift for this Leeds & Northrup 4040B standard. Calculated resistance at new cardinal +23.0 °C point differs from previous verification result in February 2022 by -3.27 ppm. Guesstimated linear drift between two previous calibration points in June 4, 2017 and February 15, 2022 we obtain now new annual drift figures at -2.9 ppm/year and -3.6/year. Since xDevs.com’s best capability for 10 kΩ measurement back in 2017 was with 8½-digit HP 3458A DMM it is better to not use that point as reliable absolute measurement.
By using only two last high quality measurements with 9½-digit Direct Current Comparator MI 6010B bridge we can have a linear drift trend of -3.7 ppm/year. Keep this number only as a guideline estimate, since there are not enough points taken to have better statistical analysis.

Image 42: Long-term drift estimation using linear fit
At this point this resistor is packed in and shipped to the new owner at USA CalClub Round 3. Perhaps a few years from now it will return back for re-calibration so long-term drift could be updated at that date.
| L&N 4040B temperature | Absolute resistance | Deviation to 10 kΩ | Relative to T23°C reference |
|---|---|---|---|
| 18.0 °C | 9999.4904 Ω | -50.9 ppm | -56.7 ppm |
| 18.5 °C | 9999.5601 Ω | -43.9 ppm | -49.7 ppm |
| 19.0 °C | 9999.6269 Ω | -37.3 ppm | -43.0 ppm |
| 19.5 °C | 9999.6909 Ω | -30.9 ppm | -36.6 ppm |
| 20.0 °C | 9999.7519 Ω | -24.8 ppm | -30.5 ppm |
| 20.5 °C | 9999.8101 Ω | -18.9 ppm | -24.7 ppm |
| 21.0 °C | 9999.8654 Ω | -13.4 ppm | -19.2 ppm |
| 21.5 °C | 9999.9178 Ω | -8.21 ppm | -14.0 ppm |
| 22.0 °C | 9999.9673 Ω | -3.26 ppm | -9.03 ppm |
| 22.5 °C | 10000.0139 Ω | 1.39 ppm | -4.37 ppm |
| 23.0 °C | 10000.0577 Ω | 5.77 ppm | 0.00 ppm |
| 23.5 °C | 10000.0985 Ω | 9.85 ppm | 4.09 ppm |
| 24.0 °C | 10000.1365 Ω | 13.6 ppm | 7.90 ppm |
| 24.5 °C | 10000.1716 Ω | 17.1 ppm | 11.3 ppm |
| 25.0 °C | 10000.2038 Ω | 20.3 ppm | 14.6 ppm |
| 25.5 °C | 10000.2331 Ω | 23.3 ppm | 17.5 ppm |
| 26.0 °C | 10000.2596 Ω | 25.9 ppm | 20.1 ppm |
| 26.5 °C | 10000.2831 Ω | 28.3 ppm | 22.5 ppm |
| 27.0 °C | 10000.3038 Ω | 30.3 ppm | 24.6 ppm |
| 27.5 °C | 10000.3216 Ω | 32.1 ppm | 26.3 ppm |
| 28.0 °C | 10000.3365 Ω | 33.6 ppm | 27.8 ppm |
Table 18: Calculated resistance table for 4040B at different temperatures
Despite serious age L&N 4040B proved to have good performance to act as a decent standard for typical hobby level lab with modest measurement requirements at 5½-digit level or similar. Temperature control is very welcome due to noticeable TCR, but the device is useful even without it. Full measurement trace for last calibration is also provided in the table below.
| Model and serial | Calibration date | Assigned value | Uncertainty | Temperature coefficient | Method | Test current | Note |
|---|---|---|---|---|---|---|---|
| ESI SR104 reference | MI 8.JUN.2021 | 10000.00128 Ω at +23 °C | ±0.1 ppm | α = -0.03 ppm/°C, β = -0.028 ppm/°C2, τ = >8 hour | DCC & 6000A HSB | 0.000316 A | Primary |
| Transfer RWS103 RSTD | xDevs.com JAN.2023 | 999.96484 Ω at +23 °C | ±0.3 ppm | Linear TC = +0.87 ppm/°C | DCC vs ESI SR104 | 0.00316 A | Transfer |
| This L&N 4040B S/N 1147296 | xDevs.com 10.JAN.2023 | 10000.0577 Ω at +23 °C | ±0.4 ppm | α +8.46 ppm/°C, β = -0.58 ppm/°C2, τ = <1 hour | DCC vs RWS103 | 0.000316 A | Final calibration |
Table 2: Final measurement on L&N 4040B with traceability to accredited reference
And traceability map:

Image 43: Traceability map of 4040B resistance standard measurements
Resistance measurement at ppm-level uncertainty is quite tricky business but even old standards still can have pretty good results at modest 4½ or 5½-digit level, especially when good temperature control/monitoring is added to account for large TCR. Hopefully it will be useful for USA Cal Club members.
Possible improvements and suggestions for USA Cal Club participants
Key importance of this metrology calibration transfer is access to measurement results and data for further analysis. All measurements (good or bad!) need to be accessible to everyone publicly, so total transfer and overall condition of used travel standard can be analyzed and checked. Without careful analysis and peer review of measurements by different members the gathered statistics is just a set of numbers without much meaning.
I’ve suggested using xDevs.com’s dedicated storage space and some members did actually use it to upload data.
USA Club Round 1 data, 2018
USA Club Round 2 data, 2019-2020
Good habit is to upload data and report findings/notes on the forum. I did so during FX reference recalibration and for initial donation.
Also since not everybody might be as tech savvy to upload/download files from remote servers, it’s a good idea to include and forward any paper calibration report or measurement data summary with shipped travel standards kit. There are some old school metrologists who are still using pencil and notepad (paper one, not electronic) for their ppms.
Would be good to see members of Cal Clubs perform actual uncertainty analysis of their measurement and provide a more detailed history of their used equipment. This would be helpful to assert both quality of the measurement on travel standards kit and stability of the equipment used to perform measurements.
Perhaps it is a good idea to have the travel kit travel in star manners between pilot round organizer and members, so additional checks on the standards can be performed, to make sure every “leg” of the measurements have good quality transfers. To be honest I’m quite impressed with how club’s FX reference is holding up, despite multiple shipments in cold unpowered conditions and various setups / users testing it.
More members with their own traceable calibrated and well known standards also can help to improve the quality of the USA Cal Club activities, so the data can be checked by multiple members, instead of relying on just one member with low uncertainty.
Update from September 2023
LO post on FX reference got damaged in the end of August 2023 and it was repaired and recalibrated once more by xDevs. Details are published in this separate article.
Conclusion
In this article we looked at calibration results for Keithley 2002, LTZ1000A-based reference performance and verification for old 10000 Ω resistance standard. Full traceability for measurements was obtained via a chain of direct measurements between reference standards and DUT units.

Image 44: Overall traceability of all devices tested for USA Club members
Performance of USA Cal Club FX zener device was confirmed good and I’m looking forward to seeing what members do with it. Keithley 2002, USA Club FX and L&N 4040B references are packaged and shipped to the current Round 3 organizer using UPS air shipment on January 16, 2023 and confirmed received in good shape a few days later. I’m pretty happy with the results and hopefully will see this FX reference again in 2024.
On this point recalibration and all planned activities for this are concluded. All these activities were performed free of any charges, since xDevs.com project goal is to share metrology passion and demonstrate importance of good quality measurements. Hopefully this publication and others will inspire today’s generation of engineers and metrologists to join this very interesting (and often challenging) field of industry.
If you want to join Round 3 of USA Cal Club, feel free to reach out to RandallMcRee on EEVBlog metrology forum section. He will be organizing and starting Round 3 sometime soon, once the kit is ready and participants list determined. Due to logistics reasons this club is open for the hobby non-commercial labs in USA only.
Author would like to credit Martin R. for valuable feedback and review of this article, Todd and Igor for the support of our ongoing projects and all heroes in metrology community who inspired and made stuff like this possible.
Discussion is very welcome thru comment section or at our own IRC chat server: irc.xdevs.com (standard port 6667, channel: #xDevs.com). Web-interface for access mirrored on this page. If you have information and performance reports of various standards not mentioned or listed in this article, feel free to provide them and we will showcase them on site.
Modified: Feb. 15, 2024, 4:58 p.m.
References
- FX referemce repair report in Q4'2023
- Large DIY environmental chamber for DMM/T&M gear testing
- Testing INL on different commercial digitizers and DMMs
- Study of temperature coefficient on 260 precision resistors
- Project 792X - 10V "FX" reference and Fluke 792A support pack
- Calibration procedure and results for xDevs/Fluke 792X 10V DC Reference
- Keithley Model 2002 - 8.5 digit system DMM review
- Keithley Model 2002 8.5-digit DMM repair
- DataProof 160A low thermal EMF scanner teardown
- ESI SR104 10000 Ohm resistance standard review
- Benchmarks of old L&N 4040B 10000 Ohm resistance standard